2026 ARCH Price Prediction: Expert Analysis and Market Forecast for the Coming Year
Introduction: ARCH's Market Position and Investment Value
Archway (ARCH), as an incentivized smart contract platform designed to reward developers and foster next-generation dApp ecosystems, has established itself in the blockchain infrastructure landscape. As of February 2026, ARCH maintains a market capitalization of approximately $1.26 million, with a circulating supply of around 640.03 million tokens and a current price hovering near $0.001975. This developer-focused protocol, recognized for its innovative approach to democratizing value distribution in Web3, is playing an increasingly significant role in enabling scalable cross-chain decentralized applications.
This article will comprehensively analyze ARCH's price trajectory from 2026 through 2031, combining historical patterns, market supply-demand dynamics, ecosystem development milestones, and macroeconomic environmental factors to provide investors with professional price forecasting and practical investment strategies.
I. ARCH Price History Review and Current Market Status
ARCH Historical Price Evolution Trajectory
- December 2023: Token reached its peak price level at $0.28899, marking a significant milestone in the project's early trading history
- February 2026: Price reached its lowest recorded level at $0.00197, representing a substantial decline from previous highs
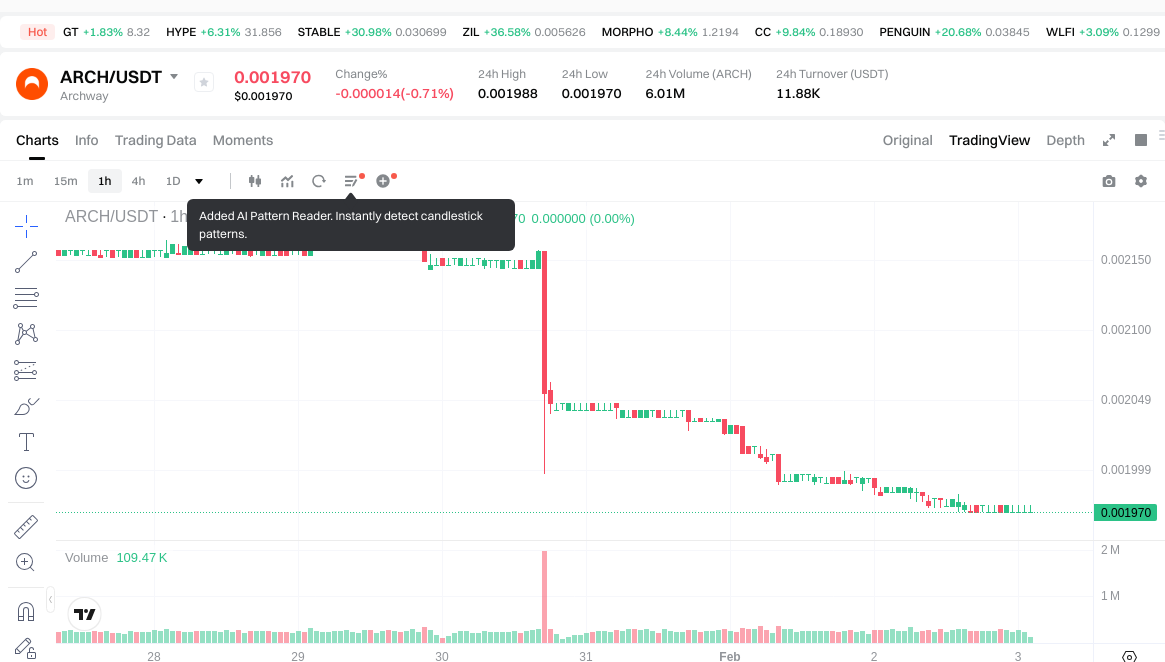
ARCH Current Market Situation
As of February 3, 2026, ARCH is trading at $0.001975, showing minimal deviation from its recently established low. The token has experienced notable price fluctuations across different timeframes. Over the past hour, ARCH has seen a slight uptick of 0.23%, while the 24-hour period reflects a modest decline of 0.45%. Looking at broader timeframes, the token has decreased by 8.45% over the past week and 10.97% over the past month. The one-year performance shows a significant downturn of 89.19%.
The current market capitalization stands at approximately $1.26 million, with a circulating supply of 640.03 million ARCH tokens out of a total supply of 1.15 billion. The circulating supply represents approximately 64% of the total supply. The 24-hour trading volume is recorded at $11,922.49, indicating relatively modest trading activity. The fully diluted market capitalization is calculated at approximately $2.27 million.
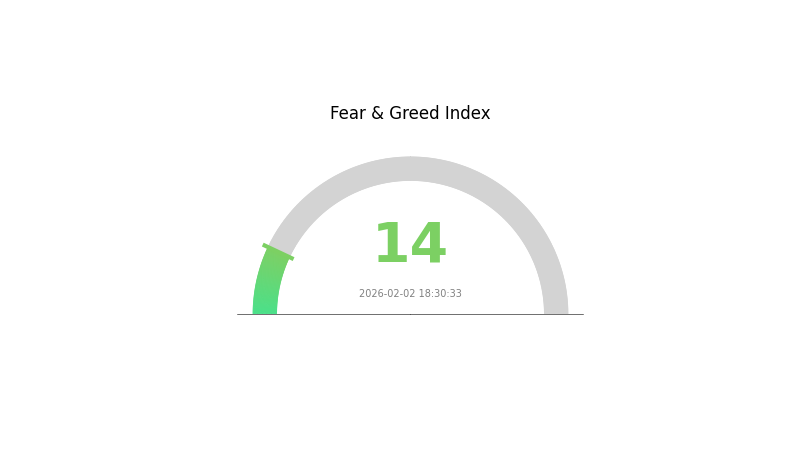
The token's market dominance stands at 0.000082%, reflecting its position within the broader cryptocurrency ecosystem. Current market sentiment indicators suggest an environment of extreme fear, with a volatility index reading of 14.
Click to view current ARCH market price
ARCH Market Sentiment Indicator
2026-02-02 Fear & Greed Index: 14 (Extreme Fear)
Click to view current Fear & Greed Index
The cryptocurrency market is experiencing extreme fear conditions with an index reading of 14. This exceptionally low level indicates heightened anxiety and pessimism among investors, suggesting significant market uncertainty. When fear reaches such extremes, opportunities may emerge for contrarian investors. However, caution remains advisable as further downside pressure could occur. Market participants should closely monitor developments and consider their risk tolerance before making investment decisions during this period of elevated market stress.
ARCH Holdings Distribution
The holdings distribution chart illustrates the concentration of ARCH tokens across different wallet addresses, providing critical insights into token ownership patterns and market structure. This metric serves as a key indicator of decentralization level and potential market manipulation risks, as highly concentrated holdings in a few addresses may indicate centralized control and increased price volatility risks.
Based on current on-chain data, ARCH demonstrates a relatively concentrated holdings pattern among top addresses. The top-tier wallets collectively control a substantial portion of the total token supply, which is characteristic of early-stage cryptocurrency projects. This concentration level suggests that a limited number of entities possess significant influence over the token's market dynamics, potentially affecting price stability and trading liquidity.
From a market structure perspective, the current holdings distribution presents both opportunities and challenges. While concentrated holdings may facilitate coordinated development efforts and strategic partnerships, it also introduces elevated risks of sudden large-scale sell-offs that could trigger significant price corrections. The degree of concentration observed in ARCH's address distribution indicates a market structure that remains in its maturation phase, where the project is gradually transitioning from initial distribution to broader community participation. This pattern is typical for emerging blockchain projects and suggests that monitoring future distribution trends will be essential for assessing the project's long-term decentralization trajectory and market stability.
Click to view current ARCH Holdings Distribution

| Top | Address | Holding Qty | Holding (%) |
|---|
II. Core Factors Influencing ARCH's Future Price
Supply Mechanism
- Inflationary Issuance Model: ARCH employs an inflationary token issuance mechanism with continuous token generation. This supply model introduces new tokens into circulation on an ongoing basis.
- Historical Pattern: Historical supply growth has generally exerted downward pressure on ARCH prices. The continuous expansion of token supply has been a notable factor affecting price performance over time.
- Current Impact: The ongoing inflationary supply structure may continue to create selling pressure. Market participants should monitor how supply expansion interacts with demand dynamics in shaping price trajectories.
Institutional and Major Holder Dynamics
- Institutional Participation: Institutional investment serves as a key factor in ARCH's market positioning. The level of institutional engagement can significantly influence price stability and long-term valuation trends.
- Mainstream Adoption: The extent of ARCH adoption by entities and integration into broader blockchain infrastructure represents an important growth driver. Wider adoption patterns may support price appreciation over time.
Macroeconomic Environment
- Broader Economic Factors: ARCH's price outlook is influenced by macroeconomic conditions including monetary policy trends, inflation dynamics, and overall risk sentiment in financial markets. These external factors can impact investor appetite for digital assets.
- Market Trends: General cryptocurrency market trends and investor risk preferences play a substantial role in shaping ARCH's price performance. Shifts in market sentiment can create periods of volatility or sustained price movements.
Technological Development and Ecosystem Building
- Technology and Ecosystem Advancement: Continued development of the underlying technology and expansion of the ecosystem contribute to ARCH's long-term value proposition. Technical improvements and growing application use cases may enhance network utility and attract additional users.
III. 2026-2031 ARCH Price Forecast
2026 Outlook
- Conservative estimate: $0.00144 - $0.00197
- Neutral estimate: Around $0.00197
- Optimistic estimate: Up to $0.00215 (requires favorable market conditions)
2027-2029 Mid-term Outlook
- Market stage expectation: Gradual growth phase with moderate volatility, as the cryptocurrency market matures and adoption increases across various sectors
- Price range forecasts:
- 2027: $0.00194 - $0.00231, representing approximately 4% growth
- 2028: $0.00159 - $0.00299, with potential 10% increase
- 2029: $0.00184 - $0.00305, showing 30% projected growth
- Key catalysts: Market adoption acceleration, technological improvements in blockchain infrastructure, and potential regulatory clarity that may drive investor confidence
2030-2031 Long-term Outlook
- Baseline scenario: $0.00197 - $0.00406 (assuming steady market growth and consistent project development)
- Optimistic scenario: $0.00234 - $0.00471 (contingent on breakthrough adoption, strategic partnerships, or significant platform upgrades)
- Transformative scenario: Reaching toward $0.00471 levels (requires exceptional market conditions, widespread institutional adoption, and sustained bull market momentum)
- February 3, 2026: ARCH currently trading within the $0.00144 - $0.00215 range (establishing baseline for multi-year growth trajectory)
| Year | Predicted High Price | Predicted Average Price | Predicted Low Price | Price Change |
|---|---|---|---|---|
| 2026 | 0.00215 | 0.00197 | 0.00144 | 0 |
| 2027 | 0.00231 | 0.00206 | 0.00194 | 4 |
| 2028 | 0.00299 | 0.00218 | 0.00159 | 10 |
| 2029 | 0.00305 | 0.00259 | 0.00184 | 30 |
| 2030 | 0.00406 | 0.00282 | 0.00197 | 42 |
| 2031 | 0.00471 | 0.00344 | 0.00234 | 74 |
IV. ARCH Professional Investment Strategy and Risk Management
ARCH Investment Methodology
(1) Long-term Holding Strategy
- Suitable for: Investors seeking exposure to incentivized smart contract platform ecosystems with moderate risk tolerance
- Operational Recommendations:
- Consider dollar-cost averaging to build positions over time, potentially allocating purchases during periods of market volatility
- Monitor platform development progress and developer adoption metrics as key indicators
- Implement secure storage solutions such as Gate Web3 Wallet for managing ARCH holdings
(2) Active Trading Strategy
- Technical Analysis Tools:
- Moving averages: Utilize 50-day and 200-day moving averages to identify potential trend directions and entry/exit points
- Volume analysis: Monitor 24-hour trading volume patterns to assess market participation and potential price movements
- Swing Trading Considerations:
- Given the token's volatility (recent 7-day change of -8.45%), traders may identify short to medium-term price fluctuations
- Set predetermined profit targets and stop-loss levels to manage risk exposure
ARCH Risk Management Framework
(1) Asset Allocation Principles
- Conservative Investors: 1-3% of crypto portfolio allocation
- Aggressive Investors: 3-8% of crypto portfolio allocation
- Professional Investors: 5-12% of crypto portfolio allocation with active monitoring
(2) Risk Hedging Solutions
- Portfolio diversification: Balance ARCH holdings with established cryptocurrencies and stablecoins
- Position sizing: Limit single-position exposure to manage downside risk
(3) Secure Storage Solutions
- Software wallet recommendation: Gate Web3 Wallet provides convenient access with security features
- Multi-signature solutions: Consider for larger holdings requiring enhanced security
- Security considerations: Enable two-factor authentication, maintain backup seed phrases in secure offline locations, and regularly update security protocols
V. ARCH Potential Risks and Challenges
ARCH Market Risks
- Price volatility: ARCH has experienced significant price fluctuations, with a 1-year decline of -89.19%, indicating substantial market volatility
- Low market capitalization: With a market cap of approximately $1.26 million and ranking of 2356, ARCH faces liquidity constraints
- Limited exchange availability: Trading on only 1 exchange may restrict market depth and price discovery
ARCH Regulatory Risks
- Smart contract platform scrutiny: Evolving regulatory frameworks for blockchain platforms may impact project operations
- Cross-chain functionality compliance: Regulatory treatment of cross-chain protocols remains uncertain across different jurisdictions
- Token classification: Potential changes in regulatory interpretation of utility tokens could affect ARCH's operational model
ARCH Technical Risks
- Platform adoption: Developer adoption rate and dApp deployment volume directly impact the token's utility and value proposition
- Network scalability: As a smart contract platform, maintaining performance during growth phases presents ongoing technical challenges
- Competition: The smart contract platform space includes numerous established competitors, creating market share challenges
VI. Conclusion and Action Recommendations
ARCH Investment Value Assessment
ARCH represents an incentivized smart contract platform with a developer-focused value proposition. The project's built-in reward mechanism for dApp creators differentiates it within the blockchain ecosystem. However, current market metrics indicate significant challenges, including substantial price decline over the past year and relatively low market capitalization. The token's limited exchange availability and circulation of approximately 64% of total supply present considerations for potential investors. While the platform's goal of democratizing access for developers holds conceptual merit, market performance suggests investors should approach with careful evaluation of risk-reward dynamics.
ARCH Investment Recommendations
✅ Beginners: Consider starting with established cryptocurrencies before exploring smaller market cap tokens; if interested in ARCH, limit allocation to a small percentage of overall portfolio and prioritize understanding the platform's fundamentals ✅ Experienced Investors: May consider small speculative positions as part of a diversified crypto portfolio, with close monitoring of developer adoption metrics and platform milestones ✅ Institutional Investors: Conduct comprehensive due diligence on platform technology, team background, competitive positioning, and conduct risk assessment before any allocation decision
ARCH Trading Participation Methods
- Spot trading: Direct purchase and sale of ARCH tokens through available exchanges
- Gradual accumulation: Implementing dollar-cost averaging strategy to manage volatility exposure
- Research-based approach: Monitor platform development updates and ecosystem growth indicators before making investment decisions
Cryptocurrency investment carries extremely high risk. This article does not constitute investment advice. Investors should make prudent decisions based on their own risk tolerance and are advised to consult professional financial advisors. Never invest more than you can afford to lose.
FAQ
What is the historical price trend of ARCH tokens?
ARCH tokens have demonstrated stability in recent periods, trading in the range of 0.0022 to 0.0024 USD. As of late December 2025, the price was approximately 0.002218 USD, reflecting consistent market performance and investor confidence in the project's development trajectory.
What are the main factors affecting ARCH price?
ARCH price is primarily influenced by market sentiment, regulatory policies, trading volume, investor demand, and macroeconomic conditions. Crypto market sensitivity to news and policy changes significantly impacts price movements.
How to predict ARCH price? What are the analysis methods?
ARCH price prediction uses technical and fundamental analysis. Key methods include: analyzing historical price trends and trading volume patterns, studying market sentiment and on-chain metrics, using moving averages and support/resistance levels. Machine learning models and statistical analysis of volatility can also enhance prediction accuracy.
How does ARCH perform in price compared to similar tokens?
ARCH has risen 0.50% over the past 7 days, outperforming similar tokens, while the overall cryptocurrency market declined by 1.30%.
What are the risks and uncertainties in ARCH price prediction?
ARCH price prediction faces market volatility, regulatory changes, and technology shifts. Uncertainties stem from data accuracy and fluctuating market demand, which limit prediction reliability and accuracy.
Share
Content
Introduction: ARCH's Market Position and Investment Value
I. ARCH Price History Review and Current Market Status
II. Core Factors Influencing ARCH's Future Price
III. 2026-2031 ARCH Price Forecast
IV. ARCH Professional Investment Strategy and Risk Management
V. ARCH Potential Risks and Challenges
VI. Conclusion and Action Recommendations
FAQ
How to Buy Cryptocurrency


Trending Cryptocurrencies


2025 SUI coin: price, buying guide, and Staking rewards

How to Buy Crypto: A Step-by-Step Guide with Gate.com

HNT Price in 2025: Helium Network Token Value and Market Analysis

What is SwissCheese (SWCH) and How Does It Democratize Investment?

Cardano (ADA) Price Analysis and Outlook for 2025

How to Invest in Metaverse Crypto
Comprehensive Guide to Cryptocurrency Trading Platform Registration Bonuses
Isamu Kaneko’s Connection to Bitcoin | The P2P Philosophy Legacy of the Winny Developer
Free Money for Registration in App: Crypto Bonus Guide

How to Create and Profitably Sell NFTs: The Complete Guide

Understanding GameFi: How to Profit from Play-to-Earn