This comprehensive analysis examines ATR (Artrade Token), a pioneering art RWA marketplace token currently trading at $0.001193 with a $1.50M market cap. The article evaluates ATR's extreme volatility—down 96.04% from its $0.104 all-time high—and provides price forecasts through 2031, ranging from conservative ($0.00087-$0.00119 in 2026) to optimistic scenarios ($0.00292 by 2029). Key sections cover historical performance, market sentiment analysis, ATR holding distribution patterns, and technical factors influencing price dynamics. Professional investment strategies include long-term holding for RWA believers and active trading approaches, complemented by robust risk management frameworks emphasizing portfolio allocation (1-8% exposure) and secure storage via Gate Web3 Wallet. The analysis identifies significant risks including extreme volatility, limited liquidity ($85,950 daily volume), regulatory uncertainty surrounding tokenized art assets, and smart contract dependencies. Suitable for risk-tolerant inve
Introduction: ATR's Market Position and Investment Value
Artrade (ATR), as a pioneering marketplace for art RWA (Real World Assets), has been developing its ecosystem since its launch in 2022. As of 2026, ATR maintains a market capitalization of approximately $1.50 million, with a circulating supply of around 1.26 billion tokens, and the price stabilizing at approximately $0.001193. This asset, positioned at the intersection of art and blockchain technology, is playing an increasingly important role in the tokenization of real-world art assets.
This article will comprehensively analyze ATR's price trends from 2026 to 2031, combining historical patterns, market supply and demand dynamics, ecosystem development, and macroeconomic conditions to provide investors with professional price forecasts and practical investment strategies.
I. ATR Price History Review and Market Status
ATR Historical Price Evolution Trajectory
- 2024: The token reached its all-time high at $0.104 on April 3rd, marking a significant milestone in the project's market performance during this period
- 2026: The price experienced substantial downward pressure, falling to its all-time low of $0.001168 on February 1st, representing a notable market correction phase
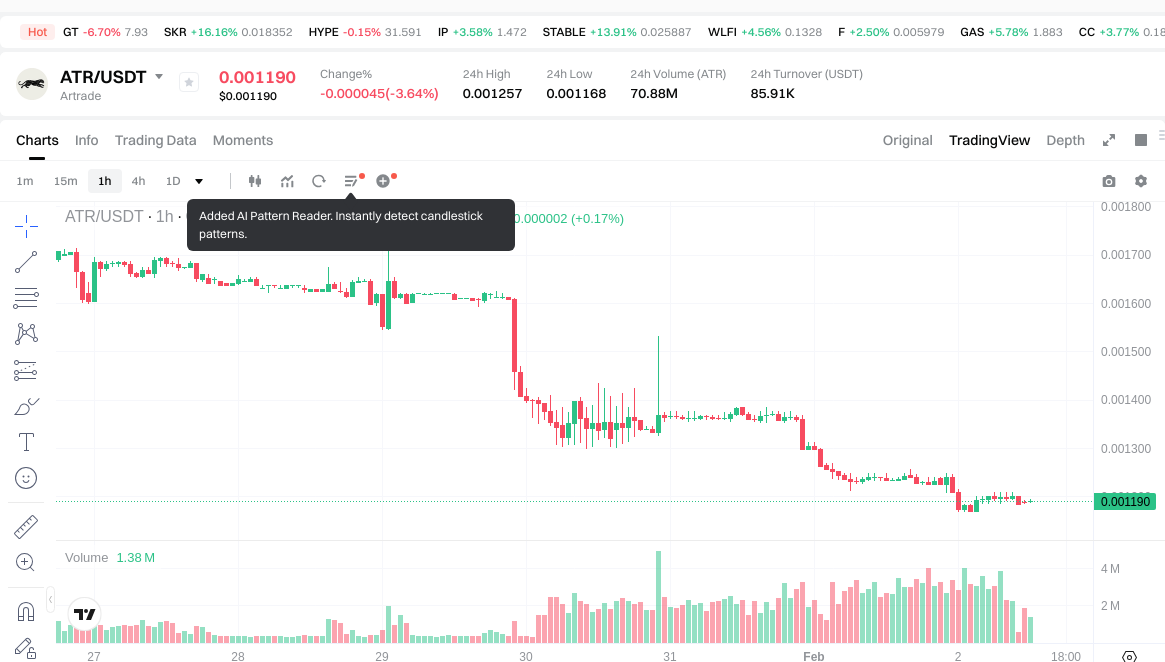
ATR Current Market Situation
As of February 2nd, 2026, ATR is trading at $0.001193, showing a slight recovery from its recent low. The token has experienced mixed short-term performance, with a modest gain of 0.08% over the past hour, but facing downward pressure with a 3.4% decline over the 24-hour period.
Over extended timeframes, the token has encountered significant bearish momentum, declining 29.88% over the past week and 43.45% over the past month. The annual performance shows a substantial decrease of 96.04%, reflecting broader market challenges and shifting investor sentiment.
The 24-hour trading volume stands at $85,949.57, with the current market capitalization at approximately $1.50 million. The circulating supply represents 70.01% of the total supply, with 1,260,104,055 ATR tokens in circulation out of a maximum supply of 1.8 billion tokens. The fully diluted market cap is estimated at $2.14 million.
The token maintains a market dominance of 0.000080%, indicating its position as a smaller-cap asset within the broader cryptocurrency ecosystem. With 12,777 holders, the project demonstrates a modest but established user base.
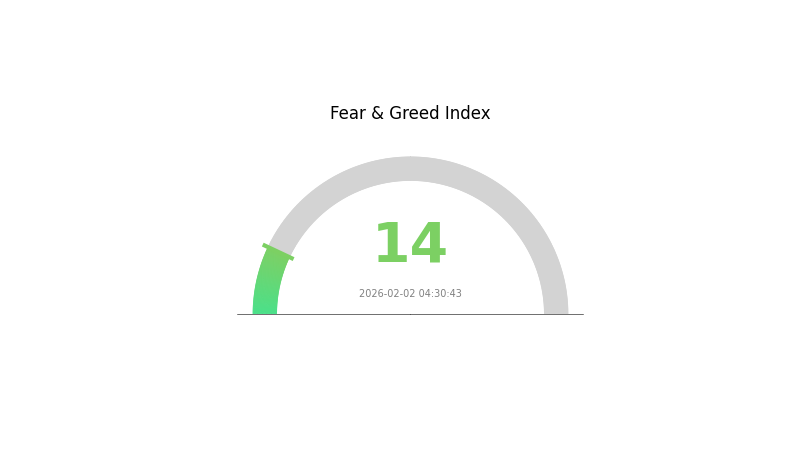
The current market sentiment index registers at 14, indicating an extreme fear environment, which typically characterizes periods of heightened caution among market participants.
Click to view the current ATR market price
ATR Market Sentiment Indicator
2026-02-02 Fear and Greed Index: 14 (Extreme Fear)
Click to view current Fear & Greed Index
The crypto market is experiencing extreme fear with an index reading of just 14. This indicates heightened panic and pessimism among investors, suggesting a potential capitulation phase. During such periods, contrarian investors often view it as an accumulation opportunity, as extreme fear historically precedes market recoveries. However, exercise caution and conduct thorough research before making investment decisions. Monitor market developments closely for signs of stabilization.
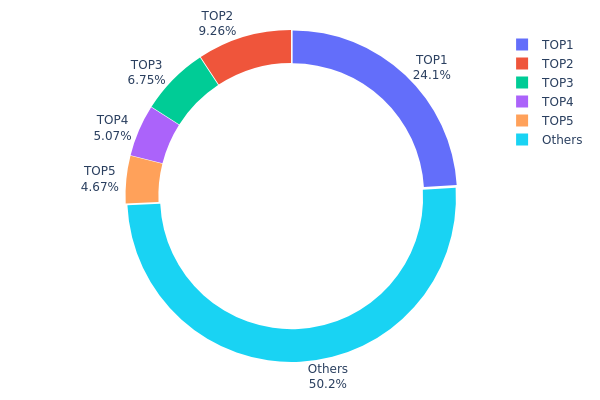
ATR Holding Distribution
The holding distribution chart reveals the concentration of token ownership across different addresses on the blockchain. By analyzing the proportion of tokens held by top addresses versus smaller holders, this metric provides insights into the degree of decentralization and potential market manipulation risks within the ATR ecosystem.
According to current data, the top address holds approximately 302,864.42K ATR tokens, representing 24.05% of the total supply, while the second-largest holder controls 9.25% (116,568.09K tokens). The top five addresses collectively account for 49.78% of the circulating supply, with the remaining 50.22% distributed among other addresses. This distribution pattern indicates a moderate level of concentration, where nearly half of the supply is controlled by a small number of addresses. Such concentration poses inherent risks to market stability, as large holders possess significant influence over price movements through potential coordinated selling or accumulation activities.
From a market structure perspective, this holding pattern suggests ATR maintains a relatively balanced but not fully decentralized ownership structure. While the majority holder's 24.05% stake provides them considerable market influence, the fact that over 50% remains distributed among smaller addresses offers some resistance against single-entity manipulation. However, investors should remain vigilant about potential volatility risks stemming from coordinated actions by top holders, particularly during periods of low trading volume or market uncertainty.
Click to view current ATR Holding Distribution
| Top |
Address |
Holding Qty |
Holding (%) |
| 1 |
5ktznV...xFtnr6 |
302864.42K |
24.05% |
| 2 |
ASTyfS...g7iaJZ |
116568.09K |
9.25% |
| 3 |
7XQtbQ...JjASe6 |
85000.00K |
6.75% |
| 4 |
5Q544f...pge4j1 |
63798.31K |
5.06% |
| 5 |
u6PJ8D...ynXq2w |
58836.69K |
4.67% |
| - |
Others |
632157.56K |
50.22% |
II. Core Factors Influencing ATR's Future Price
Market Volatility Dynamics
- Volatility Amplitude Measurement: ATR (Average True Range) is designed to focus on "volatility amplitude" rather than "price direction". Both sharp rises and falls in the market will push up ATR values, as its calculation is based on the absolute value of price movements.
- Historical Patterns: When ATR rises, it indicates intensifying market volatility and fierce long-short competition, typically occurring during trend initiations or major news releases. When ATR declines, it suggests contracting market volatility, entering consolidation phases or sideways trends, with energy accumulating.
- Current Impact: Market participants need to closely monitor how market trends, economic data, and policy changes affect ATR values, and adjust trading strategies accordingly.
Macroeconomic Environment
- Economic Data Influence: GDP growth rates, unemployment rates, and inflation rates reflect economic health conditions and affect commodity demand, thereby influencing ATR indicator performance.
- Policy Changes: Monetary policies and regulatory adjustments from major central banks can trigger market volatility changes, directly impacting ATR values.
- Market Structure Evolution: As market structures evolve, the application of ATR in trend confirmation and risk control continues to adapt, particularly in identifying price trend initiations and continuations.
Technical Development and Risk Management
- Dynamic Stop-Loss Applications: Through Donchian Channel identification of price breakthrough signals, setting fixed multiples of ATR stop-losses helps control risk while adopting pyramid-style position additions to follow trends.
- Trend Confirmation Capability: Research shows ATR has lower volatility and can more promptly and stably reflect price trends compared to traditional volatility indicators, with constructed trend trading strategies demonstrating better performance.
- Position Management: ATR enables investors to approximately grasp potential daily price fluctuations, helping optimize position sizing and risk management strategies.
III. 2026-2031 ATR Price Prediction
2026 Outlook
- Conservative Prediction: $0.00087 - $0.00119
- Neutral Prediction: Around $0.00119
- Optimistic Prediction: Up to $0.00175 (requires favorable market conditions and increased adoption)
2027-2029 Outlook
- Market Stage Expectation: ATR may enter a gradual growth phase, with potential price appreciation driven by broader crypto market trends and project developments
- Price Range Predictions:
- 2027: $0.00103 - $0.00197 (approximately 23% change from 2026 baseline)
- 2028: $0.00145 - $0.00243 (approximately 44% change from 2026 baseline)
- 2029: $0.00135 - $0.00292 (approximately 73% change from 2026 baseline)
- Key Catalysts: Market sentiment shifts, technological advancements, and ecosystem expansion
2030-2031 Long-term Outlook
- Baseline Scenario: $0.0014 - $0.0025 (assuming steady market conditions and continued project development)
- Optimistic Scenario: $0.0025 - $0.0029 (assuming strong market momentum and increased utility)
- Transformative Scenario: Up to $0.00292 (under exceptionally favorable conditions including widespread adoption and market bull cycle)
- 2026-02-02: ATR trading within early-year price discovery phase, with projected average around $0.00119
| Year |
Predicted High Price |
Predicted Average Price |
Predicted Low Price |
Price Change |
| 2026 |
0.00175 |
0.00119 |
0.00087 |
0 |
| 2027 |
0.00197 |
0.00147 |
0.00103 |
23 |
| 2028 |
0.00243 |
0.00172 |
0.00145 |
44 |
| 2029 |
0.00292 |
0.00207 |
0.00135 |
73 |
| 2030 |
0.0029 |
0.0025 |
0.0014 |
109 |
| 2031 |
0.00278 |
0.0027 |
0.00262 |
126 |
IV. ATR Professional Investment Strategy and Risk Management
ATR Investment Methodology
(I) Long-term Holding Strategy
- Suitable for: Art enthusiasts and RWA sector believers who recognize the value of fractional art ownership
- Operational Recommendations:
- Consider gradually accumulating positions during market downturns, particularly when the token trades near its historical lows
- Monitor the development of Artrade's marketplace ecosystem and platform user growth metrics
- Utilize Gate Web3 Wallet for secure storage with multi-signature features enabled
(II) Active Trading Strategy
- Technical Analysis Tools:
- Volume Analysis: Monitor the 24-hour trading volume ($85,949.57 as of February 2, 2026) to identify liquidity trends and potential breakout signals
- Support and Resistance Levels: Track the recent low of $0.001168 as key support and the 24-hour high of $0.001257 as immediate resistance
- Swing Trading Points:
- Consider the token's high volatility (-29.88% over 7 days, -43.45% over 30 days) which may present short-term trading opportunities
- Set strict stop-loss orders due to significant price fluctuations in the RWA art sector
ATR Risk Management Framework
(I) Asset Allocation Principles
- Conservative Investors: 1-2% of crypto portfolio
- Aggressive Investors: 3-5% of crypto portfolio
- Professional Investors: Up to 5-8% with active monitoring
(II) Risk Hedging Solutions
- Portfolio Diversification: Balance ATR holdings with established cryptocurrencies and other RWA tokens
- Position Sizing: Given the 96.04% decline from all-time high, limit exposure to amounts acceptable for potential total loss
(III) Secure Storage Solutions
- Hot Wallet Recommendation: Gate Web3 Wallet for convenient trading and staking capabilities
- Cold Storage Option: Hardware wallet solutions for long-term holdings exceeding $1,000 equivalent
- Security Considerations: Enable two-factor authentication, regularly backup recovery phrases, and never share private keys
V. ATR Potential Risks and Challenges
ATR Market Risks
- Extreme Volatility: The token has experienced a 96.04% decline over the past year, reflecting high price instability
- Limited Liquidity: With a 24-hour trading volume of approximately $85,950 and presence on only 4 exchanges, liquidity constraints may impact large trades
- Market Cap Position: Ranking at #2228 with a market cap of approximately $1.5 million indicates limited market depth
ATR Regulatory Risks
- RWA Compliance Uncertainty: As an art-backed RWA platform, regulatory frameworks for tokenized real-world assets remain evolving across jurisdictions
- Securities Classification: Fractional art ownership tokens may face scrutiny regarding securities law compliance in various regions
- Cross-border Regulations: International art trade regulations may impact platform operations and token utility
ATR Technical Risks
- Smart Contract Dependencies: Platform security relies on the integrity of Solana-based smart contracts
- Platform Development Risk: Project sustainability depends on continued marketplace development and user adoption
- Chain Performance: Operational efficiency is tied to Solana network performance and potential network disruptions
VI. Conclusion and Action Recommendations
ATR Investment Value Assessment
ATR represents an early-stage investment in the art RWA sector, offering exposure to the emerging intersection of fine art and blockchain technology. While the concept of fractional art ownership has long-term potential, investors should carefully weigh the significant short-term risks, including extreme volatility (down 96.04% from ATH), limited liquidity, and uncertain regulatory landscape. The token's current price near historical lows may present opportunities for risk-tolerant investors who believe in the RWA art market thesis, but the path to recovery remains uncertain.
ATR Investment Recommendations
✅ Beginners: Approach with extreme caution. If interested in the RWA art sector, limit exposure to less than 1% of your crypto portfolio and thoroughly research the platform's fundamentals first
✅ Experienced Investors: Consider small speculative positions (2-3% of crypto portfolio) with clear risk management protocols, including predetermined exit strategies
✅ Institutional Investors: Conduct comprehensive due diligence on platform operations, legal structure, and art authentication processes before considering any allocation
ATR Trading Participation Methods
- Spot Trading: Purchase ATR directly on Gate.com and other supporting exchanges, suitable for investors seeking straightforward exposure
- Dollar-Cost Averaging: Implement systematic purchasing over time to mitigate volatility impact, particularly appropriate given current market conditions
- Portfolio Integration: Incorporate as a small allocation within a diversified RWA or art-tech themed portfolio strategy
Cryptocurrency investment carries extremely high risks, and this article does not constitute investment advice. Investors should make prudent decisions based on their own risk tolerance and are advised to consult professional financial advisors. Never invest more than you can afford to lose.
FAQ
What is the ATR (Average True Range) indicator and how is it calculated?
ATR measures market volatility by calculating the largest of three values: today's high minus low, today's close minus yesterday's close, or yesterday's high minus low. Higher ATR indicates greater volatility, lower ATR indicates smaller price fluctuations.
How to use ATR indicator to predict price trends and determine trading risk?
ATR measures market volatility to assess price movement potential and trading risk levels. High ATR indicates increased volatility and larger price swings, while low ATR suggests stable conditions. Combine ATR with other technical analysis tools to optimize entry and exit points for better risk management.
What are the differences in ATR applications across different time periods (daily, hourly, minute)?
ATR on daily charts reflects long-term volatility for trend trading, hourly charts capture medium-term fluctuations for swing trading, and minute charts detect short-term price swings for scalping. Each timeframe serves different trading strategies and risk management approaches.
What are the advantages of ATR indicator compared to other technical indicators such as Bollinger Bands and volatility?
ATR detects volatility changes faster and more sensitively than Bollinger Bands, making it ideal for capturing rapid price swings. Unlike Bollinger Bands which focus on trend direction, ATR purely measures volatility magnitude, providing cleaner signals for stop-loss and position sizing strategies.
How to set stop loss and take profit levels based on ATR values in actual trading?
Set stop loss at 1-2 times the ATR value below entry price, and take profit at 2-3 times ATR above entry price. Adjust position sizing based on risk tolerance and market volatility to optimize trading outcomes.
* The information is not intended to be and does not constitute financial advice or any other recommendation of any sort offered or endorsed by Gate.