2026 AVC Price Prediction: Expert Analysis and Market Forecast for the Upcoming Year


Introduction: AVC's Market Position and Investment Value
AlterVerse (AVC), positioned as a decentralized metaverse project integrating gaming, NFTs, and DeFi elements, has been building its ecosystem since its inception. As of February 2026, AVC maintains a market capitalization of approximately $200,911, with a circulating supply of about 959 million tokens, and the price stabilizing around $0.0002095. This asset, known as a "blockchain-powered virtual universe platform," is playing an increasingly important role in the metaverse and Web3 gaming sectors.
This article will comprehensively analyze AVC's price trends from 2026 to 2031, combining historical patterns, market supply and demand dynamics, ecosystem development, and macroeconomic environment factors to provide investors with professional price forecasts and practical investment strategies.
I. AVC Price History Review and Market Status
AVC Historical Price Evolution Trajectory
- December 2024: Token launched on Gate.com at an initial price of $0.008, marking the project's entry into the trading market
- December 2024: Price reached a peak of $0.019 on December 15, representing a 137.5% increase from the launch price
- 2025-2026: Market experienced significant correction, with price declining from the peak to current levels around $0.0002095
AVC Current Market Status
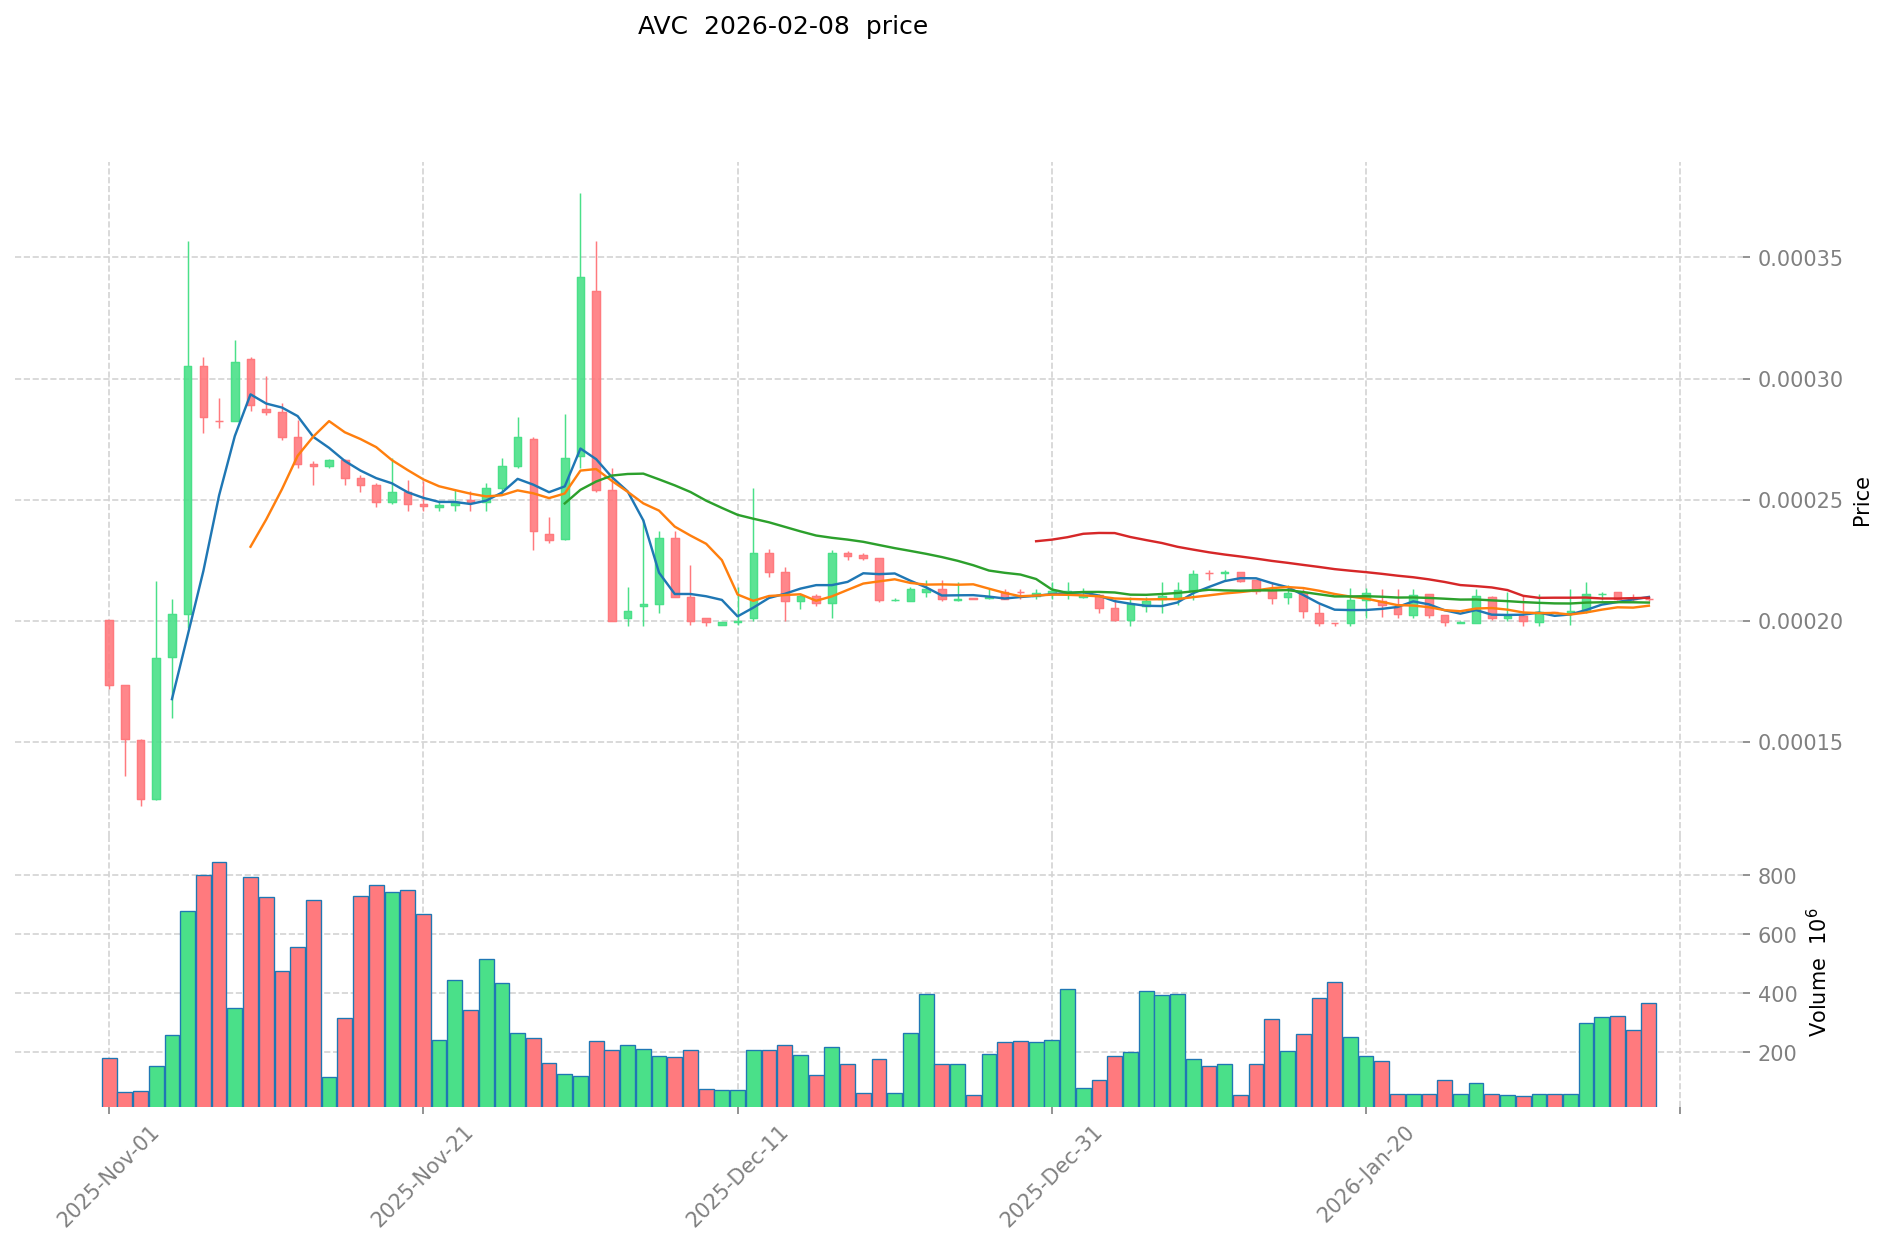
As of February 8, 2026, AVC is trading at $0.0002095, showing a relatively stable performance in the short term. The token has demonstrated mixed price movements across different timeframes, with a 2.86% increase over the past 7 days, while experiencing minor declines of 0.29% in the past hour and 0.04% in the past 24 hours.
The 24-hour trading volume stands at approximately $55,471, with the price fluctuating between $0.0002083 and $0.0002099 during this period. The current market capitalization is approximately $200,911, with a circulating supply of 959 million AVC tokens, representing 9.59% of the maximum supply of 10 billion tokens.
The token's fully diluted market capitalization is calculated at $2.095 million. AVC currently ranks #3945 in the cryptocurrency market, maintaining a market dominance of 0.000082%. The project has attracted approximately 19,790 token holders, indicating a growing community presence in the ecosystem.
Click to view current AVC market price
AVC Market Sentiment Index
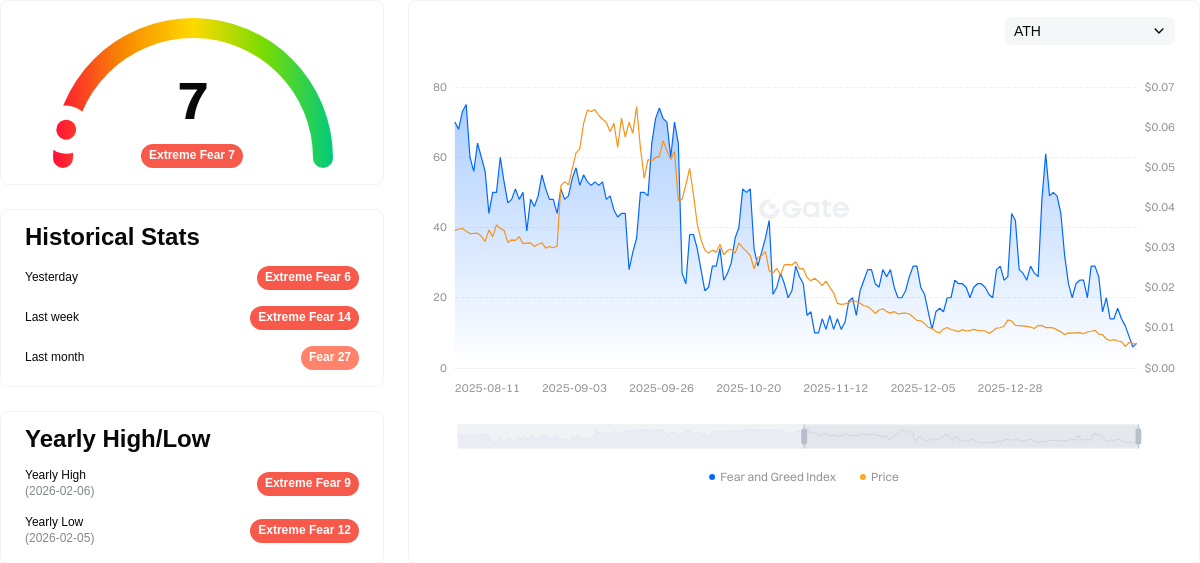
02-08-2026 Fear and Greed Index: 7 (Extreme Fear)
Click to view current Fear & Greed Index
The crypto market is currently experiencing extreme fear, with the Fear and Greed Index hitting 7 points. This indicates significant market pessimism and investor anxiety. During such phases, price volatility tends to increase as panic selling dominates trading activity. However, historically, extreme fear periods have often presented buying opportunities for long-term investors. Market participants should exercise caution while monitoring potential reversal signals. Risk management remains crucial during heightened uncertainty.
AVC Holding Distribution
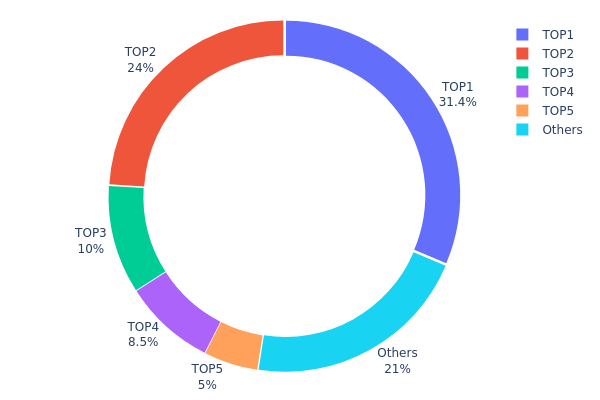
The holding distribution chart reflects the concentration of tokens across different wallet addresses on the blockchain, providing critical insights into the decentralization level and potential market manipulation risks. For AVC, the current distribution reveals a notably concentrated structure that warrants careful examination from both institutional and retail investor perspectives.
Based on the latest on-chain data, the top five addresses collectively control 78.94% of the total AVC supply, with the largest single address holding 31.40% (3,140,920.79K tokens) and the second-largest controlling 24.04% (2,404,674.42K tokens). This bimodal concentration pattern, where two addresses alone account for over 55% of circulating supply, presents significant centralization concerns. The remaining addresses in the top five hold between 5% and 10% each, while all other addresses combined represent only 21.06% of the total supply. Such asymmetric distribution indicates that market liquidity and price discovery mechanisms may be heavily influenced by a limited number of major holders, potentially exposing the token to elevated volatility risks during large-scale transfers or liquidation events.
From a market structure perspective, this concentration level substantially increases the vulnerability to coordinated selling pressure or artificial price manipulation. The dominance of the top two addresses creates potential single points of failure for market stability, as significant movements from either holder could trigger cascading effects across secondary markets. While institutional accumulation can signal confidence in a project's fundamentals, the current distribution suggests insufficient token dispersion among retail participants and smaller institutional players, which typically serve as stabilizing forces during market turbulence. The relatively modest 21.06% held by all other addresses indicates limited grassroots adoption and raises questions about the token's true decentralization credentials and long-term community resilience.
Click to view current AVC Holding Distribution
| Top | Address | Holding Qty | Holding (%) |
|---|---|---|---|
| 1 | 0x7da0...af7e94 | 3140920.79K | 31.40% |
| 2 | 0xa728...ef43f9 | 2404674.42K | 24.04% |
| 3 | 0x0aa5...65b668 | 1000000.00K | 10.00% |
| 4 | 0xa373...ee3b99 | 850000.00K | 8.50% |
| 5 | 0xc0d6...add38d | 500000.00K | 5.00% |
| - | Others | 2104404.79K | 21.06% |
II. Core Factors Influencing AVC's Future Price
Supply Mechanism
-
Market Demand Dynamics: AVC's pricing trajectory is primarily shaped by evolving consumer preferences and market competition intensity. The appliance industry's transformation from traditional hardware sales toward smart ecosystem integration represents a fundamental shift in value creation.
-
Historical Patterns: From 2020 to 2023, market segmentation patterns emerged as consumer purchasing behavior shifted between premium and budget segments, creating price volatility across different product categories. The pandemic period demonstrated how external shocks can compress mid-tier pricing while simultaneously expanding both high-end and entry-level segments.
-
Current Impact: The 2024-2025 policy support period has accelerated demand concentration, with trade-in subsidies lowering consumption barriers and driving faster market penetration. Data indicates that premium product categories experienced year-over-year growth ranging from 16% to 32%, suggesting sustained upward momentum in value-added segments.
Institutional and Market Participant Dynamics
-
Channel Consolidation: The retail landscape is experiencing re-centralization after years of fragmentation. Omnichannel retail models are gaining dominance as single-channel approaches face declining effectiveness. Online platforms achieved over 50% penetration in appliance retail by 2018, fundamentally altering distribution power structures.
-
Industry Partnerships: Leading e-commerce platforms and traditional retailers are developing integrated online-offline experiences, with experiential stores combining digital efficiency and physical product interaction. This hybrid model targets precise consumer segmentation while optimizing inventory management across regional markets.
-
Regulatory Environment: Government trade-in programs covering major appliance categories have materially impacted demand patterns, with policy extensions through 2025 expected to sustain elevated replacement cycles. These initiatives particularly benefit mid-to-high efficiency products meeting energy standards.
Macroeconomic Environment
-
Consumer Spending Patterns: Economic stabilization has returned consumption to segmented patterns, with mature consumers prioritizing value optimization over aspirational purchases. This rationalization phase follows the high-growth stimulus period, creating differentiated demand across price tiers.
-
Raw Material Price Fluctuations: Input cost volatility directly impacts manufacturer margins and retail pricing strategies. Price competition has intensified in segments below 200-500 yuan, compressing profitability for mid-range offerings while premium products maintain stronger pricing power.
-
Market Saturation Dynamics: The shift from ownership expansion to replacement-driven growth has altered fundamental demand characteristics. Markets are transitioning from volume-based competition toward value-based differentiation, emphasizing product innovation and user experience enhancement.
Technology Development and Ecosystem Building
-
AI Integration Advancement: Artificial intelligence adoption is reshaping product functionality and user interaction models. Smart connectivity features, voice control systems, and predictive maintenance capabilities are becoming standard differentiators rather than premium add-ons, driving incremental value perception.
-
Energy Efficiency Standards: Regulatory emphasis on environmental performance is accelerating product upgrade cycles. Zero-emission cooking solutions, advanced filtration systems, and optimized power management technologies are capturing increasing consumer attention as sustainability awareness rises.
-
Ecosystem Application Expansion: Cross-category device integration and platform-based service models are creating network effects beyond individual product sales. Smart home systems enabling interconnected appliance management represent emerging value propositions that extend beyond traditional hardware transactions, supporting premium pricing strategies and customer retention.
III. 2026-2031 AVC Price Forecast
2026 Outlook
- Conservative Forecast: $0.00019 - $0.00021
- Neutral Forecast: $0.00021
- Optimistic Forecast: $0.00024 (requires sustained market interest and improved trading volumes)
2027-2029 Medium-Term Outlook
- Market Phase Expectation: Gradual growth phase with potential volatility as the token establishes market positioning
- Price Range Forecast:
- 2027: $0.00012 - $0.00029
- 2028: $0.00019 - $0.00037
- 2029: $0.00021 - $0.00042
- Key Catalysts: Progressive price appreciation driven by potential ecosystem developments, with projected changes of 8%, 23%, and 51% respectively over these periods
2030-2031 Long-Term Outlook
- Baseline Scenario: $0.00023 - $0.00042 (assuming steady market conditions and maintained project momentum)
- Optimistic Scenario: $0.00033 - $0.0005 (with enhanced adoption and favorable market dynamics)
- Transformative Scenario: Up to $0.0005 (contingent upon significant breakthrough developments and widespread adoption)
- 2026-02-08: AVC trading within initial forecast range of $0.00019 - $0.00024 (establishing baseline valuation)
| Year | Predicted High Price | Predicted Average Price | Predicted Low Price | Price Change |
|---|---|---|---|---|
| 2026 | 0.00024 | 0.00021 | 0.00019 | 0 |
| 2027 | 0.00029 | 0.00023 | 0.00012 | 8 |
| 2028 | 0.00037 | 0.00026 | 0.00019 | 23 |
| 2029 | 0.00042 | 0.00032 | 0.00021 | 51 |
| 2030 | 0.00042 | 0.00037 | 0.00023 | 75 |
| 2031 | 0.0005 | 0.00039 | 0.00033 | 87 |
IV. AVC Professional Investment Strategies and Risk Management
AVC Investment Methodology
(1) Long-term Holding Strategy
- Suitable for: Investors who believe in the long-term potential of metaverse and blockchain gaming integration, with a horizon of 1-3 years
- Operational Recommendations:
- Consider accumulating positions during periods of lower volatility, given the token's historical price range between $0.0001234 and $0.019
- Monitor project development milestones and ecosystem expansion announcements that may impact long-term value
- Implement a dollar-cost averaging approach to mitigate entry timing risk in this volatile asset
- Storage Solution: Utilize Gate Web3 Wallet for secure custody of AVC tokens on the BSC network, ensuring private key control and multi-signature options for larger holdings
(2) Active Trading Strategy
- Technical Analysis Tools:
- Moving Averages: Track 7-day and 30-day price movements to identify potential trend reversals, noting the recent 2.86% weekly gain against a 4.74% monthly decline
- Volume Analysis: Monitor the current 24-hour trading volume of approximately $55,471 to gauge market participation and liquidity conditions
- Swing Trading Key Points:
- Set strategic entry points near recent support levels, considering the 24-hour range of $0.0002083 to $0.0002099
- Establish clear exit targets based on resistance levels and risk-reward ratios of at least 1:2
- Utilize stop-loss orders to protect capital, particularly given the token's 93.15% decline over the past year
AVC Risk Management Framework
(1) Asset Allocation Principles
- Conservative Investors: 0.5-1% of crypto portfolio allocation
- Aggressive Investors: 2-3% of crypto portfolio allocation
- Professional Investors: 3-5% of crypto portfolio allocation, with active monitoring and rebalancing strategies
(2) Risk Hedging Solutions
- Position Sizing: Limit individual position size to account for the low market capitalization of approximately $200,911 and limited exchange availability (2 exchanges)
- Diversification Strategy: Balance AVC holdings with established metaverse and gaming tokens to reduce concentration risk
- Gradual Exit Planning: Establish predetermined price targets for partial profit-taking to manage downside exposure
(3) Secure Storage Solutions
- Hot Wallet Recommendation: Gate Web3 Wallet for active trading positions, providing convenient access while maintaining security through encrypted private key storage
- Cold Storage Approach: For long-term holdings exceeding $1,000 in value, consider hardware wallet solutions with proper backup procedures
- Security Precautions: Never share private keys or seed phrases; enable two-factor authentication on all exchange accounts; verify contract address (0xd34984d7bff492dc3b2336eabd1758ce16ddfc2d) before any transactions; be cautious of phishing attempts targeting metaverse project investors
V. AVC Potential Risks and Challenges
AVC Market Risks
- Liquidity Risk: With a daily trading volume of approximately $55,471 and availability on only 2 exchanges, AVC faces significant liquidity constraints that may result in wider bid-ask spreads and potential difficulty executing larger orders
- Volatility Risk: The token has experienced substantial price fluctuations, declining 93.15% from its all-time high of $0.019 to current levels around $0.0002095, indicating high volatility that may continue
- Market Cap Concentration: With a circulating market cap of approximately $200,911 and only 9.59% of total supply in circulation, the token ranks #3945 by market capitalization, suggesting limited institutional participation and heightened susceptibility to market manipulation
- Competition Risk: The metaverse and blockchain gaming sector faces intense competition from established projects, potentially impacting AlterVerse's market share and adoption rates
AVC Regulatory Risks
- Securities Classification Uncertainty: Gaming tokens and metaverse projects continue to face evolving regulatory scrutiny regarding potential securities classification in various jurisdictions
- Gaming and NFT Regulation: Increasing regulatory attention on NFT platforms and play-to-earn mechanics may impact AlterVerse's business model and token utility
- Geographic Restrictions: Regulatory developments in key markets may limit user participation and reduce the addressable market for the platform
AVC Technical Risks
- Smart Contract Risk: As a BEP-20 token on the Binance Smart Chain, AVC is subject to potential smart contract vulnerabilities that could affect token security and functionality
- Platform Dependency: The token's value is closely tied to the successful development and adoption of the AlterVerse metaverse platform, creating concentration risk
- Scalability Challenges: As a metaverse project combining gaming, NFTs, and DeFi elements, technical scalability and user experience optimization remain critical challenges
- Network Risk: Reliance on the BSC network exposes AVC to potential network congestion, security issues, or changes in the underlying blockchain infrastructure
VI. Conclusion and Action Recommendations
AVC Investment Value Assessment
AlterVerse (AVC) represents a high-risk, speculative investment opportunity within the metaverse and blockchain gaming sector. The project combines gaming, NFT, and DeFi elements to create an immersive digital world experience, positioning itself within a rapidly evolving market segment. However, several factors warrant caution: the token has declined 93.15% from its all-time high, maintains limited liquidity with only 2 exchange listings, and holds a relatively low market capitalization ranking of #3945. The circulating supply represents just 9.59% of the total supply, suggesting potential future dilution concerns. While the project's integration of multiple blockchain gaming elements demonstrates ambition, the token's current metrics and market performance indicate substantial risk. Long-term value proposition depends heavily on successful platform development, user adoption, and sustained ecosystem growth within a competitive landscape. Short-term risks include continued price volatility, liquidity constraints, and broader market sentiment affecting metaverse tokens.
AVC Investment Recommendations
✅ Beginners: Exercise extreme caution. If considering participation, limit exposure to less than 0.5% of total crypto portfolio. Focus on education about metaverse projects and blockchain gaming before investing. Utilize Gate.com's educational resources to understand the risks and mechanics of gaming tokens. Consider paper trading or minimal position sizes initially.
✅ Experienced Investors: Approach as a high-risk, speculative allocation not exceeding 2-3% of crypto portfolio. Conduct thorough due diligence on platform development progress and user metrics. Implement strict risk management with predetermined stop-losses and profit-taking levels. Monitor project milestones, partnership announcements, and community growth indicators. Consider this position only as part of a diversified crypto portfolio.
✅ Institutional Investors: Given the limited liquidity, low market capitalization, and restricted exchange availability, AVC may not meet institutional investment criteria for minimum liquidity thresholds and market depth. If considering exposure to the metaverse gaming sector, evaluate AVC alongside more established projects with greater liquidity and institutional participation. Any allocation should be minimal and accompanied by comprehensive risk disclosure.
AVC Trading Participation Methods
-
Spot Trading on Gate.com: Direct purchase and sale of AVC tokens through Gate.com's spot trading platform, providing access to real-time market prices and order book liquidity. Suitable for investors seeking straightforward exposure without leverage.
-
Gate Web3 Wallet Integration: Utilize Gate Web3 Wallet for decentralized storage and management of AVC tokens while maintaining self-custody. This approach enables participation in potential future DeFi activities while ensuring security through private key control.
-
Dollar-Cost Averaging Strategy: Implement systematic periodic purchases to mitigate timing risk and reduce the impact of price volatility. This method is particularly relevant given AVC's substantial historical price fluctuations and current market positioning.
Cryptocurrency investment carries extremely high risk, and this article does not constitute investment advice. Investors should make cautious decisions based on their own risk tolerance and are advised to consult professional financial advisors. Never invest more than you can afford to lose.
FAQ
What is AVC? What are its basic uses and characteristics?
AVC (Advanced Video Coding), also known as H.264, is a video compression standard widely used for video recording and distribution. It offers superior compression efficiency compared to previous standards, supporting multiple profiles and levels. AVC features advanced prediction techniques, flexible block sizes, quarter-pixel motion precision, and improved entropy encoding for optimal video quality at lower bitrates.
What is AVC's historical price trend? What was the past price volatility range?
AVC has experienced dynamic price movements since its inception. Historical data shows the token fluctuated significantly, with volatility ranging across multiple cycles. Past price ranges reflected market sentiment shifts and adoption phases. Detailed price history displays uptrend and downtrend patterns, with notable peaks and valleys during different market conditions and project developments.
What is the 2024 AVC price prediction? What are professional analysts' expectations?
Professional analysts project 2024 AVC prices between $10-15, though estimates vary. Recent data indicates production expansion plans to meet demand. Predictions do not account for future market volatility.
What are the main factors affecting AVC price?
AVC price is primarily influenced by market demand, token supply, network adoption rates, macroeconomic conditions, and regulatory developments. Strong adoption and positive sentiment typically drive price increases, while market corrections and regulatory uncertainty may pressure prices downward.
What are the risks of AVC price prediction? How should I evaluate the reliability of predictions?
AVC price prediction risks include market volatility and data inaccuracy. Evaluate reliability by monitoring MAPE error metrics, ensuring data currency and accuracy, and analyzing historical prediction performance against actual price movements.
Compared with other similar assets, what are the investment value and risks of AVC?
AVC offers superior investment value with relatively lower risks than comparable assets. Its lower capital requirements and high liquidity make it an effective hedging tool, providing better capital efficiency for investors seeking exposure to similar market segments.
Share
Content
Introduction: AVC's Market Position and Investment Value
I. AVC Price History Review and Market Status
II. Core Factors Influencing AVC's Future Price
III. 2026-2031 AVC Price Forecast
IV. AVC Professional Investment Strategies and Risk Management
V. AVC Potential Risks and Challenges
VI. Conclusion and Action Recommendations
FAQ
How to Buy Cryptocurrency


Trending Cryptocurrencies


Detailed Analysis of the Best 10 GameFi Projects to Play and Earn in 2025
Popular GameFi Games in 2025

What Are the Key On-Chain Metrics Revealing About Litecoin's Whale Activity in 2025?

What is GameFi and How Does It Work?

What is DeFi: Understanding Decentralized Finance in 2025
How Will Virtuals Protocol's AI Agent Economy Evolve by 2030?

A concise guide to identifying promising NFT projects

Trading Patterns — Beginner’s Guide
Top 6 Low-Fee Bitcoin ATMs for Budget-Conscious Cryptocurrency Access

Unstoppable Domains: Your Gateway to Owning a Blockchain Domain

Trading Patterns: A Beginner's Guide