2026 BOND Price Prediction: Expert Analysis and Market Forecast for the Coming Year
Introduction: BOND's Market Position and Investment Value
BarnBridge (BOND), as a volatility derivatives protocol in the DeFi ecosystem, has been innovating in risk management solutions since its launch in 2020. As of 2026, BOND maintains a market capitalization of approximately $706,921, with a circulating supply of about 9.78 million tokens, and the price hovering around $0.07227. This asset, recognized as a governance token powering decentralized risk tranching, is playing an increasingly important role in DeFi risk optimization and yield structuring.
This article will comprehensively analyze BOND's price trajectory from 2026 to 2031, combining historical patterns, market supply-demand dynamics, ecosystem development, and macroeconomic conditions to provide investors with professional price forecasts and practical investment strategies.
I. BOND Price History Review and Current Market Status
BOND Historical Price Evolution Trajectory
- 2020: Initial launch in October with an opening price of $85, experiencing significant volatility in early trading phases
- 2020: All-time high of $185.69 reached on October 27, 2020, representing substantial early market enthusiasm
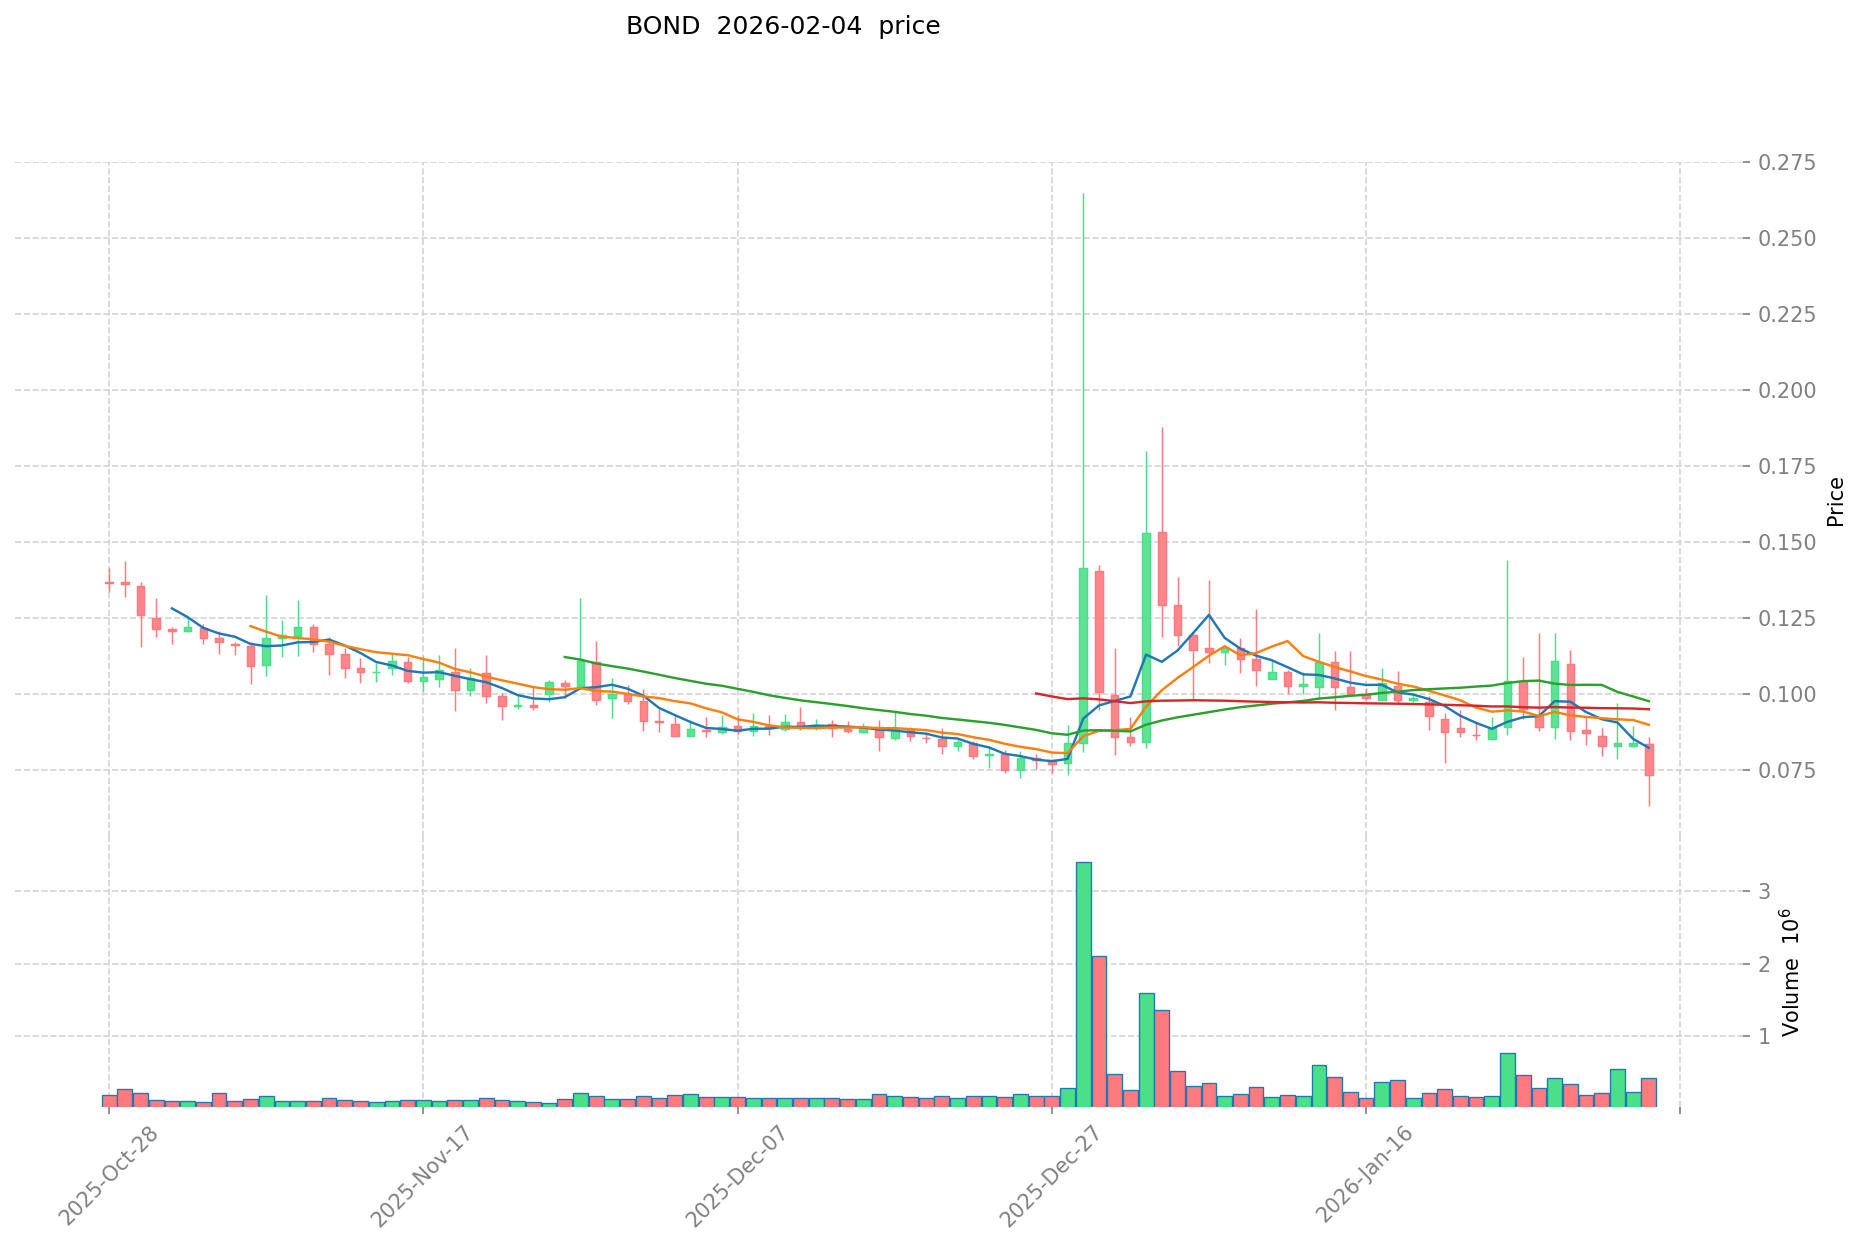
- 2026: Price declined to all-time low of $0.071852 recorded on February 4, 2026, reflecting extended bearish market conditions
BOND Current Market Status
As of February 4, 2026, BOND is trading at $0.07227, positioned near its historical low point. The token has experienced notable short-term volatility, with a 24-hour price decline of 6.33% and a weekly decrease of 18.44%. Over the past 30 days, the asset has dropped 35.04%, while the one-year performance shows a decline of 80.60%.
The 24-hour trading volume stands at $16,362.94, indicating relatively modest market activity. The current market capitalization is approximately $706,921, with BOND ranking 2,761 among cryptocurrencies. With a circulating supply of 9,781,670.51 BOND tokens out of a maximum supply of 10,000,000, the circulation ratio reaches 97.82%.
BOND's intraday trading range fluctuated between $0.07153 and $0.08599. The fully diluted market cap is $722,700, closely aligned with the current market capitalization at 97.82% of FDV. Market dominance remains minimal at 0.000026%.
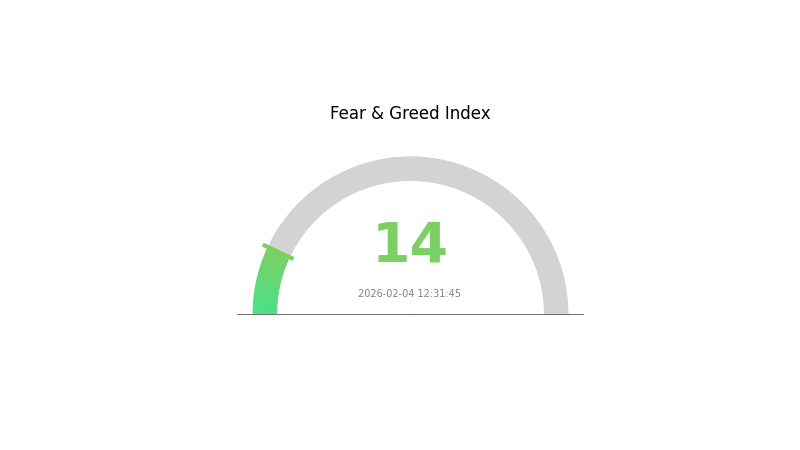
The cryptocurrency fear and greed index registers at 14, indicating "Extreme Fear" sentiment in the broader market, which may be contributing to ongoing downward price pressure. The token maintains listings on 3 exchanges and has a holder base of 16,684 addresses.
Click to view current BOND market price
BOND Market Sentiment Indicator
2026-02-04 Fear & Greed Index: 14 (Extreme Fear)
Click to view current Fear & Greed Index
The BOND market is currently experiencing extreme fear, with the Fear & Greed Index hitting 14. This exceptionally low reading indicates widespread panic and negative sentiment among investors. Market participants are showing significant risk aversion, creating potential buying opportunities for contrarian investors. However, such extreme conditions warrant caution, as further volatility may persist. Traders should monitor key support levels closely and consider their risk tolerance before making investment decisions during this period of heightened market uncertainty.
BOND Holding Distribution
Address holding distribution represents the allocation of token holdings across different wallet addresses, reflecting the degree of decentralization and concentration risk within the project's ecosystem. By analyzing the distribution pattern of large holders (whales) versus smaller participants, investors can assess potential market manipulation risks and the overall health of token circulation.
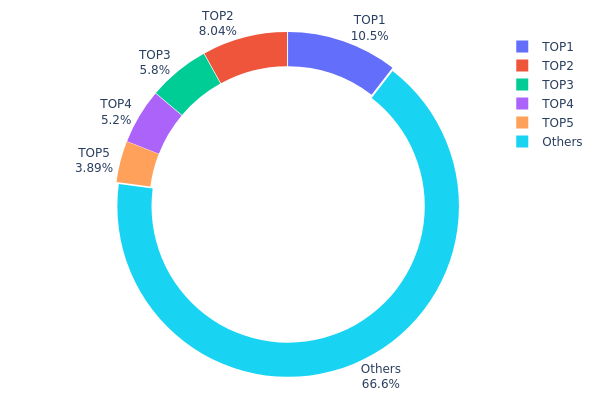
Based on the current data, BOND demonstrates a moderately concentrated holding structure. The top holder controls 10.47% of the total supply (1,047.17K tokens), while the top 5 addresses collectively hold 33.39% of the circulating supply. This concentration level falls within a reasonable range for DeFi governance tokens, as major stakeholders often include team members, institutional investors, and liquidity providers who maintain long-term positions to support protocol stability.
The relatively balanced distribution outside the top holders—with 66.61% held by other addresses—suggests adequate market liquidity and broader community participation. This structure reduces single-point vulnerability while maintaining sufficient large-holder presence for governance effectiveness. However, investors should monitor potential coordinated selling pressure from top addresses, which could trigger significant price volatility. The current holding pattern reflects a maturing project with established institutional backing, indicating moderate decentralization with manageable concentration risk for the ecosystem's long-term development.
Click to view current BOND holding distribution
| Top | Address | Holding Qty | Holding (%) |
|---|---|---|---|
| 1 | 0xd2dd...e6869f | 1047.17K | 10.47% |
| 2 | 0x7daf...706f83 | 803.90K | 8.03% |
| 3 | 0x0529...c553b7 | 580.02K | 5.80% |
| 4 | 0x40a2...047bde | 520.23K | 5.20% |
| 5 | 0x9642...2f5d4e | 389.19K | 3.89% |
| - | Others | 6659.49K | 66.61% |
II. Core Factors Influencing Future Bond Prices
Supply Mechanisms
-
Central Bank Policy Rates: Central bank policy rates, such as the Federal Reserve's federal funds rate, serve as a core driver for the bond market. When interest rates rise, bond prices typically decline, as newly issued bonds offer higher yields that make existing bonds less attractive. Conversely, when rates fall, bond prices tend to increase because older bonds with higher coupon rates become more valuable.
-
Historical Patterns: Throughout the 1980s and 1990s, central banks in developed markets gradually lowered policy rates, contributing to a prolonged bull market in bonds. More recently, the aggressive rate hikes initiated by the Federal Reserve since 2022 have exerted downward pressure on bond prices, particularly for longer-duration securities.
-
Current Impact: As of early 2026, market expectations suggest that inflation may remain above target levels for an extended period. If central banks choose to maintain higher rates longer, bond prices could remain under pressure. However, should economic growth slow or inflation expectations moderate, rate cuts could support a recovery in bond valuations.
Institutional and Major Holder Dynamics
-
Institutional Holdings: Large institutional investors—including pension funds, insurance companies, and sovereign wealth funds—hold substantial positions in government and corporate bonds. These institutions often adjust their portfolios based on interest rate forecasts and credit risk assessments. In recent periods, some have reduced exposure to long-duration bonds in anticipation of higher rates, while others have rotated into shorter-maturity or floating-rate securities to manage interest rate risk.
-
Corporate Adoption: While corporate treasuries traditionally hold bonds as part of their liquidity management strategies, the specific dynamics of bond adoption by corporations depend on financing needs and prevailing market conditions. In times of low rates, corporations may issue more debt to finance expansion or refinance existing obligations, increasing bond supply and potentially affecting prices.
-
Government Policies: Fiscal policy also plays a crucial role. For example, increased government borrowing—driven by budget deficits—can lead to higher bond issuance. If the Federal Reserve does not engage in quantitative easing to absorb this supply, upward pressure on yields (and downward pressure on prices) may result. Some governments have also issued inflation-linked bonds to meet investor demand for real return protection.
Macroeconomic Environment
-
Monetary Policy Influence: Major central banks' policy stances remain a pivotal factor. If central banks signal prolonged restrictive policies to combat persistent inflation, bond yields may stay elevated, constraining price appreciation. Conversely, any pivot toward monetary easing could support bond prices, particularly for longer maturities.
-
Inflation Hedge Attributes: Bonds are generally sensitive to inflation expectations. When inflation rises faster than anticipated, the real purchasing power of fixed coupon payments erodes, reducing bond attractiveness and pushing prices lower. Inflation-linked securities, such as Treasury Inflation-Protected Securities, may outperform nominal bonds during such periods. However, if inflation expectations moderate or deflation risks emerge, traditional fixed-income instruments could regain appeal.
-
Geopolitical Factors: International tensions, trade disputes, and regional conflicts can drive investors toward safe-haven assets, including high-quality government bonds. During periods of heightened geopolitical uncertainty, demand for these securities may increase, supporting prices. Conversely, improved global stability might reduce safe-haven flows, potentially weighing on bond valuations.
Technical Development and Ecosystem Building
-
Evolution of Bond Market Infrastructure: Advances in trading platforms and electronic execution have enhanced liquidity and price discovery in bond markets. Innovations such as real-time settlement systems and distributed ledger technology are being explored to improve efficiency and reduce transaction costs. These developments could broaden market access and attract a wider range of investors, potentially influencing supply and demand dynamics.
-
Credit Risk Assessment Tools: Improvements in credit rating methodologies and the use of big data analytics enable investors to better evaluate issuer default risk. Enhanced transparency and more sophisticated risk management tools may lead to more differentiated pricing across bond sectors, with higher-quality issuers potentially seeing stronger demand and more stable pricing.
-
Ecosystem Applications: Beyond traditional fixed-income investing, bonds are increasingly integrated into broader financial ecosystems. For instance, collateralized bond structures and securitization products allow for greater diversification and tailored risk-return profiles. Additionally, the growing market for green bonds and sustainable debt instruments reflects investor appetite for environmentally and socially responsible investment opportunities, adding new dimensions to bond market dynamics.
III. 2026-2031 BOND Price Forecast
2026 Outlook
- Conservative Forecast: $0.05854 - $0.07227
- Neutral Forecast: $0.07227
- Optimistic Forecast: $0.08456 (requires sustained market momentum and positive sentiment)
2027-2029 Medium-Term Outlook
- Market Phase Expectation: BOND may enter a gradual growth phase with moderate volatility, potentially benefiting from broader market recovery cycles and increased adoption
- Price Range Forecast:
- 2027: $0.05803 - $0.09253 (approximately 8% year-over-year change)
- 2028: $0.07009 - $0.08803 (approximately 18% cumulative change)
- 2029: $0.04598 - $0.10584 (approximately 20% cumulative change)
- Key Catalysts: Market sentiment shifts, potential protocol developments, and macroeconomic factors influencing crypto adoption
2030-2031 Long-Term Outlook
- Baseline Scenario: $0.05393 - $0.09629 (assuming steady ecosystem development and moderate market conditions)
- Optimistic Scenario: $0.09629 - $0.10592 (assuming favorable regulatory environment and strong user adoption)
- Transformative Scenario: $0.10111 - $0.11931 (requires breakthrough partnerships, significant protocol upgrades, and bullish market conditions)
- 2031: BOND could potentially reach $0.11931 (representing approximately 40% cumulative change from 2026 baseline, contingent on sustained growth trajectory)
| Year | Predicted High Price | Predicted Average Price | Predicted Low Price | Price Change |
|---|---|---|---|---|
| 2026 | 0.08456 | 0.07227 | 0.05854 | 0 |
| 2027 | 0.09253 | 0.07841 | 0.05803 | 8 |
| 2028 | 0.08803 | 0.08547 | 0.07009 | 18 |
| 2029 | 0.10584 | 0.08675 | 0.04598 | 20 |
| 2030 | 0.10592 | 0.09629 | 0.05393 | 33 |
| 2031 | 0.11931 | 0.10111 | 0.0546 | 40 |
IV. BOND Professional Investment Strategies and Risk Management
BOND Investment Methodology
(1) Long-term Holding Strategy
- Target Investors: Investors with moderate to high risk tolerance seeking exposure to DeFi governance tokens and volatility derivative protocols
- Operational Recommendations:
- Consider accumulating BOND during periods of market correction, given the token's significant decline from its all-time high
- Monitor BarnBridge DAO governance proposals and protocol development updates to assess long-term value proposition
- Implement Gate Web3 Wallet for secure storage, ensuring proper backup of private keys and recovery phrases
(2) Active Trading Strategy
- Technical Analysis Tools:
- Moving Averages: Use 50-day and 200-day moving averages to identify potential trend reversals, particularly given BOND's recent 18.44% decline over 7 days
- Volume Analysis: Monitor 24-hour trading volume ($16,362.94) relative to market cap to assess liquidity conditions before entering positions
- Swing Trading Considerations:
- Track the 24-hour price range ($0.07153-$0.08599) to identify support and resistance levels
- Consider setting stop-loss orders below recent lows to manage downside risk in volatile conditions
BOND Risk Management Framework
(1) Asset Allocation Principles
- Conservative Investors: 1-2% of crypto portfolio allocation
- Aggressive Investors: 3-5% of crypto portfolio allocation
- Professional Investors: Up to 7% with active hedging strategies
(2) Risk Hedging Approaches
- Portfolio Diversification: Balance BOND exposure with established cryptocurrencies and stablecoins to mitigate protocol-specific risks
- Position Sizing: Limit individual trade size to account for BOND's low market dominance (0.000026%) and limited exchange availability (3 exchanges)
(3) Secure Storage Solutions
- Hot Wallet Recommendation: Gate Web3 Wallet for active trading and governance participation
- Cold Storage Approach: Hardware wallet solutions for long-term holdings exceeding $1,000 in value
- Security Precautions: Never share private keys, enable two-factor authentication, and verify contract addresses (0x0391D2021f89DC339F60Fff84546EA23E337750f on Ethereum) before transactions
V. BOND Potential Risks and Challenges
BOND Market Risks
- Extreme Volatility: BOND has declined 80.60% over the past year, with the current price ($0.07227) near its all-time low ($0.071852)
- Limited Liquidity: With only 3 exchanges listing BOND and relatively low 24-hour trading volume, large orders may experience significant slippage
- Market Cap Concentration: The fully diluted market cap represents 97.82% of current market cap, suggesting minimal additional sell pressure from locked tokens but limited upside catalysts
BOND Regulatory Risks
- DeFi Protocol Scrutiny: Volatility derivative protocols may face increased regulatory examination as authorities develop frameworks for decentralized finance
- Governance Token Classification: Regulatory clarity regarding $BOND's status as a governance token remains uncertain across different jurisdictions
- Cross-border Compliance: BarnBridge's decentralized structure may complicate compliance with evolving international cryptocurrency regulations
BOND Technical Risks
- Smart Contract Vulnerabilities: Despite utilizing the Diamond Standard (EIP-2535) for upgradeability, smart contract risks remain inherent in DeFi protocols
- Protocol Adoption: Limited network effect with only 16,684 holders may constrain growth and liquidity development
- Ethereum Network Dependency: As an ERC-20 token, BOND inherits risks associated with the Ethereum network, including congestion and high gas fees during peak periods
VI. Conclusion and Action Recommendations
BOND Investment Value Assessment
BarnBridge presents a high-risk, specialized opportunity within the DeFi volatility derivatives sector. While the protocol's innovative approach to risk tokenization and the flexibility offered by the Diamond Standard architecture demonstrate technical merit, the token faces significant headwinds. The substantial 80.60% decline over the past year, combined with limited exchange availability and low market dominance, suggests considerable risk. Long-term value depends on the protocol's ability to attract meaningful adoption and demonstrate sustainable utility for $BOND beyond governance functions. Short-term risks include continued price pressure, limited liquidity, and broader market volatility.
BOND Investment Recommendations
✅ Beginners: Avoid or limit exposure to less than 1% of total crypto portfolio until gaining experience with more established assets and understanding DeFi governance mechanisms
✅ Experienced Investors: Consider small speculative positions (2-3% of crypto portfolio) with strict risk management, focusing on accumulation during periods of maximum pessimism while monitoring protocol development
✅ Institutional Investors: Evaluate BOND as a tactical allocation within a diversified DeFi governance token basket, with emphasis on liquidity planning and governance participation strategies
BOND Trading Participation Methods
- Spot Trading: Access BOND trading pairs on Gate.com with proper risk controls and position sizing
- Governance Participation: Stake $BOND tokens to participate in BarnBridge DAO governance decisions and protocol upgrades
- Secure Storage: Utilize Gate Web3 Wallet for convenient access while maintaining cold storage solutions for long-term holdings
Cryptocurrency investment carries extremely high risk, and this article does not constitute investment advice. Investors should make prudent decisions based on their own risk tolerance and are advised to consult professional financial advisors. Never invest more than you can afford to lose.
FAQ
What is a bond (BOND)? What is the relationship between bond price and yield?
BOND is a debt instrument representing borrowed capital. Bond price and yield move inversely: when price falls, yield rises, and vice versa. This inverse relationship reflects market dynamics and investor returns.
Which factors affect BOND price fluctuations?
BOND price is influenced by market sentiment, trading volume, macroeconomic conditions, interest rates, and crypto market trends. Economic expansion typically increases prices, while market downturns and rising rates decrease them. Supply-demand dynamics and regulatory developments also play key roles.
How to predict future bond price trends? What are the analysis methods and tools?
Predict BOND price trends using time series models, regression analysis, and credit risk assessment. Analyze price movements, yield curves, and issuer fundamentals. Utilize data visualization tools and quantitative software for technical and fundamental analysis to forecast price directions.
What are the differences in bond price prediction methods for different types of bonds (government bonds, corporate bonds, high-yield bonds, etc.)?
Government bond predictions focus on interest rate trends and macroeconomic factors; corporate bonds require analysis of company creditworthiness and industry fundamentals; high-yield bonds emphasize credit risk assessment and market volatility dynamics.
How do interest rate changes affect bond price predictions?
Rising interest rates decrease bond prices as new bonds offer higher yields, making existing bonds less attractive. Falling rates increase bond prices. This inverse relationship is fundamental to predicting BOND price movements in the crypto market.
What are the risks and limitations in bond price prediction?
Bond price predictions face market volatility, interest rate fluctuations, and external economic factors. Predictions may struggle with short-term sentiment shifts and policy uncertainties, limiting accuracy in capturing both immediate and long-term market movements.
Share
Content
Introduction: BOND's Market Position and Investment Value
I. BOND Price History Review and Current Market Status
II. Core Factors Influencing Future Bond Prices
III. 2026-2031 BOND Price Forecast
IV. BOND Professional Investment Strategies and Risk Management
V. BOND Potential Risks and Challenges
VI. Conclusion and Action Recommendations
FAQ
How to Buy Cryptocurrency


Trending Cryptocurrencies


What will be the market capitalization of USDC in 2025? Analysis of the stablecoin market landscape.

How is DeFi different from Bitcoin?

What is DeFi: Understanding Decentralized Finance in 2025

USDC stablecoin 2025 Latest Analysis: Principles, Advantages, and Web3 Eco-Applications
Development of Decentralized Finance Ecosystem in 2025: Integration of Decentralized Finance Applications with Web3
2025 USDT USD Complete Guide: A Must-Read for Newbie Investors
Ultimate Guide to NFT Minting: Create and Sell NFTs for Free
Free Money for App Registration in 2025

Who Is John J. Ray III, FTX's New CEO?

Best Crypto Exchanges for Beginners: Top 10 Options — Current Recommendations

Are there methods to minimize taxes through offsetting gains and losses from crypto assets (virtual currencies)?