This comprehensive analysis examines Everclear (CLEAR), a pioneering clearing layer infrastructure addressing liquidity fragmentation across Layer 2 networks. Currently trading at $0.001905 as of February 2026, the article provides professional price forecasts, market sentiment analysis, and practical investment strategies for the 2026-2031 period. Expert predictions range from conservative scenarios of $0.00145-$0.00191 to optimistic outlooks reaching $0.00472 by 2031, driven by ecosystem development and market recovery. The guide covers CLEAR's token holder distribution, macroeconomic factors, and risk management frameworks suitable for beginners through institutional investors trading on Gate exchange. Detailed investment methodologies, hedging solutions, and comprehensive risk assessments equip traders with actionable insights for navigating this high-volatility, early-stage cross-chain infrastructure opportunity in the evolving cryptocurrency market.
Introduction: CLEAR's Market Position and Investment Value
Everclear (CLEAR), positioned as the First Clearing Layer addressing liquidity fragmentation across Layer 2 networks, has emerged as an innovative solution for intent solvers, market makers, and institutional participants since its launch in 2025. As of February 6, 2026, CLEAR maintains a market capitalization of approximately $394,335 with a circulating supply of 207 million tokens, trading at around $0.001905. This asset, recognized as a "Chain Abstraction Pioneer," is playing an increasingly important role in cross-chain liquidity optimization and decentralized finance infrastructure.
This article will comprehensively analyze CLEAR's price trajectory from 2026 to 2031, combining historical patterns, market supply-demand dynamics, ecosystem development, and macroeconomic conditions to provide investors with professional price forecasts and practical investment strategies.
I. CLEAR Price History Review and Market Status
CLEAR Historical Price Evolution Trajectory
- 2025: Project launched with initial token offering at $0.05, reaching an all-time high of $0.0768 on January 16, 2025, representing a 53.6% increase from launch price
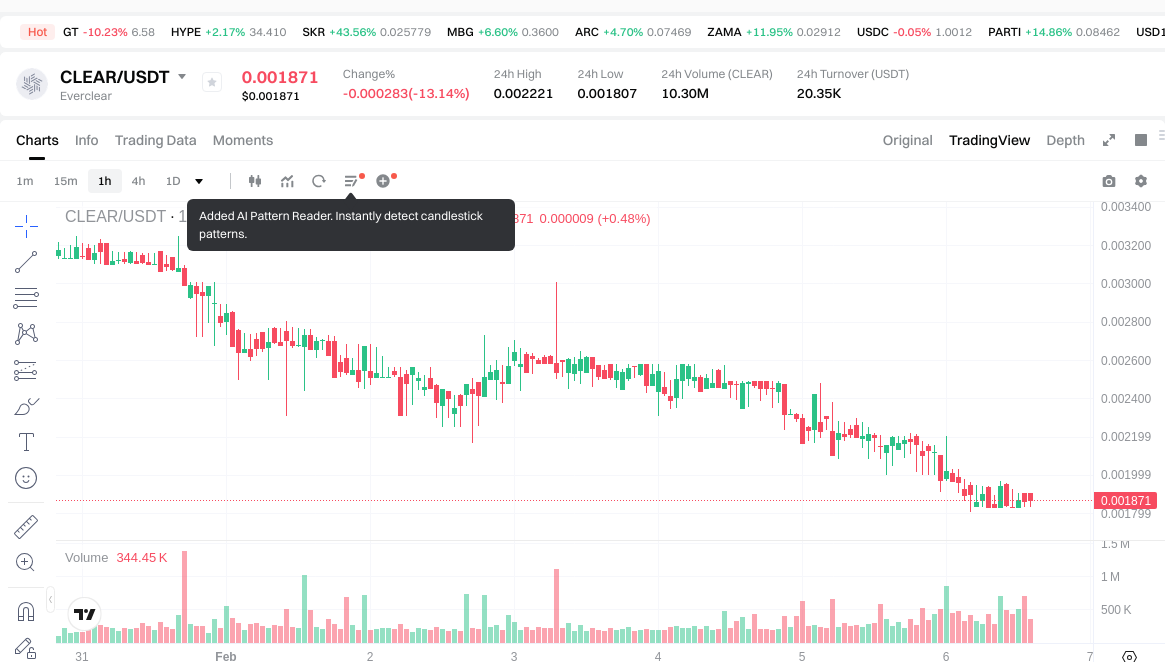
- 2026: Market experienced significant correction, with price declining to an all-time low of $0.001817 on February 6, 2026
CLEAR Current Market Situation
As of February 6, 2026, CLEAR is trading at $0.001905, showing recent volatility across different timeframes. Over the past hour, the token has demonstrated a modest recovery with a 1.67% increase. However, broader market trends reveal substantial downward pressure, with a 10.52% decline over 24 hours and a 42.30% decrease over the past week.
The 30-day performance shows a 66.83% decline, while the year-to-date performance indicates a 95.69% drop from previous levels. The 24-hour trading range spans from $0.001807 to $0.002221, with total trading volume reaching $20,171.84.
The current market capitalization stands at $394,335, with 207 million tokens in circulation representing 20.7% of the total supply. The fully diluted market capitalization is valued at $1.905 million, based on the maximum supply of 1 billion tokens. The token holder count currently stands at 1,657 addresses.
Everclear maintains active trading across 4 exchanges, with the project focusing on addressing liquidity fragmentation through its clearing layer infrastructure. The current market sentiment index registers at level 2, indicating an "Extreme Fear" market environment with a VIX reading of 9.
Click to view current CLEAR market price
CLEAR Market Sentiment Index
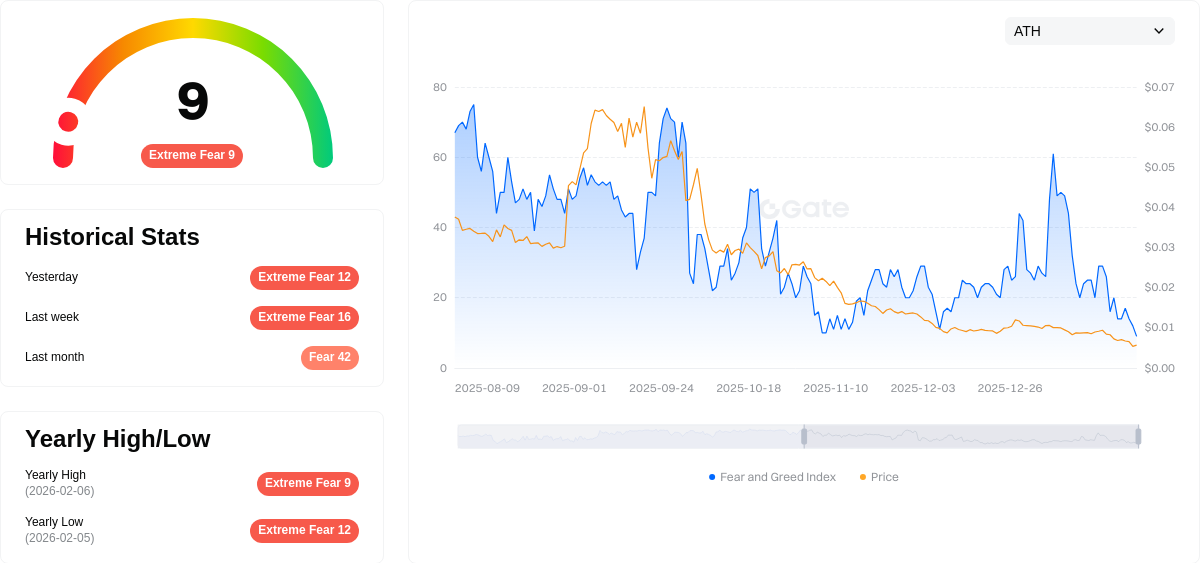
2026-02-06 Fear and Greed Index: 9 (Extreme Fear)
Click to view current Fear & Greed Index
The cryptocurrency market is currently experiencing extreme fear, with the Fear and Greed Index dropping to just 9 points. This indicates severe market pessimism and heightened risk aversion among investors. During such periods, market volatility tends to increase significantly, creating both substantial risks and potential opportunities for strategic investors. Cautious position management and risk control are essential. Long-term believers may view this as an opportunity to accumulate assets at lower valuations, while risk-averse traders should maintain defensive strategies and avoid overexposure.
CLEAR Token Holder Distribution
The holder distribution chart provides a critical perspective on the decentralization level of a cryptocurrency by analyzing how tokens are distributed across different wallet addresses. This metric serves as a fundamental indicator of market structure, revealing whether token ownership is concentrated among a few large holders or distributed more evenly across the community. For CLEAR, understanding this distribution pattern is essential for assessing potential manipulation risks, liquidity concentration, and overall network health.
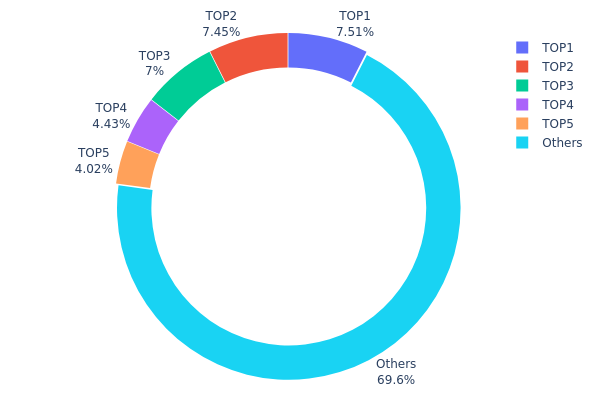
According to the current on-chain data, CLEAR's token distribution exhibits moderate concentration characteristics. The top five addresses collectively control approximately 30.38% of the total supply, with the largest holder possessing 56,045.86K tokens (7.51%), followed closely by the second-largest at 55,536.80K tokens (7.44%). The third-ranked address holds 52,200.63K tokens (6.99%), while the fourth and fifth positions account for 4.42% and 4.02% respectively. The remaining 69.62% of tokens are distributed among other addresses, suggesting a relatively balanced distribution pattern compared to many newly launched projects where top holders often control over 50% of the supply.
This distribution structure presents both opportunities and considerations for market participants. The 30.38% concentration among top five addresses indicates that while major holders exist, they do not possess overwhelming control that could facilitate easy price manipulation. However, the presence of three large holders each controlling approximately 7% of supply means coordinated selling by these entities could trigger significant price volatility. The 69.62% distribution among remaining addresses demonstrates reasonable community participation and suggests a foundation for organic market development, though continuous monitoring of whale wallet movements remains advisable for understanding potential short-term price pressures.
Click to view current CLEAR Holder Distribution
| Top |
Address |
Holding Qty |
Holding (%) |
| 1 |
0x4d50...246625 |
56045.86K |
7.51% |
| 2 |
0xd7fb...9e563f |
55536.80K |
7.44% |
| 3 |
0x8898...0e63c6 |
52200.63K |
6.99% |
| 4 |
0x0000...e08a90 |
33007.40K |
4.42% |
| 5 |
0xcf8c...3ffa73 |
30000.00K |
4.02% |
| - |
Others |
519016.02K |
69.62% |
II. Core Factors Influencing CLEAR's Future Price
Macroeconomic Environment
-
Monetary Policy Impact: Major global macroeconomic drivers, including geopolitical shifts, demographic transitions, and rising capital costs, continue to reshape the investment opportunity landscape in 2026. These factors create a complex environment where policy changes from central banks and fiscal authorities may influence risk appetite across digital asset markets.
-
Inflation Hedging Attributes: In an environment where debt burdens are rising across developed markets and fiscal pressures mount, alternative assets have gained attention as portfolio diversification tools. Economic value increasingly reflects the broader environmental context in which economies operate, with supply-demand dynamics forming fundamental pricing considerations.
-
Geopolitical Factors: Regional developments, particularly in the U.S. and China, are driving rapid changes in regulatory frameworks and deployment strategies. Supportive regulation and significant private sector investment in emerging technologies create shifting dynamics that may influence capital flows across various asset classes. The evolution of global trade relationships and tariff policies adds another layer of complexity to the investment landscape.
Institutional and Major Holder Dynamics
While specific institutional holding data for CLEAR is not available in the provided materials, broader market trends indicate that institutional participants continue to evaluate their positions amid changing market conditions. Private capital markets are expected to play an increasingly significant role in funding infrastructure buildouts, with direct lenders demonstrating capabilities in faster execution and more flexible terms. However, competition is intensifying, which may lead to wider dispersion of returns across different market segments.
Technology Development and Ecosystem Building
The broader technological landscape is experiencing rapid transformation, with artificial intelligence development accelerating across major markets. This creates potential spillover effects into various technology sectors and infrastructure requirements. Private markets are anticipated to contribute substantially to funding large-scale infrastructure projects, given their long-term and flexible capital nature compared to traditional markets. As competition intensifies in various technology segments, the ability to execute quickly and offer adaptable solutions becomes increasingly valuable for ecosystem participants.
III. 2026-2031 CLEAR Price Prediction
2026 Outlook
- Conservative prediction: $0.00145 - $0.00191
- Neutral prediction: $0.00191 average price level
- Optimistic prediction: Up to $0.00242 (requires favorable market conditions)
2027-2029 Outlook
- Market stage expectation: Gradual recovery and accumulation phase with moderate volatility
- Price range prediction:
- 2027: $0.00192 - $0.00234, representing approximately 13% growth
- 2028: $0.00126 - $0.00335, with 18% average increase
- 2029: $0.00207 - $0.0037, showing 46% potential growth
- Key catalysts: Market sentiment improvement, potential ecosystem developments, and broader crypto market recovery trends
2030-2031 Long-term Outlook
- Baseline scenario: $0.0025 - $0.0038 (assuming steady market adoption and stable regulatory environment)
- Optimistic scenario: $0.00325 - $0.00472 (assuming enhanced utility and increased trading volume)
- Transformative scenario: Approaching $0.00472 level by 2031 (requires significant ecosystem expansion and favorable macroeconomic conditions)
- 2026-02-06: CLEAR trading at lower baseline levels with potential for gradual appreciation over the forecast period
| Year |
Predicted High Price |
Predicted Average Price |
Predicted Low Price |
Price Change |
| 2026 |
0.00242 |
0.00191 |
0.00145 |
0 |
| 2027 |
0.00234 |
0.00216 |
0.00192 |
13 |
| 2028 |
0.00335 |
0.00225 |
0.00126 |
18 |
| 2029 |
0.0037 |
0.0028 |
0.00207 |
46 |
| 2030 |
0.0038 |
0.00325 |
0.0025 |
70 |
| 2031 |
0.00472 |
0.00352 |
0.0018 |
84 |
IV. CLEAR Professional Investment Strategy and Risk Management
CLEAR Investment Methodology
(1) Long-term Holding Strategy
- Target Investors: Investors with moderate to high risk tolerance who believe in the long-term potential of cross-chain infrastructure and liquidity optimization solutions
- Operational Recommendations:
- Establish positions gradually through dollar-cost averaging to reduce entry price volatility impact
- Monitor key developments in Everclear's clearing layer technology and partnership expansion
- Utilize Gate Web3 Wallet for secure asset storage with proper private key management
(2) Active Trading Strategy
- Technical Analysis Tools:
- Volume Analysis: Monitor 24-hour trading volume trends, with current volume at approximately $20,171, to identify potential breakout or reversal patterns
- Support and Resistance Levels: Track key price levels including the 24-hour low of $0.001807 and high of $0.002221 for entry and exit points
- Swing Trading Essentials:
- Given high short-term volatility (7-day decline of 42.30%), establish strict stop-loss orders to protect capital
- Consider the low market cap of approximately $394,335 and limited exchange listings (4 exchanges) when sizing positions
CLEAR Risk Management Framework
(1) Asset Allocation Principles
- Conservative Investors: 1-2% of cryptocurrency portfolio
- Aggressive Investors: 3-5% of cryptocurrency portfolio
- Professional Investors: 5-10% of cryptocurrency portfolio with active hedging strategies
(2) Risk Hedging Solutions
- Partial Position Taking: Scale into positions across multiple price points to reduce single-entry risk
- Portfolio Diversification: Balance CLEAR holdings with established Layer 1 and Layer 2 assets to mitigate sector-specific risks
(3) Secure Storage Solutions
- Hot Wallet Recommendation: Gate Web3 Wallet for convenient trading access and integrated platform features
- Cold Storage Solution: Consider hardware wallet solutions for long-term holdings exceeding trading requirements
- Security Precautions: Never share private keys or seed phrases, enable two-factor authentication, and verify contract addresses (ETH: 0x58b9cb810a68a7f3e1e4f8cb45d1b9b3c79705e8) before transactions
V. CLEAR Potential Risks and Challenges
CLEAR Market Risks
- Extreme Price Volatility: CLEAR has experienced a 95.69% decline over one year and 66.83% decline over 30 days, indicating high volatility that could result in substantial capital loss
- Low Liquidity Concerns: With a market cap of approximately $394,335 and trading on only 4 exchanges, limited liquidity may lead to significant slippage and difficulty executing large orders
- Early-stage Market Position: Ranked #3224 by market capitalization with only 0.000080% market dominance, representing an early-stage investment with unproven market acceptance
CLEAR Regulatory Risks
- Cross-chain Protocol Oversight: As blockchain infrastructure matures, clearing layer protocols may face regulatory scrutiny regarding their role in facilitating cross-chain asset transfers
- Institutional Participant Compliance: Everclear's targeting of market makers, CEXs, and institutional actors may subject the protocol to enhanced regulatory requirements for these user categories
- Evolving Crypto Regulations: Global regulatory frameworks for decentralized finance and cross-chain protocols remain uncertain and subject to change
CLEAR Technical Risks
- Smart Contract Vulnerabilities: As with all blockchain protocols, CLEAR smart contracts deployed on Ethereum may contain undiscovered bugs or vulnerabilities that could be exploited
- Cross-chain Security Challenges: The clearing layer's function of netting and auctioning interchain flows introduces complex security considerations across multiple blockchain environments
- Protocol Dependency Risks: Everclear's reliance on Layer 2 infrastructure means technical issues or changes in underlying L2 networks could impact protocol functionality
VI. Conclusion and Action Recommendations
CLEAR Investment Value Assessment
Everclear presents an innovative solution to liquidity fragmentation in the cross-chain ecosystem through its clearing layer technology. The project's backing by prominent investors including Pantera Capital, Consensys, Polychain, and Coinbase demonstrates institutional confidence. However, the token faces substantial challenges, including a 95.69% decline from its all-time high of $0.07681 (reached in January 2025), a current ranking of #3224, and a circulating market cap of only $394,335. With a circulating supply of 207 million tokens (20.7% of maximum supply) and listing on only 4 exchanges, CLEAR represents a high-risk, early-stage investment suitable primarily for investors with strong risk tolerance and belief in the long-term potential of cross-chain infrastructure solutions.
CLEAR Investment Recommendations
✅ Beginners: Avoid or allocate minimal amounts (under 1% of portfolio) until market stability and adoption improve. Focus on understanding Everclear's technology and monitoring project developments before considering investment.
✅ Experienced Investors: Consider small speculative positions (2-3% of crypto portfolio) with strict risk management, including stop-loss orders and regular monitoring of technical developments and partnership announcements.
✅ Institutional Investors: Evaluate Everclear as a potential early-stage infrastructure play with focus on technology assessment, team execution capability, and competitive positioning in the cross-chain liquidity market.
CLEAR Trading Participation Methods
- Spot Trading on Gate.com: Direct purchase and sale of CLEAR tokens with access to trading pairs and platform liquidity
- Dollar-Cost Averaging: Systematic periodic purchases to reduce timing risk and smooth entry prices in volatile markets
- Liquidity Provision: For experienced users, consider participation in CLEAR liquidity pools on compatible decentralized exchanges, noting associated impermanent loss risks
Cryptocurrency investments carry extremely high risks, and this article does not constitute investment advice. Investors should make cautious decisions based on their own risk tolerance and are advised to consult professional financial advisors. Never invest more than you can afford to lose.
FAQ
What is the current price of CLEAR token?
The current price of CLEAR token is 0.004483 USDT, with a 24-hour increase of 9.42%.
What is the future price potential for CLEAR tokens?
CLEAR token has reached historical highs of $0.083367. Based on market momentum and adoption trends, price could potentially revisit and exceed previous peaks. Strong fundamentals and ecosystem growth suggest significant upside potential in the coming years.
What are the main factors affecting CLEAR price?
CLEAR price is primarily influenced by market supply and demand, trading volume, market sentiment, project developments, regulatory environment, and macroeconomic factors. These elements collectively determine CLEAR's market performance and price trends.
What are the practical applications and use cases of CLEAR tokens?
CLEAR tokens are primarily used for spot and futures trading in cryptocurrency markets. They serve practical purposes in investment and risk management strategies, enabling users to participate in digital asset trading across various market conditions.
What are the main risks of investing in CLEAR tokens?
Main risks include market volatility, price manipulation, regulatory uncertainty, and technical security vulnerabilities. CLEAR's value depends on market adoption and project development progress.
What are the advantages of CLEAR compared to other similar tokens?
CLEAR excels with efficient low fees, strong security, perfect community governance, rational token economics, and advanced smart contracts. Total supply is 1 billion tokens with long-term competitiveness.
* The information is not intended to be and does not constitute financial advice or any other recommendation of any sort offered or endorsed by Gate.