This comprehensive analysis examines DRAC's market position as a BRC-20 based token trading at $0.00489 with a market cap of $522,369 as of February 2026. The article evaluates DRAC's price trajectory from its May 2023 launch through 2031, analyzing historical patterns, market supply-demand dynamics, and macroeconomic factors influencing valuation. Key findings indicate DRAC demonstrates 182.32% annual growth despite recent 30-day declines of 20.96%, with extreme market fear sentiment presenting contrarian opportunities. The token exhibits moderate holder concentration (19.5% in top two addresses) and limited trading volume of $16,184 daily. Price range analysis spans from $0.00402-$0.00608 in 2026 to $0.00575-$0.01278 by 2031, contingent on ecosystem development and adoption rates. The article provides risk-calibrated investment strategies via Gate.com platform, including dollar-cost averaging for long-term holders and active trading approaches, while emphasizing comprehensive risk management frameworks esse
Introduction: DRAC's Market Position and Investment Value
DRAC (DRAC), as a BRC-20 based crypto inscription token, has been actively traded in the market since its launch in May 2023. As of February 2026, DRAC maintains a market capitalization of approximately $522,369, with a circulating supply of around 106.82 million tokens, and the price stabilizes at approximately $0.00489. This asset, recognized as an emerging BRC-20 meme token, is gradually establishing its presence within the Bitcoin ecosystem and inscription-based asset space.
This article will comprehensively analyze DRAC's price trends from 2026 to 2031, combining historical patterns, market supply and demand dynamics, ecosystem development, and macroeconomic environment factors to provide investors with professional price forecasts and practical investment strategies.
I. DRAC Price History Review and Market Status
DRAC Historical Price Evolution Trajectory
- 2023: DRAC launched with a publish price of $0.000046 in May, beginning its journey as a BRC-20 meme token
- 2022: The token reached its all-time high of $0.091844 on November 1, 2022, marking a significant peak in its trading history
- 2025: DRAC recorded its all-time low of $0.00005608 on February 16, 2025, representing the lowest point in its price trajectory
DRAC Current Market Situation
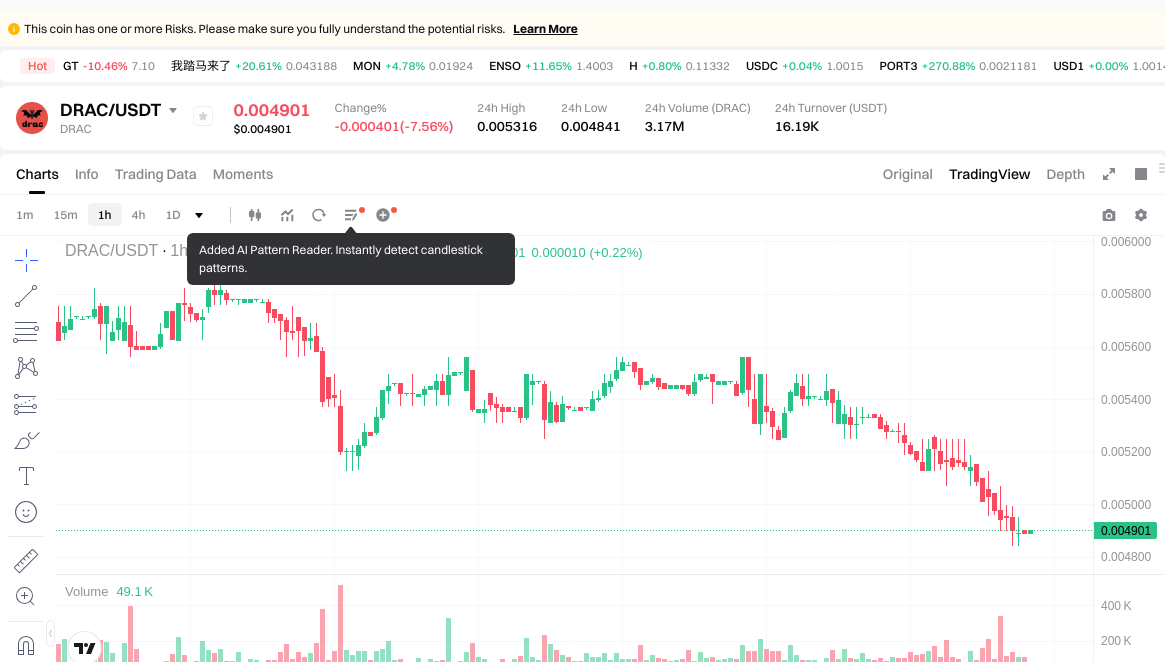
As of February 5, 2026, DRAC is trading at $0.00489, showing mixed performance across different timeframes. The token has demonstrated a gain of 182.32% over the past year, rising from lower levels to its current position. However, recent periods show downward pressure, with a 7.77% decline over the past 24 hours, a 15.93% decrease over the past 7 days, and a 20.96% drop over the past 30 days. In the last hour, the price showed a slight recovery of 0.22%.
The 24-hour trading range spans from a low of $0.004841 to a high of $0.005316, with a total trading volume of $16,184.69. DRAC maintains a circulating supply of 106,824,000 tokens, representing approximately 106.82% of its maximum supply of 100,000,000 tokens. The market capitalization stands at $522,369.36, with a fully diluted market cap matching this figure at $352,086.74. The token is held by 2,541 addresses.
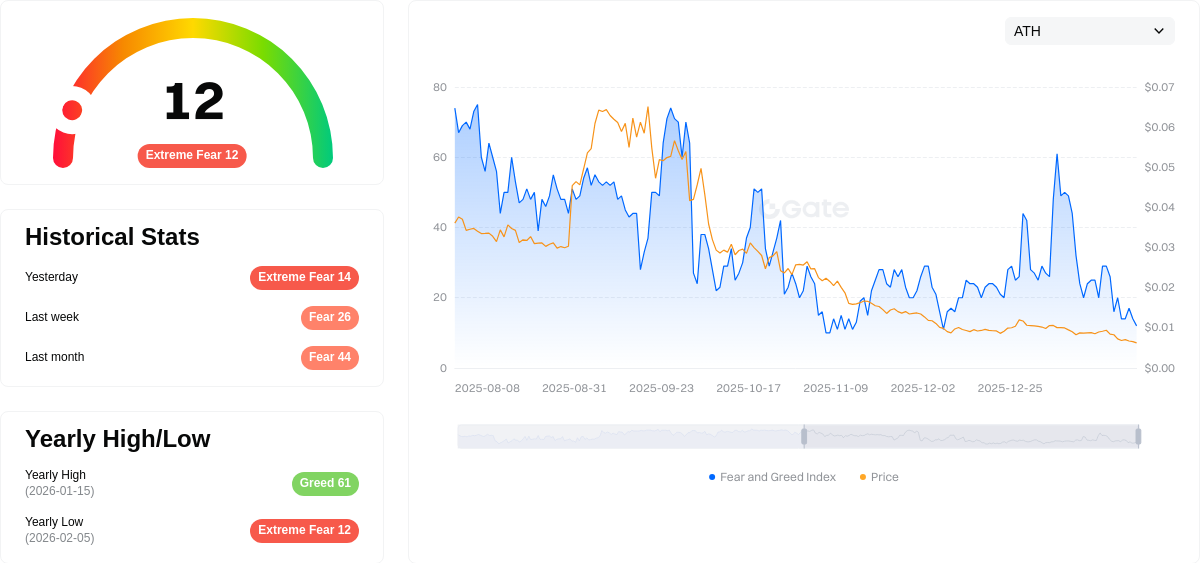
Since its launch price of $0.000046, DRAC has appreciated by approximately 105.30%. The current Fear & Greed Index for the broader crypto market sits at 12, indicating "Extreme Fear" sentiment among investors.
Click to view the current DRAC market price
DRAC Market Sentiment Index
02-05-2026 Fear & Greed Index: 12 (Extreme Fear)
Click to view current Fear & Greed Index
The crypto market is currently experiencing extreme fear, with the Fear & Greed Index at a critically low level of 12. This indicates strong negative sentiment and heightened anxiety among investors. Such extreme fear conditions often present contrarian opportunities, as markets tend to overreact during panic phases. However, traders should exercise caution and conduct thorough research before entering positions. Risk management remains paramount during periods of intense market pessimism. Monitor key support levels and market developments closely.
DRAC Holding Distribution
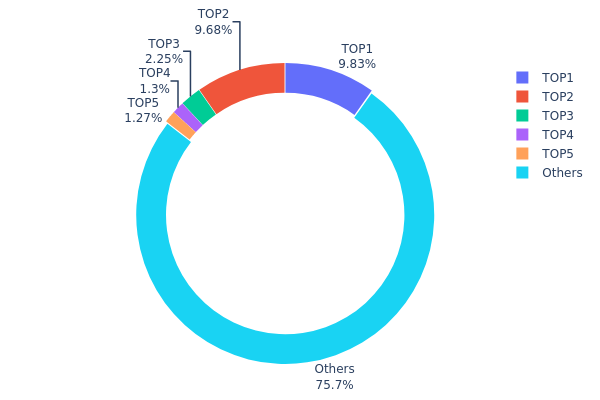
The holding distribution chart provides a quantitative visualization of token concentration across different wallet addresses, serving as a critical indicator for assessing decentralization levels and potential market manipulation risks within a cryptocurrency ecosystem. By analyzing the proportion of tokens held by top addresses versus smaller holders, this metric reveals the actual power structure and governance dynamics of the blockchain network.
Based on the current data, DRAC exhibits a moderate concentration pattern with the top two addresses controlling approximately 19.5% of the total supply. The largest holder possesses 10,500.66K tokens (9.82%), while the second-largest holds 10,344.88K tokens (9.68%). The top five addresses collectively account for 24.32% of the circulating supply, with the remaining 75.68% distributed among other participants. This distribution structure suggests neither extreme centralization nor complete decentralization, indicating a relatively balanced market composition.
From a market structure perspective, this concentration level presents both opportunities and risks. The substantial holdings by top addresses could provide price stability during market downturns, as these large holders typically adopt long-term investment strategies. However, the combined 19.5% held by the top two addresses also introduces potential volatility risks—any significant sell-off could trigger cascading liquidations. Nevertheless, with over three-quarters of tokens distributed among smaller holders, DRAC demonstrates reasonable resistance to single-entity manipulation, reflecting a moderately healthy on-chain structure that supports sustainable market development.
Click to view current DRAC Holding Distribution
| Top |
Address |
Holding Qty |
Holding (%) |
| 1 |
16G1xY...Vp9Wxh |
10500.66K |
9.82% |
| 2 |
1FJdZH...B9HgSf |
10344.88K |
9.68% |
| 3 |
14LEqn...F2UWYj |
2405.71K |
2.25% |
| 4 |
1CPu7W...dn92XA |
1393.26K |
1.30% |
| 5 |
1KMLqL...BvJHno |
1359.18K |
1.27% |
| - |
Others |
80820.31K |
75.68% |
II. Core Factors Influencing DRAC's Future Price
Supply Mechanism
- Market-driven Supply Dynamics: DRAC's price movement reflects a market-based supply and demand structure influenced by data compliance sector developments and technological progress in data regulation frameworks.
- Historical Patterns: Price volatility has been observed in response to shifts in market sentiment and user adoption rates, with historical data showing significant fluctuations tied to broader cryptocurrency market trends.
- Current Impact: Ongoing market demand for data compliance solutions, coupled with evolving regulatory landscapes, continues to shape supply-side pressures and price expectations.
Institutional and Major Holder Activity
- Institutional Positioning: Available data does not provide specific details on major institutional holdings in DRAC.
- Enterprise Adoption: Information regarding enterprise-level adoption of DRAC for data compliance purposes remains limited in current materials.
- National Policy Context: Regulatory changes in data governance and compliance standards across jurisdictions may indirectly influence demand and valuation trajectories.
Macroeconomic Environment
- Monetary Policy Influence: External economic factors, including central bank policies and liquidity conditions in global markets, play a role in shaping investor sentiment toward digital assets like DRAC.
- Inflation Hedge Characteristics: The broader cryptocurrency market's response to inflationary pressures may indirectly affect DRAC's positioning as a digital compliance asset.
- Geopolitical Factors: International regulatory coordination and geopolitical developments related to data privacy and cross-border data flows may impact market confidence.
Technological Development and Ecosystem Building
- Data Compliance Technology Advancement: Progress in data regulation and compliance technology frameworks contributes to DRAC's utility and potential adoption within the sector.
- Ecosystem Applications: The development of applications and platforms leveraging DRAC for data governance and regulatory compliance functions may enhance its long-term value proposition.
- User Adoption Trends: Growth in user adoption rates and integration into data compliance workflows represent key indicators for future demand and price stability.
III. 2026-2031 DRAC Price Prediction
2026 Outlook
- Conservative Forecast: $0.00402 - $0.0049
- Neutral Forecast: Around $0.0049
- Optimistic Forecast: Up to $0.00608 (requires favorable market sentiment and increased adoption)
2027-2029 Outlook
- Market Stage Expectation: The token may enter a gradual growth phase as the project matures and ecosystem development progresses
- Price Range Forecast:
- 2027: $0.00406 - $0.00631, representing approximately 12% growth potential
- 2028: $0.00437 - $0.00867, with approximately 20% upward momentum
- 2029: $0.00408 - $0.00904, showing roughly 49% appreciation potential
- Key Catalysts: Project roadmap execution, partnership announcements, and broader crypto market recovery trends
2030-2031 Long-term Outlook
- Base Scenario: $0.00596 - $0.01135 (assuming steady ecosystem growth and maintained community engagement)
- Optimistic Scenario: $0.00575 - $0.01278 (contingent on significant technological breakthroughs and mass adoption)
- Transformative Scenario: Reaching the upper bound of $0.01278 by 2031 (requires exceptional market conditions and substantial project milestones achievement, representing approximately 99% cumulative growth from 2026 baseline)
- 2026-02-05: DRAC trading within the initial forecasted range (early-stage price discovery phase)
| Year |
Predicted High Price |
Predicted Average Price |
Predicted Low Price |
Price Change |
| 2026 |
0.00608 |
0.0049 |
0.00402 |
0 |
| 2027 |
0.00631 |
0.00549 |
0.00406 |
12 |
| 2028 |
0.00867 |
0.0059 |
0.00437 |
20 |
| 2029 |
0.00904 |
0.00729 |
0.00408 |
49 |
| 2030 |
0.01135 |
0.00816 |
0.00596 |
66 |
| 2031 |
0.01278 |
0.00975 |
0.00575 |
99 |
IV. DRAC Professional Investment Strategy and Risk Management
DRAC Investment Methodology
(1) Long-term Holding Strategy
- Target Investors: Long-term cryptocurrency enthusiasts and investors who believe in the potential of BRC-20 tokens
- Operational Recommendations:
- Consider dollar-cost averaging (DCA) to mitigate volatility, given DRAC's significant price fluctuations with a 24-hour change of -7.77%
- Monitor the token's circulation ratio of 106.82% and be aware that with 106.824 million tokens in circulation out of a max supply of 100 million, the project may have unique tokenomics
- Storage Solution: Utilize Gate Web3 Wallet for secure storage, ensuring private key management and backup procedures are properly maintained
(2) Active Trading Strategy
- Technical Analysis Tools:
- Moving Averages: Track 7-day and 30-day trends, noting recent declines of -15.93% and -20.96% respectively to identify potential reversal points
- Volume Analysis: Monitor the 24-hour trading volume of approximately $16,184 to assess market liquidity and trading interest
- Swing Trading Key Points:
- Establish entry points near the 24-hour low of $0.004841 and set profit targets near resistance levels around $0.005316
- Implement stop-loss orders to protect against further downside, particularly given the recent negative momentum across multiple timeframes
DRAC Risk Management Framework
(1) Asset Allocation Principles
- Conservative Investors: 1-2%
- Aggressive Investors: 5-8%
- Professional Investors: 10-15%
(2) Risk Hedging Solutions
- Portfolio Diversification: Allocate DRAC as a small portion of a broader cryptocurrency portfolio, considering its micro-cap status with a market cap of approximately $522,369
- Position Sizing: Limit exposure based on the token's high volatility, evidenced by a historical high of $0.091844 and a historical low of $0.00005608
(3) Secure Storage Solutions
- Web3 Wallet Recommendation: Gate Web3 Wallet provides comprehensive support for BRC-20 tokens and offers enhanced security features
- Cold Storage Option: Consider cold storage solutions for long-term holdings to minimize exposure to online security risks
- Security Precautions: Enable two-factor authentication, regularly update security protocols, and never share private keys or seed phrases
V. DRAC Potential Risks and Challenges
DRAC Market Risks
- High Volatility: DRAC exhibits substantial price volatility, with a 1-year performance of +182.32% but recent negative momentum across shorter timeframes
- Low Liquidity: With a 24-hour trading volume of approximately $16,184 and market cap of around $522,369, the token may experience significant slippage during larger trades
- Limited Exchange Availability: DRAC is currently listed on a limited number of exchanges, which may constrain trading opportunities and liquidity
DRAC Regulatory Risks
- BRC-20 Token Classification: Regulatory frameworks for Bitcoin-based inscription tokens like DRAC remain unclear in many jurisdictions
- Compliance Uncertainty: Evolving cryptocurrency regulations may impact the trading, holding, or transfer of DRAC tokens
- Cross-border Regulatory Divergence: Different regulatory approaches across jurisdictions may create compliance challenges for investors
DRAC Technical Risks
- BRC-20 Standard Limitations: As a Bitcoin-based inscription token, DRAC may face technical constraints inherent to the BRC-20 standard
- Network Dependency: DRAC's functionality is dependent on Bitcoin network stability and transaction processing capabilities
- Smart Contract Risks: While BRC-20 tokens operate differently from smart contract platforms, they may still face technical vulnerabilities related to inscription protocols
VI. Conclusion and Action Recommendations
DRAC Investment Value Assessment
DRAC represents a speculative investment opportunity within the BRC-20 token ecosystem. While the token has demonstrated significant long-term growth of +182.32% over the past year, recent performance shows concerning negative momentum across 24-hour (-7.77%), 7-day (-15.93%), and 30-day (-20.96%) timeframes. The project's micro-cap status with a market cap of approximately $522,369 and limited trading volume suggests high risk potential. Investors should approach DRAC with extreme caution, recognizing that it remains a highly speculative asset with limited fundamental information available.
DRAC Investment Recommendations
✅ Beginners: Allocate no more than 1-2% of your cryptocurrency portfolio to DRAC, and only invest amounts you can afford to lose entirely. Focus on education about BRC-20 tokens and inscription technology before investing.
✅ Experienced Investors: Consider DRAC as a small speculative position (3-5% of crypto portfolio) with clear profit-taking and stop-loss levels. Monitor market sentiment and trading volume closely for entry and exit signals.
✅ Institutional Investors: Conduct thorough due diligence on DRAC's tokenomics, market positioning, and technical infrastructure before considering allocation. Implement robust risk management frameworks and position sizing strategies appropriate for micro-cap, high-volatility assets.
DRAC Trading Participation Methods
- Spot Trading: Purchase DRAC directly through Gate.com's spot markets, utilizing limit orders to optimize entry prices given potential liquidity constraints
- Dollar-Cost Averaging: Implement systematic accumulation strategies to mitigate timing risk and reduce the impact of short-term volatility
- Portfolio Integration: Incorporate DRAC as part of a diversified cryptocurrency portfolio, balancing exposure across different asset categories and risk profiles
Cryptocurrency investment carries extremely high risks, and this article does not constitute investment advice. Investors should make cautious decisions based on their own risk tolerance and are advised to consult professional financial advisors. Never invest more than you can afford to lose.
FAQ
What is DRAC? What are its uses and application scenarios?
DRAC is a decentralized protocol token designed for Web3 infrastructure and governance. It enables users to participate in network decisions, access services, and earn rewards. Applications include decentralized finance, governance participation, and ecosystem utility within the Web3 platform.
DRAC rose from its low of HK$0.007847 on July 23, 2023 to its high of HK$0.341734 on December 16, 2023, showing strong growth momentum. As of February 5, 2026, the price has experienced moderate correction, reflecting market consolidation after previous gains.
Will DRAC price rise or fall in 2024? What do experts predict?
Experts predict DRAC will continue declining in 2024. Current price stands at $0.004945 with 24-hour trading volume of $15,047.04. The token has dropped 14.10% in the past 7 days, indicating bearish market sentiment.
What are the main factors affecting DRAC price?
DRAC price is primarily influenced by supply mechanisms, market demand, technology development, and regulatory environment. These factors collectively determine its market performance and investment value.
What are DRAC's advantages and disadvantages compared to similar projects?
DRAC offers advanced remote management capabilities and enhanced security features. However, it faces higher implementation costs and complexity. Competitors like traditional solutions are more cost-effective but lack DRAC's sophisticated functionality and scalability advantages.
What are the risks to note when investing in DRAC?
DRAC carries risks including high price volatility, limited exchange coverage, market concentration concerns, and the inherent risks associated with meme tokens and BRC-20 standard assets.
What is the liquidity and trading volume of DRAC? On which exchanges can it be traded?
DRAC demonstrates strong liquidity with substantial trading volume. It is available for trading on major cryptocurrency exchanges, ensuring easy access and efficient price discovery for traders and investors.
What is the technical team and project background of DRAC? What is the project's roadmap?
DRAC's technical team focuses on data regulation and compliance. The project has not publicly disclosed a specific development roadmap yet. DRAC can be purchased on Gate.com platform and stored securely using compatible BRC20 wallets.
* The information is not intended to be and does not constitute financial advice or any other recommendation of any sort offered or endorsed by Gate.