2026 GARI Price Prediction: Expert Analysis and Market Forecast for the Digital Creator Token

Introduction: GARI's Market Position and Investment Value
GARI Network (GARI), positioned as a social token platform serving short-video content creators on the Chingari application, has been connecting creators and audiences through blockchain technology since its launch in 2022. As of February 2026, GARI maintains a market capitalization of approximately $574,371, with a circulating supply of around 660.35 million tokens and a current price hovering near $0.0008698. This asset, designed as a "gateway to blockchain for short-video communities", is playing an increasingly important role in empowering digital content creators and facilitating decentralized creator economies.
This article will comprehensively analyze GARI's price trajectory from 2026 to 2031, combining historical patterns, market supply-demand dynamics, ecosystem development, and macroeconomic conditions to provide investors with professional price forecasts and practical investment strategies.
I. GARI Price History Review and Market Status
GARI Historical Price Evolution Trajectory
- 2022: GARI reached its all-time high on February 22, with price at $0.982499
- 2022-2025: Extended market correction period, price experienced significant decline from peak levels
- 2026: Price touched historical low at $0.00083244 on February 2, reflecting broader market adjustment
GARI Current Market Situation
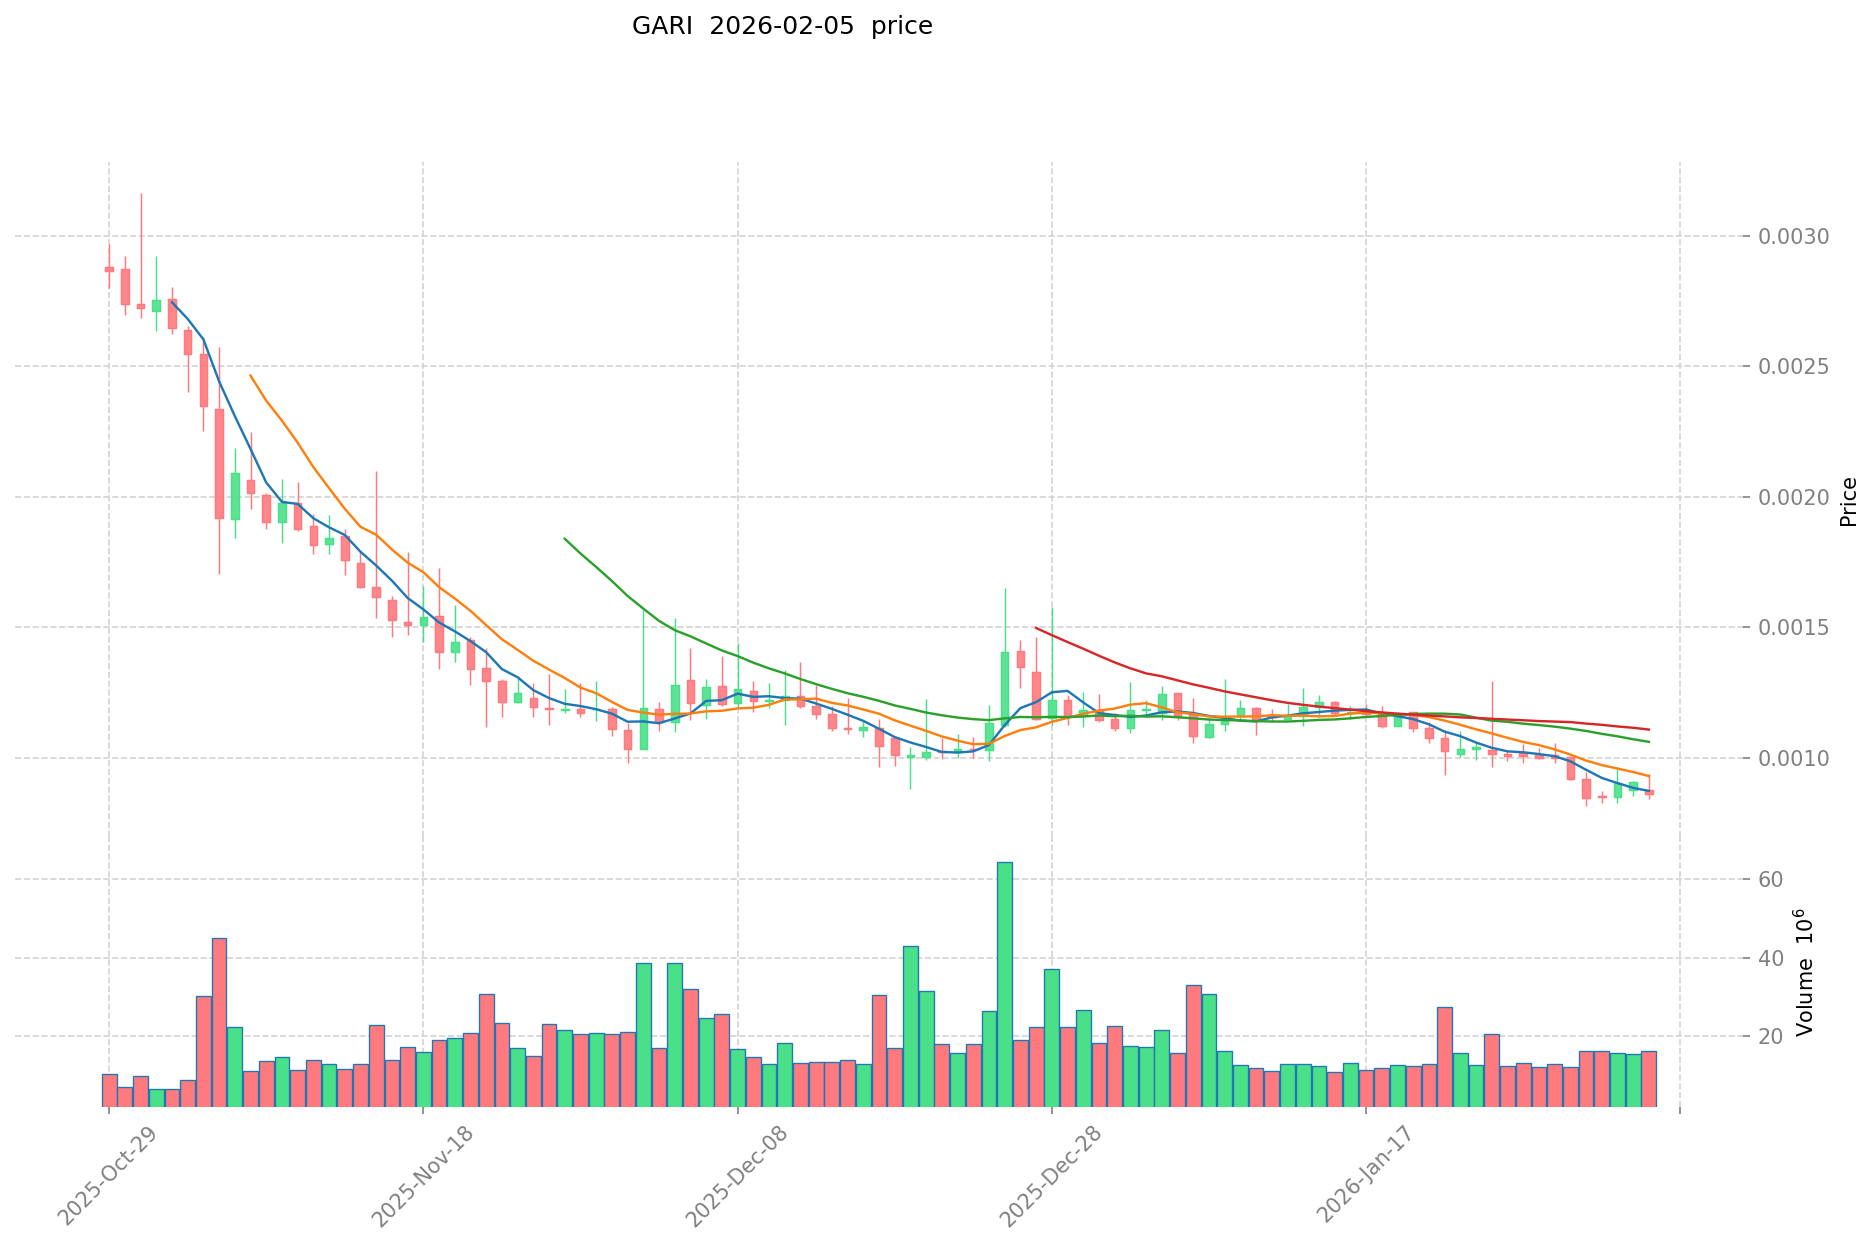
As of February 5, 2026, GARI is trading at $0.0008698, showing a 24-hour change of -4.6%. The token's 24-hour trading range spans between $0.0008415 (low) and $0.0009373 (high), with total trading volume reaching $14,190.84.
From a multi-timeframe perspective, GARI has experienced downward pressure across different periods: 1-hour change stands at +0.89%, while 7-day, 30-day, and 1-year changes reflect declines of -14.09%, -27.36%, and -90.84% respectively.
The token's current market capitalization is approximately $574,371, with a circulating supply of 660,348,765 GARI tokens, representing 66.03% of the total supply of 997,400,773 GARI. The fully diluted market cap is calculated at $867,539. GARI's market dominance remains at 0.000034% of the overall cryptocurrency market.
The project maintains a holder base of 2,843,163 addresses. GARI is currently listed on 3 exchanges, with Gate.com being one of the trading platforms. The token's initial offering price was $0.2.
GARI operates as a social token for short-form video content creators, primarily integrated with the Chingari application. The token facilitates direct interaction between creators and audiences, enabling governance participation and platform engagement within the Chingari ecosystem.
Click to view current GARI market price
GARI Market Sentiment Index
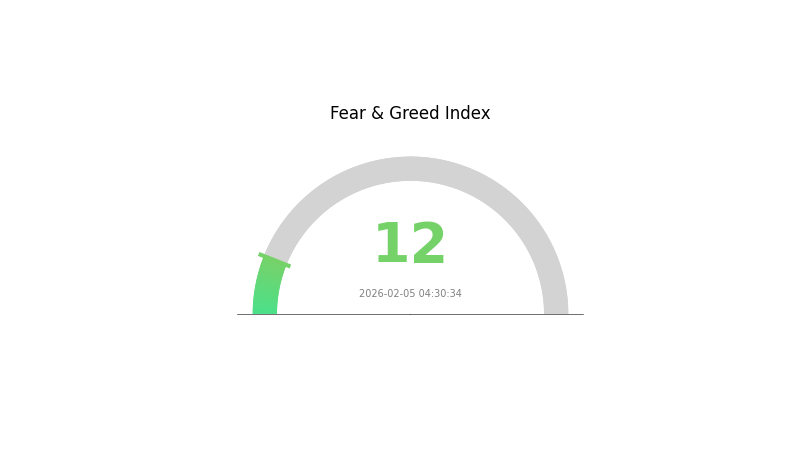
2026-02-05 Fear and Greed Index: 12 (Extreme Fear)
Click to view current Fear & Greed Index
The cryptocurrency market is currently experiencing extreme fear with a GARI index reading of 12. This exceptionally low sentiment indicates widespread investor anxiety and pessimism across the market. Such extreme fear conditions historically present contrarian opportunities for long-term investors, as panic selling often creates buying opportunities at lower valuations. However, caution is warranted, and investors should conduct thorough research before making decisions. Market sentiment can shift rapidly, and risk management remains crucial during periods of heightened fear in the crypto market.
GARI Holding Distribution
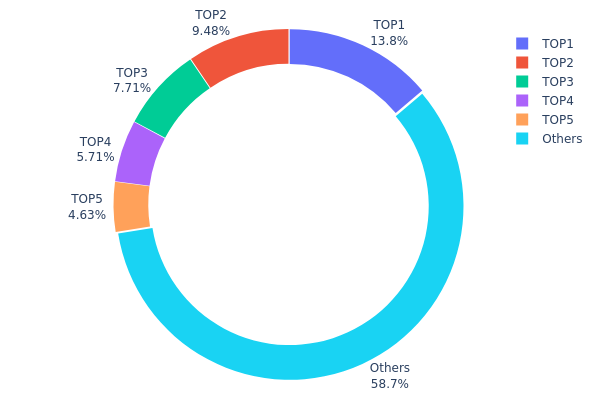
The holding distribution chart provides a visual representation of how GARI tokens are allocated across different wallet addresses, offering crucial insights into the token's ownership structure and concentration levels. By analyzing the distribution of tokens among top holders versus the broader community, we can assess the degree of centralization and potential risks associated with concentrated ownership.
Based on the current data, GARI exhibits a moderately concentrated holding pattern. The top holder controls approximately 13.80% of the total supply (134.22 million tokens), while the second and third largest addresses hold 9.48% and 7.70% respectively. Collectively, the top five addresses account for 41.31% of the total GARI supply, with the remaining 58.69% distributed among other addresses. This concentration level suggests a relatively balanced structure where no single entity dominates the market, yet significant influence remains with a small group of major holders.
This distribution pattern has several implications for GARI's market dynamics. The presence of large holders can contribute to price volatility, particularly during periods of significant token movements or market uncertainty. However, the fact that nearly 59% of tokens are held outside the top five addresses indicates a reasonable level of decentralization, which may reduce the risk of market manipulation by any single party. The current structure suggests a developing ecosystem where early investors or project-related wallets maintain substantial positions while allowing for broader community participation and token distribution across the network.
Click to view current GARI Holding Distribution
| Top | Address | Holding Qty | Holding (%) |
|---|---|---|---|
| 1 | 6GGQLF...WftN6r | 134221.37K | 13.80% |
| 2 | E2RvJg...qnatYy | 92197.17K | 9.48% |
| 3 | EFE3j1...o4ewqR | 74932.90K | 7.70% |
| 4 | u6PJ8D...ynXq2w | 55573.21K | 5.71% |
| 5 | AGVhmr...gHAk8N | 45000.00K | 4.62% |
| - | Others | 570504.28K | 58.69% |
II. Core Factors Influencing GARI's Future Price
Supply Mechanism
- Decentralized Creator Platform: Gari Network's core design aims to empower creators by providing them with a decentralized platform, which influences token utility and circulation patterns.
- Market Dynamics: Supply and demand dynamics play a fundamental role in price formation, with scarcity potentially driving upward pressure when demand increases.
- Current Impact: As the platform continues to develop and attract more creators, token utility may expand, potentially affecting supply-demand balance.
Institutional and Major Holder Dynamics
Due to limited available data on institutional holdings and enterprise adoption specific to GARI, this section focuses on general market participant behavior. Investor sentiment and confidence remain key drivers of price movements in the cryptocurrency market.
Macroeconomic Environment
- Monetary Policy Impact: Global central bank policies and interest rate decisions influence risk appetite in cryptocurrency markets, potentially affecting GARI's trading patterns.
- Market Trends: Broader cryptocurrency market sentiment and trends can create spillover effects on individual tokens, including GARI.
- Regulatory Landscape: Evolving regulatory frameworks in different jurisdictions may impact market access and investor participation.
Technology Development and Ecosystem Building
- Creator Economy Integration: The platform's focus on empowering creators through decentralized infrastructure represents a key value proposition that may drive adoption.
- Platform Development: Continued technological improvements and feature enhancements could strengthen the ecosystem and attract more users.
- Ecosystem Applications: The growth of creator-focused applications and services built on Gari Network may contribute to increased network activity and token utility.
III. 2026-2031 GARI Price Forecast
2026 Outlook
- Conservative Forecast: $0.00051 - $0.00084
- Neutral Forecast: $0.00084
- Optimistic Forecast: $0.00092 (contingent on favorable market conditions and ecosystem development)
The initial forecast period suggests a relatively stable phase for GARI, with price projections indicating a slight contraction of approximately 3% compared to current levels. The trading range is expected to fluctuate between $0.00051 at the lower bound and $0.00092 at the peak, with an average price hovering around $0.00084. This consolidation phase may reflect broader market adjustment patterns and the project's ongoing development trajectory.
2027-2029 Mid-Term Outlook
- Market Phase Expectation: Gradual recovery and growth momentum building
- Price Range Forecast:
- 2027: $0.00046 - $0.00123
- 2028: $0.00057 - $0.00135
- 2029: $0.00114 - $0.00135
- Key Catalysts: Ecosystem maturation, increased adoption rates, and potential market cycle transitions
The mid-term projection reveals an evolving landscape for GARI, with 2027 marking a potential turning point as the price change indicator shifts to positive territory. By 2028, the forecast suggests a notable expansion with a 21% increase, followed by accelerated growth of 38% in 2029. This progressive trajectory could be supported by strengthening fundamentals and broader market sentiment improvements. The narrowing gap between low and high price estimates in 2029 ($0.00114 - $0.00135) may indicate increased price stability and market maturity.
2030-2031 Long-Term Outlook
- Baseline Scenario: $0.00097 - $0.00128 (assuming steady ecosystem growth and stable market conditions)
- Optimistic Scenario: $0.00145 - $0.00162 (with enhanced adoption and favorable regulatory environment)
- Transformative Scenario: $0.002 (under exceptional circumstances with widespread platform integration)
The long-term projections paint an increasingly positive picture for GARI, with 2030 forecasts indicating a 46% potential increase, followed by a robust 66% growth projection for 2031. The upper range reaching $0.002 represents a significant milestone, though achieving this level would require substantial ecosystem expansion and sustained market momentum. The average price progression from $0.00128 in 2030 to $0.00145 in 2031 suggests a maturing asset with growing stability. Investors should note that these extended forecasts carry inherent uncertainty and depend heavily on project execution, market adoption, and broader cryptocurrency market dynamics.
| Year | Predicted High Price | Predicted Average Price | Predicted Low Price | Price Change |
|---|---|---|---|---|
| 2026 | 0.00092 | 0.00084 | 0.00051 | -3 |
| 2027 | 0.00123 | 0.00088 | 0.00046 | 1 |
| 2028 | 0.00135 | 0.00106 | 0.00057 | 21 |
| 2029 | 0.00135 | 0.0012 | 0.00114 | 38 |
| 2030 | 0.00162 | 0.00128 | 0.00097 | 46 |
| 2031 | 0.002 | 0.00145 | 0.00117 | 66 |
IV. GARI Professional Investment Strategy and Risk Management
GARI Investment Methodology
(I) Long-term Holding Strategy
- Target Audience: Investors who believe in the creator economy model and are willing to support the development of the Chingari platform ecosystem
- Operational Recommendations:
- Accumulate positions during periods of significant price corrections to reduce average cost
- Monitor the growth of platform users and content creators as key indicators for long-term value assessment
- Consider using Gate Web3 Wallet for secure storage to ensure full control over private keys
(II) Active Trading Strategy
- Technical Analysis Tools:
- Moving Averages: Observe the crossover of 7-day and 30-day moving averages to identify potential trend reversal signals
- Volume Analysis: Pay attention to the relationship between trading volume and price movements, with abnormal volume increases potentially indicating trend changes
- Swing Trading Key Points:
- Set clear stop-loss levels, such as 10-15% below the entry price
- Take profits in stages during rallies to lock in gains and reduce risk exposure
GARI Risk Management Framework
(I) Asset Allocation Principles
- Conservative Investors: Allocate no more than 1-2% of total portfolio to GARI
- Aggressive Investors: May allocate 3-5% of portfolio, but should closely monitor market dynamics
- Professional Investors: Can adjust allocation flexibly based on market conditions, but should not exceed 10% of portfolio
(II) Risk Hedging Solutions
- Diversified Portfolio: Combine GARI with stablecoins or other established cryptocurrencies to reduce single-asset risk
- Position Sizing: Avoid investing all funds at once, adopt a dollar-cost averaging strategy to mitigate timing risk
(III) Secure Storage Solutions
- Hot Wallet Recommendation: Gate Web3 Wallet, suitable for frequent trading and convenient access
- Cold Storage Solution: For long-term holdings, consider transferring to hardware wallets or paper wallets to prevent online attacks
- Security Precautions: Enable two-factor authentication, regularly backup wallet information, and never share private keys or seed phrases
V. GARI Potential Risks and Challenges
GARI Market Risks
- High Volatility: GARI has experienced significant price fluctuations, with a 24-hour change of -4.6% and a 7-day decline of -14.09%, indicating substantial short-term volatility
- Low Liquidity: With a 24-hour trading volume of approximately $14,190, limited liquidity may lead to significant slippage during large transactions
- Market Sentiment Dependency: As a social token tied to the Chingari platform, GARI's price is heavily influenced by platform user activity and overall market sentiment
GARI Regulatory Risks
- Regional Policy Uncertainty: Cryptocurrency regulations vary significantly across countries, particularly in India where the Chingari platform is based, and potential policy changes could impact GARI's circulation and use
- Compliance Requirements: As regulatory frameworks evolve, GARI and its associated platform may need to meet stricter compliance standards, which could increase operational costs
- Token Classification Debate: Different jurisdictions may classify social tokens differently, affecting GARI's legal status and trading environment
GARI Technical Risks
- Smart Contract Vulnerabilities: GARI is deployed on SOL and APT chains, and potential smart contract flaws could lead to security incidents
- Blockchain Network Dependencies: GARI's functionality relies on the stability and security of its underlying blockchains, and any network issues could affect token transfers and transactions
- Platform Integration Risks: GARI's value is closely tied to the Chingari application, and technical issues or user experience problems on the platform could negatively impact token demand
VI. Conclusion and Action Recommendations
GARI Investment Value Assessment
GARI Network aims to build a creator economy ecosystem within short-video content platforms, offering a unique value proposition. However, it faces significant challenges including substantial price volatility, limited liquidity, and strong platform dependency. The token has declined approximately 90.84% over the past year, and currently ranks 2924 in market capitalization, indicating considerable investment risk. Long-term value depends on the continued growth of the Chingari platform's user base and creator ecosystem, while short-term volatility and regulatory uncertainties remain major concerns.
GARI Investment Recommendations
✅ Beginners: Given GARI's high volatility and limited liquidity, new investors should exercise extreme caution. If interested in participating, limit exposure to less than 1% of total portfolio and prioritize learning about the project and market dynamics ✅ Experienced Investors: May consider small speculative positions but should closely monitor platform development and market trends. Implement strict risk management with clear stop-loss strategies ✅ Institutional Investors: Conduct thorough due diligence on the Chingari platform's business model, user growth trajectory, and competitive landscape. Consider the token's liquidity constraints and regulatory environment before making allocation decisions
GARI Trading Participation Methods
- Spot Trading on Gate.com: Suitable for investors seeking straightforward buy-and-hold or short-term trading strategies
- Dollar-Cost Averaging: Systematically accumulate positions over time to reduce timing risk and average down entry costs
- Secure Storage with Gate Web3 Wallet: After purchasing, transfer tokens to Gate Web3 Wallet for enhanced security and full control over assets
Cryptocurrency investments carry extremely high risks, and this article does not constitute investment advice. Investors should make cautious decisions based on their own risk tolerance and are advised to consult professional financial advisors. Never invest more than you can afford to lose.
FAQ
What is the historical price trend of GARI token and what are the main factors affecting its price fluctuations?
GARI token's price has fluctuated based on Chingari platform adoption and creator participation. Key factors include user growth on the platform, creator engagement levels, and overall market demand dynamics influencing token value.
How to conduct GARI price prediction? What technical analysis methods or tools can be used?
Use technical analysis methods like moving averages and RSI indicators to analyze GARI price trends. Popular tools include TradingView for charting and analysis. Monitor trading volume, support/resistance levels, and market sentiment to make informed predictions.
What are the future prospects of GARI token? How are its application scenarios and ecosystem development progressing?
GARI token shows strong potential in content creation and digital media ecosystems. The platform continues expanding its DeFi integrations and NFT utilities, with growing community engagement and partnerships advancing ecosystem development progressively.
What are the risks of investing in GARI tokens? What is the accuracy of price predictions?
GARI investment carries market volatility and technical risks. Price predictions may vary; 2027 estimated price is $0.0009649 based on modeling. Accuracy not guaranteed; past performance doesn't ensure future results.
How does GARI's price performance compare to other social media tokens such as SAND and FLOW?
GARI demonstrates strong competitive positioning among social media tokens. With growing user engagement and content monetization momentum, GARI's price trajectory shows resilience and growth potential, outperforming several comparable social tokens through 2025-2026.
Share
Content
Introduction: GARI's Market Position and Investment Value
I. GARI Price History Review and Market Status
II. Core Factors Influencing GARI's Future Price
III. 2026-2031 GARI Price Forecast
IV. GARI Professional Investment Strategy and Risk Management
V. GARI Potential Risks and Challenges
VI. Conclusion and Action Recommendations
FAQ
How to Buy Cryptocurrency


Trending Cryptocurrencies


How to Make Money on TikTok: 10 Real Ways to Earn in 2025
How does SocialFi empower creators: monetization, tokens, and community governance

What is SocialFi? Explore the future of decentralized social media in the field of crypto assets

Top 5 SocialFi projects to watch in 2025: the intersection of crypto assets and social interaction
What Is the Correlation Between Bitcoin's Social Media Followers and Its Environmental Impact?

DDD Token: Challenging medical insurance injustice with blockchain technology
What is Leverage Trading? A Crypto Investment Strategy to Maximize Returns

Expertise in Determining Entry and Exit Points Through Multi-Timeframe Analysis

NFT Trading: How to Buy and Sell NFTs - A Step-by-Step Guide
How Bitcoin Futures Trading Works: Principles and Pros & Cons
Comprehensive Guide to Cryptocurrency Scalping Trading