This article provides comprehensive price analysis for Housecoin (HOUSE), a meme-themed cryptocurrency hedging the real estate market launched in 2025. It examines HOUSE's market position, historical price trajectory from $0.33 peak to current $0.0007697 levels, and core influencing factors including supply dynamics, macroeconomic conditions, and demographic trends. The analysis offers detailed price predictions through 2031, with 2026 targeting $0.00043-$0.00096 range. Professional investment strategies cover long-term holding and active trading approaches, alongside comprehensive risk management frameworks and secure storage solutions via Gate Web3 Wallet. The article addresses market volatility, liquidity constraints, and regulatory uncertainties while providing actionable investment recommendations tailored to different investor profiles, from beginners to institutional participants seeking exposure to this speculative meme asset.
Introduction: HOUSE's Market Position and Investment Value
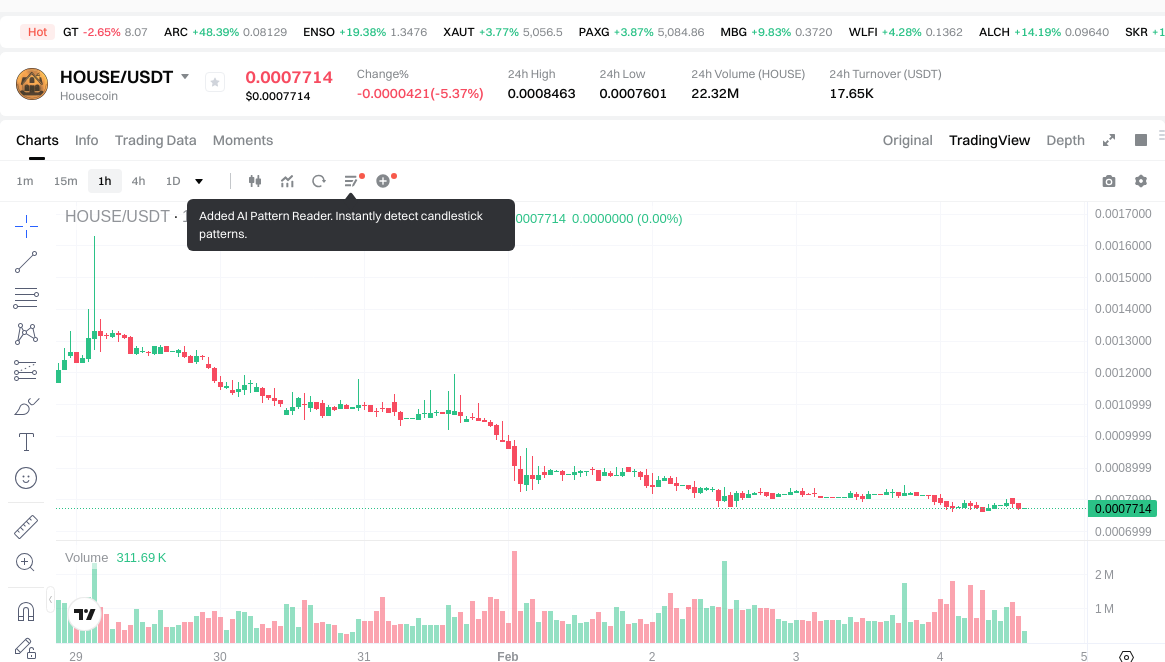
Housecoin (HOUSE) serves as a meme-themed cryptocurrency centered on hedging the real estate market, launched in 2025. As of February 4, 2026, Housecoin has established a market capitalization of approximately $768,746, with a circulating supply of around 998.76 million tokens, and a current price of approximately $0.0007697. This asset, positioning itself with the concept that "1 $HOUSE token will be worth 1 house," operates within the intersection of cryptocurrency speculation and real estate market sentiment.
This article comprehensively analyzes HOUSE's price trajectory from 2026 through 2031, combining historical patterns, market supply-demand dynamics, ecosystem development, and macroeconomic conditions to provide investors with professional price forecasts and practical investment strategies.
I. HOUSE Price History Review and Market Status
HOUSE Historical Price Evolution Trajectory
- 2025: Token launched in January 2025, reaching a peak of $0.33 in May 2025 during its initial market phase
- 2026: Price experienced significant correction, declining to $0.0007601 in February 2026
HOUSE Current Market Situation
As of February 04, 2026, HOUSE is trading at $0.0007697, showing notable volatility across different timeframes. Over the past hour, the token has declined by 2.07%, while the 24-hour period reflects a 5.58% decrease. The weekly performance shows a more substantial decline of 34.16%, with the 30-day period demonstrating a 64.23% decrease from previous levels.
The token's 24-hour trading range spans from $0.0007601 to $0.0008463, with a total trading volume of approximately $17,667.34. The current market capitalization stands at $768,746.26, with a fully diluted market cap matching this figure, indicating that 100% of the total supply of 998,760,897 HOUSE tokens is currently in circulation.
Housecoin maintains a presence across 12 cryptocurrency exchanges and has attracted a holder base of 22,148 addresses. The token's market dominance remains at 0.000028% of the overall cryptocurrency market. The fully diluted valuation to market cap ratio of 100% suggests complete token distribution with no additional supply anticipated.
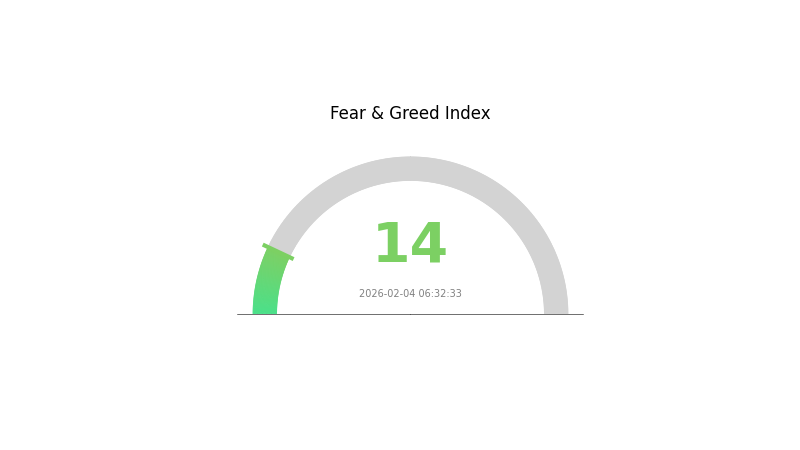
The broader market sentiment indicator reflects an extreme fear reading of 14, which may be influencing current trading patterns across the cryptocurrency sector, including HOUSE.
Click to view current HOUSE market price
HOUSE Market Sentiment Indicator
2026-02-04 Fear and Greed Index: 14 (Extreme Fear)
Click to view current Fear & Greed Index
Market Analysis:
The Fear and Greed Index has dropped to 14, indicating extreme fear in the crypto market. This suggests significant pessimism and risk aversion among investors. During such periods, market volatility typically increases as panic selling intensifies. For experienced traders, extreme fear often presents contrarian opportunities, as historically, major price recoveries frequently begin from these oversold conditions. However, risk management remains crucial during heightened uncertainty. Monitor key support levels closely and consider dollar-cost averaging strategies if you plan to increase positions.
HOUSE 持仓分布
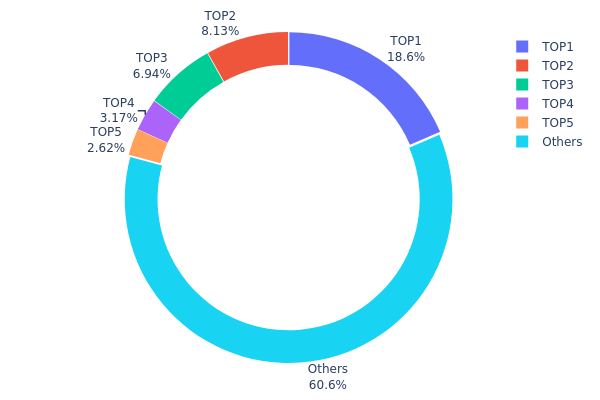
The holding distribution chart illustrates how HOUSE tokens are allocated across different wallet addresses on the blockchain, serving as a key indicator of token concentration and decentralization level. By analyzing the distribution pattern, we can assess potential risks related to market manipulation and evaluate the overall health of the token's circulation structure.
According to the latest on-chain data, the top holder controls approximately 18.57% of the total HOUSE supply (185,523.55K tokens), while the second and third largest addresses hold 8.12% and 6.94% respectively. The top five addresses collectively account for 39.41% of the total supply, with the remaining 60.59% distributed among other holders. This distribution pattern indicates a moderate level of concentration, falling between highly centralized and fully decentralized structures.
From a market structure perspective, while the current concentration level does not present an extreme centralization risk, the top holder's significant 18.57% stake warrants attention. Such substantial holdings could potentially create selling pressure or influence price movements during large-scale liquidations. However, the fact that over 60% of tokens remain distributed among numerous smaller holders suggests a relatively healthy circulation base, which may help absorb potential market shocks and maintain price stability during volatile periods.
Click to view current HOUSE holding distribution
| Top |
Address |
Holding Qty |
Holding (%) |
| 1 |
Gj5t6K...f96HNH |
185523.55K |
18.57% |
| 2 |
BmFdpr...WTymy6 |
81138.83K |
8.12% |
| 3 |
u6PJ8D...ynXq2w |
69322.31K |
6.94% |
| 4 |
ASTyfS...g7iaJZ |
31701.69K |
3.17% |
| 5 |
8bEfPK...Howub5 |
26135.40K |
2.61% |
| - |
Others |
604776.34K |
60.59% |
II. Core Factors Influencing HOUSE's Future Price
Supply Mechanism
- Inventory Management: Current real estate inventory levels serve as a critical determinant of future price trends. Inventory management plays a pivotal role in market dynamics.
- Historical Pattern: Past supply fluctuations have notably influenced housing prices, with tight inventory conditions typically driving price increases.
- Current Impact: The relationship between supply constraints and market demand continues to shape price expectations in the evolving real estate landscape.
Macro-Economic Environment
- Monetary Policy Impact: Interest rate levels and monetary policy adjustments influence purchasing power and investment decisions. Government bodies can indirectly affect price movements through macro-level interest rate controls.
- Inflation Considerations: Economic conditions, interest rates, and inflation rates collectively impact buyer purchasing capacity and investment appetite. During periods of economic prosperity, rising income levels tend to increase housing demand alongside relatively accommodative banking credit policies.
- Geopolitical Factors: Domestic and international economic trends, capital market movements, investment channel accessibility, urbanization processes, and real estate market maturity all contribute to the broader economic environment affecting prices.
Demand Dynamics and Demographic Factors
- Population Growth: Population expansion represents a fundamental driver of housing demand. Migration flows and new population influx increase housing needs, potentially supporting price appreciation.
- Geographic Location: Location factors and regional market trends significantly influence property valuation and price trajectories.
- Market Sentiment: Buyer attention levels and transaction timing patterns demonstrate measurable correlation with price movements, alongside community average prices and property characteristics.
III. 2026-2031 HOUSE Price Prediction
2026 Outlook
- Conservative prediction: $0.00043 - $0.00077
- Neutral prediction: around $0.00077
- Optimistic prediction: approaching $0.00096 (requires favorable market conditions)
2027-2029 Outlook
- Market stage expectation: The token is anticipated to enter a gradual growth phase, with price volatility potentially moderating as market participation evolves
- Price range prediction:
- 2027: $0.00064 - $0.00093, with an estimated 12% increase
- 2028: $0.00047 - $0.00103, with an estimated 16% increase
- 2029: $0.00094 - $0.00126, with an estimated 25% increase
- Key catalysts: Progressive market adoption, potential ecosystem development, and broader cryptocurrency market trends may serve as primary drivers
2030-2031 Long-term Outlook
- Baseline scenario: $0.00107 - $0.00133 (assuming steady market development and sustained interest)
- Optimistic scenario: $0.00095 - $0.00166 by 2031 (contingent upon significant ecosystem expansion and favorable regulatory environment)
- Transformative scenario: potentially exceeding $0.00166 (under exceptionally favorable conditions including widespread adoption and major partnerships)
- 2026-02-04: HOUSE trading within the projected range of $0.00043 - $0.00096 (establishing baseline for multi-year growth trajectory)
| Year |
Predicted High Price |
Predicted Average Price |
Predicted Low Price |
Price Change |
| 2026 |
0.00096 |
0.00077 |
0.00043 |
0 |
| 2027 |
0.00093 |
0.00087 |
0.00064 |
12 |
| 2028 |
0.00103 |
0.0009 |
0.00047 |
16 |
| 2029 |
0.00126 |
0.00097 |
0.00094 |
25 |
| 2030 |
0.00133 |
0.00111 |
0.00107 |
44 |
| 2031 |
0.00166 |
0.00122 |
0.00095 |
58 |
IV. HOUSE Professional Investment Strategy and Risk Management
HOUSE Investment Methodology
(1) Long-term Holding Strategy
- Suitable for: Risk-tolerant investors interested in meme token themes with speculative appetite
- Operational Recommendations:
- Monitor real estate market trends and related narratives that may impact HOUSE sentiment
- Consider dollar-cost averaging to mitigate entry timing risks given high volatility
- Storage Solution: Use Gate Web3 Wallet for secure self-custody with backup of recovery phrases in multiple secure locations
(2) Active Trading Strategy
- Technical Analysis Tools:
- Volume Analysis: Monitor the 24-hour trading volume ($17,667) relative to market cap to identify liquidity conditions
- Support/Resistance Levels: Track the 24-hour range ($0.0007601 - $0.0008463) to identify potential entry and exit zones
- Key Points for Swing Trading:
- Set stop-loss orders below recent lows to manage downside risk in volatile meme token movements
- Take partial profits during upward momentum given the -34.16% weekly decline trend
HOUSE Risk Management Framework
(1) Asset Allocation Principles
- Conservative Investors: 0.5-1% allocation as speculative position only
- Aggressive Investors: 2-5% allocation with strict loss limits
- Professional Investors: Position sizing based on portfolio volatility targets and risk models
(2) Risk Hedging Solutions
- Diversification: Spread meme token exposure across multiple projects rather than concentrating in single assets
- Position Limits: Set maximum loss thresholds per position to prevent overexposure to single-token risk
(3) Secure Storage Solutions
- Non-Custodial Wallet Recommendation: Gate Web3 Wallet for full control of private keys and Solana-based token support
- Multi-Signature Option: Consider multi-sig solutions for larger holdings to enhance security
- Security Precautions: Never share private keys or recovery phrases; verify all contract addresses before transactions; be vigilant against phishing attempts targeting meme token communities
V. HOUSE Potential Risks and Challenges
HOUSE Market Risks
- Extreme Volatility: HOUSE has declined -64.23% over 30 days and -34.16% over 7 days, demonstrating significant price instability typical of meme tokens
- Low Liquidity: With a market cap of approximately $768,746 and 24-hour volume of $17,667, the token faces potential slippage and difficulty executing large trades
- Meme Token Dependency: Value proposition relies heavily on community sentiment and social media trends rather than fundamental utility, making it susceptible to rapid sentiment shifts
HOUSE Regulatory Risks
- Regulatory Uncertainty: Meme tokens may face increased scrutiny from financial regulators seeking to classify and potentially restrict speculative digital assets
- Compliance Evolution: Changes in cryptocurrency regulations across jurisdictions could impact trading availability and market access
- Platform Risk: Dependence on exchanges and platforms that may adjust listing policies for highly speculative assets
HOUSE Technical Risks
- Smart Contract Risk: As a Solana-based token, HOUSE is subject to potential vulnerabilities in its contract code or deployment
- Network Dependencies: Reliance on Solana blockchain performance, including potential network congestion or downtime affecting transactions
- Limited Historical Data: Token launched in January 2025, providing minimal track record for assessing long-term technical stability
VI. Conclusion and Action Recommendations
HOUSE Investment Value Assessment
HOUSECOIN presents as a speculative meme token themed around real estate market hedging, with the concept that 1 $HOUSE token represents the value of 1 house. However, the token exhibits characteristics typical of high-risk meme assets: extreme volatility (-64.23% in 30 days), relatively small market capitalization ($768,746), and value driven primarily by community sentiment rather than underlying utility. The token's fully diluted valuation equals its market cap, indicating complete circulation of the 998,760,897 total supply. While the real estate theme offers narrative appeal, investors should recognize this as a purely speculative position with substantial downside risk, as evidenced by the -34.16% weekly decline and proximity to all-time lows.
HOUSE Investment Recommendations
✅ Beginners: Avoid or allocate only minimal "learning capital" (under 1% of crypto portfolio) to understand meme token dynamics; prioritize education over profit expectations
✅ Experienced Investors: Consider small speculative positions (1-3%) only if comfortable with potential total loss; implement strict stop-losses and monitor community sentiment indicators
✅ Institutional Investors: Generally unsuitable for institutional portfolios due to liquidity constraints, regulatory ambiguity, and lack of fundamental value drivers; if pursuing research exposure, limit to negligible allocation
HOUSE Trading Participation Methods
- Spot Trading on Gate.com: Direct purchase and sale of HOUSE tokens with transparent pricing and access to liquidity
- Gate Web3 Wallet: Self-custody solution for storing HOUSE tokens securely while maintaining full control of private keys
- Community Monitoring: Track social media channels and holder count (22,148) for sentiment shifts that may precede price movements
Cryptocurrency investment carries extremely high risks, and this article does not constitute investment advice. Investors should make cautious decisions based on their own risk tolerance and are advised to consult professional financial advisors. Never invest more than you can afford to lose.
FAQ
What are the main methods for house price prediction?
Main methods include economic indicator analysis, machine learning models, and GIS applications. These combine historical data, market factors, and geographic features to forecast price trends accurately.
Which factors influence house price trends?
House price trends are influenced by supply and demand dynamics, mortgage interest rates, economic growth, employment levels, population migration patterns, construction costs, local policy changes, and market sentiment. Token trading volume and blockchain activity also reflect market interest in this prediction asset.
How to use house price prediction data for investment decisions?
Analyze predicted price trends to identify high-potential areas for investment. Advanced prediction models provide accurate forecasts, enabling informed decisions on timing and location selection for optimal returns.
How is the accuracy of the house price prediction model evaluated?
Our model uses R-squared, Mean Absolute Error (MAE), and Root Mean Square Error (RMSE) metrics to evaluate prediction accuracy. We continuously validate against historical housing transaction data to ensure reliable forecasting performance.
What is the importance of historical data for house price prediction?
Historical data is crucial for building accurate prediction models. It reveals market trends, price patterns, and economic cycles that help identify future movements. Machine learning algorithms analyze past data to recognize correlations and forecast house prices more precisely, improving investment decision-making.
What are the differences in house price predictions across different regions?
Regional price prediction differences stem from economic development levels, population density, and geographic location. Developed areas typically show higher price growth, while remote regions experience slower appreciation. Local market dynamics and infrastructure development significantly impact prediction variance across regions.
* The information is not intended to be and does not constitute financial advice or any other recommendation of any sort offered or endorsed by Gate.