This comprehensive guide analyzes LightLink (LL) price predictions from 2026 through 2031, combining historical market data, ecosystem development, and macroeconomic factors. As an Ethereum Layer 2 solution currently trading at $0.003754 with a $1.57M market cap, LL presents specialized enterprise adoption value. The article projects conservative 2026 pricing of $0.00316-$0.00376, with mid-term forecasts suggesting 21-71% cumulative growth by 2029, and long-term potential reaching $0.00789 by 2031 under favorable conditions. Key sections cover LL's market sentiment (extreme fear index at 14), concentrated token holdings (top 2 addresses control 66.55%), and technical risks including limited liquidity and regulatory uncertainty. Professional investment strategies encompass long-term holding and active trading approaches, with risk management frameworks for conservative to institutional investors. Essential considerations include market volatility, Layer 2 competition, and enterprise adoption barriers, making t
Introduction: LL's Market Position and Investment Value
LightLink (LL), positioned as an Ethereum Layer 2 blockchain solution providing instant and gasless transactions for dApps and enterprise users, has been developing blockchain solutions since 2017. As of 2026, LL has a market capitalization of approximately $1.57 million, with a circulating supply of around 417.88 million tokens, and its price is maintained at approximately $0.003754. This asset, designed to bridge dApps with millions of users from enterprise partners, is playing an increasingly important role in fostering an interconnected blockchain economy.
This article will comprehensively analyze LL's price trends from 2026 to 2031, combining historical patterns, market supply and demand dynamics, ecosystem development, and macroeconomic environment factors to provide investors with professional price predictions and practical investment strategies.
I. LL Price History Review and Current Market Situation
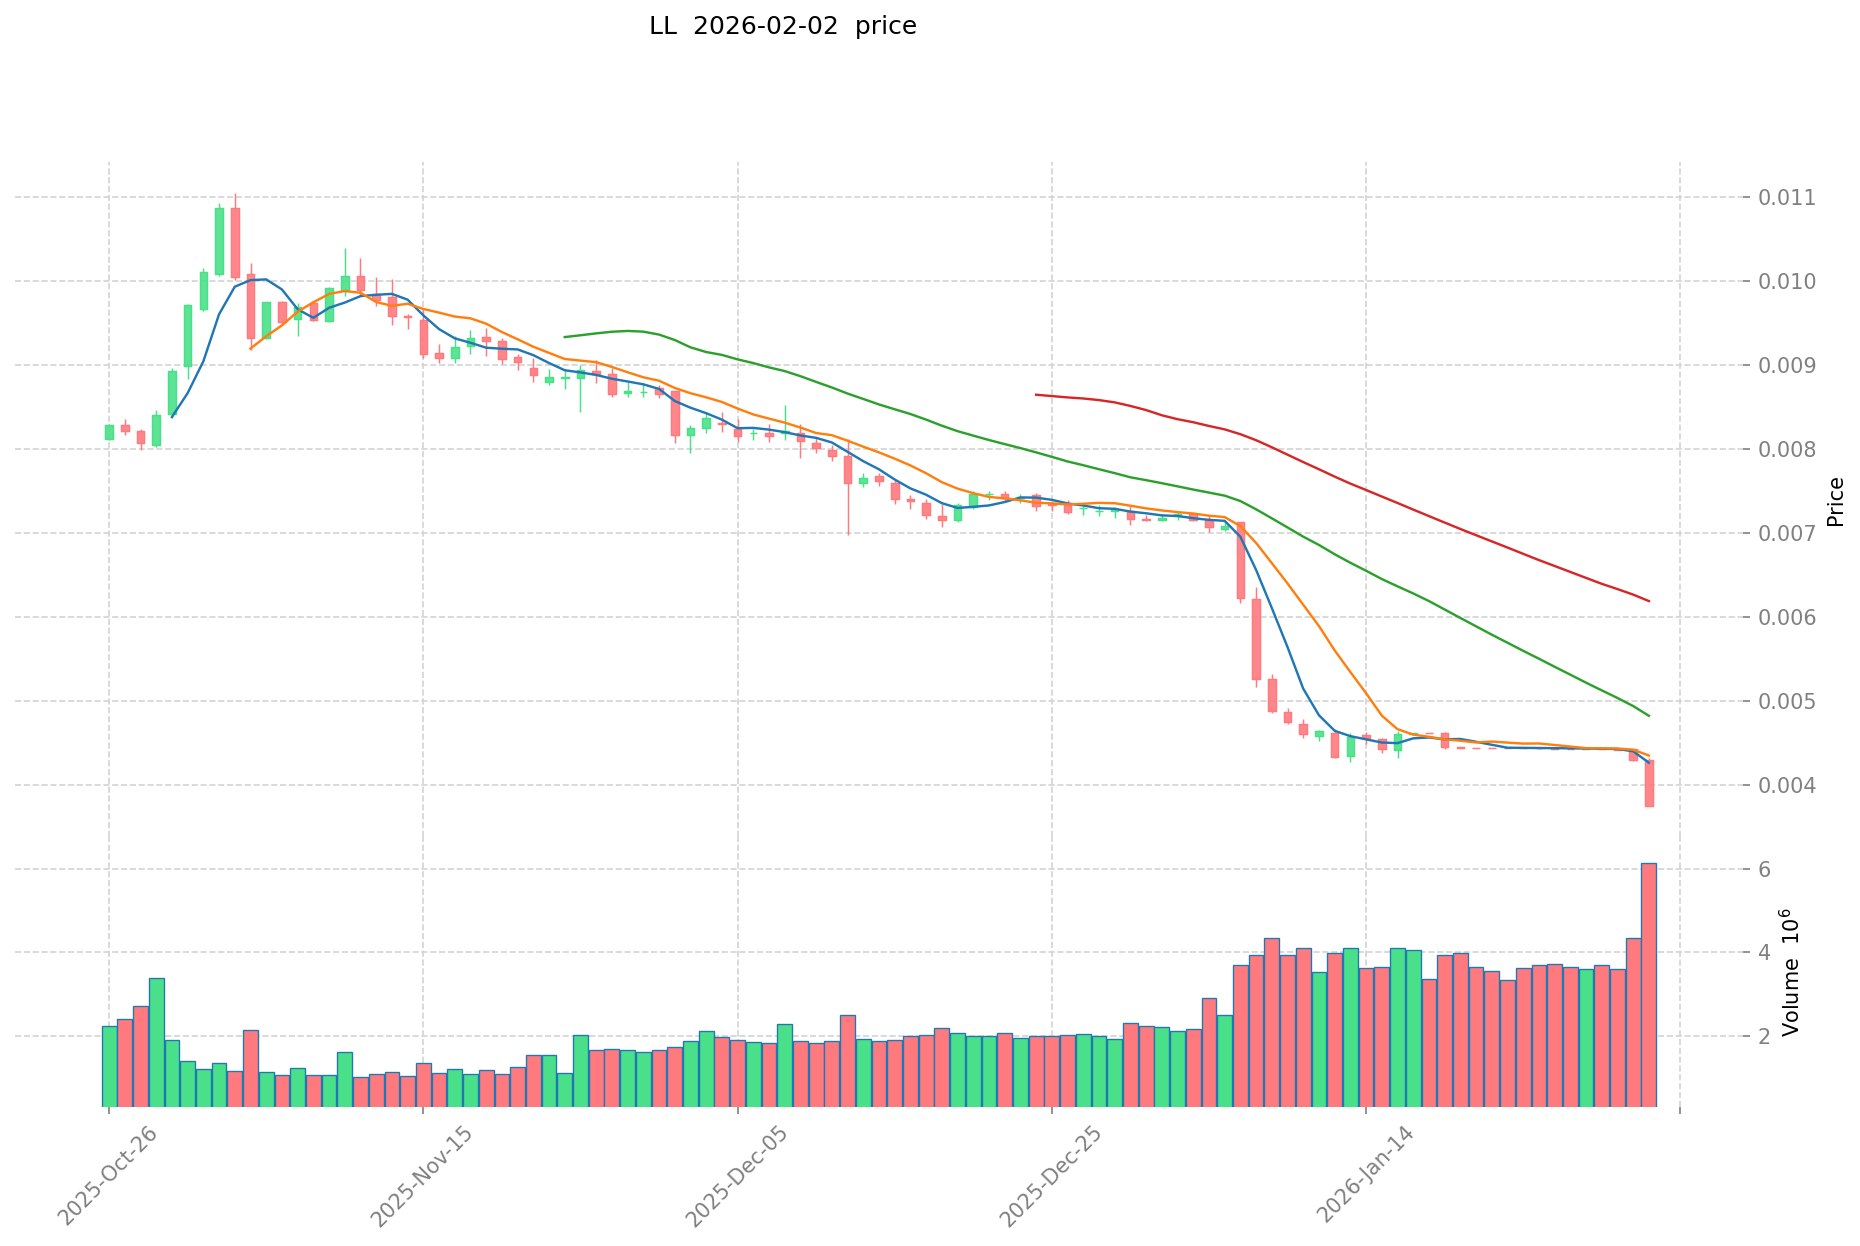
LL Historical Price Evolution Trajectory
- 2024: The project launched on Gate.com on April 24, with a publish price of $0.3, which also marked its historical peak during this period
- 2024-2025: The token experienced significant downward pressure, declining from its launch price
- 2026: On February 1, LL reached its historical low of $0.00375, representing a substantial decline from its initial valuation
LL Current Market Status
As of February 2, 2026, LightLink (LL) is trading at $0.003754, showing marginal recovery from its recent historical low. The token has experienced notable volatility across different timeframes, with a 1-hour change of +0.011%, while facing downward pressure over longer periods including a 24-hour decline of -12.65%, 7-day decline of -15.40%, and 30-day decline of -48.06%.
The market capitalization stands at approximately $1.57 million, with a circulating supply of 417.88 million LL tokens, representing 41.79% of the maximum supply of 1 billion tokens. The 24-hour trading volume is recorded at $23,265.41, reflecting relatively limited market activity. The fully diluted market cap is positioned at $3.75 million.
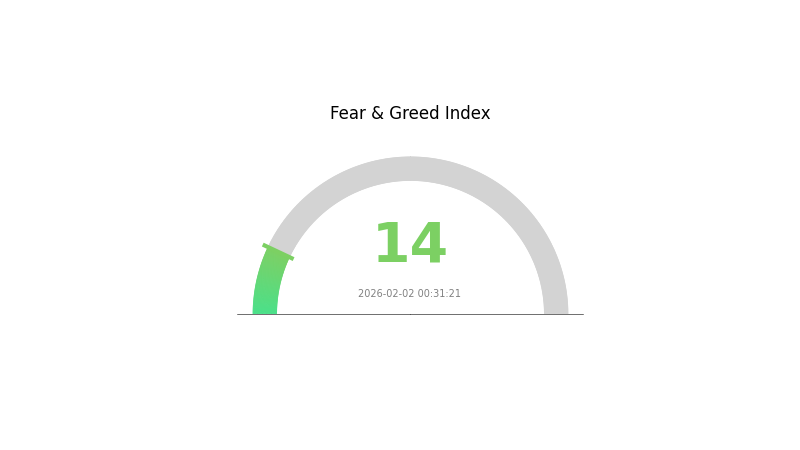
LL maintains a market dominance of 0.00013% and ranks #2202 in the cryptocurrency market. The token's intraday trading range spans from $0.00375 to $0.004299, indicating continued price volatility. The current market sentiment indicator shows a fear index of 14, characterized as "Extreme Fear," which reflects broader market caution. The token is held by approximately 4,937 addresses and is listed on 2 exchanges.
Click to view current LL market price
LL Market Sentiment Index
2026-02-02 Fear and Greed Index: 14 (Extreme Fear)
Click to view current Fear & Greed Index
The crypto market is currently experiencing extreme fear, with the Fear and Greed Index at 14. This historically low reading suggests investors are highly pessimistic, presenting potential opportunities for contrarian traders. Market volatility remains elevated as selling pressure dominates. Such extreme sentiment levels often precede market reversals, making this period worth monitoring for experienced investors seeking entry points during market downturns.
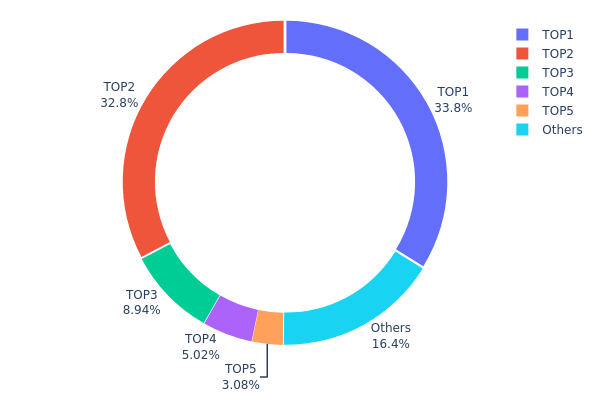
LL Holding Distribution
The holding distribution chart illustrates the concentration of LL tokens across different wallet addresses, revealing the degree of decentralization and potential market control risks within the token's ecosystem. By analyzing the proportion of tokens held by top addresses versus smaller holders, this metric provides crucial insights into the token's ownership structure and its implications for market dynamics.
According to the current data, LL exhibits a highly concentrated holding pattern. The top two addresses collectively control 66.55% of the total token supply, with the largest holder possessing 33.79% (337,964.36K tokens) and the second-largest holding 32.76% (327,601.76K tokens). The top five addresses combined account for 83.58% of the circulating supply, leaving only 16.42% distributed among all other holders. This extreme concentration significantly deviates from the ideal decentralized structure typically desired in cryptocurrency projects.
Such a concentrated holding structure presents notable concerns for market stability and price manipulation risks. The dominance of the top two addresses creates potential single-point vulnerabilities, where large-scale sell-offs from either holder could trigger substantial price volatility. Additionally, this concentration level may deter institutional investors and retail participants who prioritize decentralization and reduced manipulation risks. However, it's worth noting that some of these large addresses may belong to the project treasury, locked staking contracts, or centralized exchange cold wallets, which could mitigate immediate selling pressure if these tokens remain functionally locked or serve operational purposes within the ecosystem.
Click to view the current LL Holding Distribution
| Top |
Address |
Holding Qty |
Holding (%) |
| 1 |
0x6310...121ee9 |
337964.36K |
33.79% |
| 2 |
0x8c6e...80ca8e |
327601.76K |
32.76% |
| 3 |
0x2da1...82872e |
89403.72K |
8.94% |
| 4 |
0xf89d...5eaa40 |
50197.53K |
5.01% |
| 5 |
0x58ed...a36a51 |
30824.18K |
3.08% |
| - |
Others |
164008.45K |
16.42% |
II. Core Factors Influencing LL's Future Price
Macroeconomic Environment
-
Monetary Policy Impact: Central bank policies, particularly from the Federal Reserve, play a crucial role in shaping market conditions. Interest rate adjustments and quantitative easing measures directly affect investment flows into risk assets. As of early 2026, the trajectory of monetary policy normalization continues to influence capital allocation decisions across traditional and digital asset markets.
-
Inflation Dynamics: Global inflation patterns remain a key consideration for asset valuations. The relationship between inflation expectations and asset performance has shown increased complexity, with multiple variables including supply chain dynamics, commodity prices, and labor market conditions contributing to overall price stability considerations.
-
Geopolitical Factors: International trade relationships, regulatory developments across different jurisdictions, and global economic coordination efforts create an evolving landscape. Cross-border policy decisions and international cooperation on financial regulations may affect market sentiment and capital flows.
Market Demand and Competition
-
Institutional Interest: The participation level of institutional investors continues to evolve, with various factors influencing allocation decisions including risk management frameworks, regulatory clarity, and portfolio diversification strategies.
-
Market Competition: Technological innovation and competitive dynamics within the digital asset space create ongoing pressure for projects to demonstrate utility and value proposition. The pace of technological advancement influences relative positioning among different platforms and solutions.
-
Global Economic Conditions: Overall economic growth patterns, employment trends, and consumer confidence levels contribute to broader market sentiment. Regional economic performance variations may create diverse demand patterns across different markets.
III. 2026-2031 LL Price Prediction
2026 Outlook
- Conservative Forecast: $0.00316 - $0.00376
- Neutral Forecast: Around $0.00376
- Optimistic Forecast: Up to $0.00537 (requires favorable market conditions and ecosystem development)
Based on current market analysis, LL is expected to maintain relatively stable price movements in 2026, with the average price hovering around $0.00376. The token may experience price fluctuations between $0.00316 and $0.00537, depending on overall crypto market sentiment and project-specific developments.
2027-2029 Mid-term Outlook
- Market Stage Expectation: Gradual growth phase with increasing adoption and ecosystem expansion
- Price Range Predictions:
- 2027: $0.00265 - $0.0063 (average $0.00456, approximately 21% increase from 2026)
- 2028: $0.00407 - $0.00744 (average $0.00543, approximately 44% cumulative increase)
- 2029: $0.00373 - $0.00766 (average $0.00644, approximately 71% cumulative increase)
- Key Catalysts: Technology upgrades, partnership announcements, broader market recovery cycles, and increased user adoption could serve as primary drivers for price appreciation during this period.
The mid-term forecast suggests a progressive upward trajectory, with LL potentially benefiting from the broader cryptocurrency market's cyclical patterns and internal project milestones.
2030-2031 Long-term Outlook
- Base Scenario: $0.00655 - $0.00874 (assuming steady ecosystem growth and market stability)
- Optimistic Scenario: $0.00758 - $0.01168 (contingent on significant technological breakthroughs and mass adoption)
- Transformational Scenario: Prices may exceed $0.01168 (under exceptionally favorable conditions including major institutional adoption and regulatory clarity)
By 2031, LL could potentially reach an average price of $0.00789, representing approximately 110% growth compared to 2026 baseline. This long-term projection assumes continued project development, sustained community engagement, and favorable regulatory environments across major markets. However, investors should note that cryptocurrency markets remain highly volatile, and actual performance may vary significantly from these projections based on numerous unpredictable factors.
| Year |
Predicted High Price |
Predicted Average Price |
Predicted Low Price |
Price Change |
| 2026 |
0.00537 |
0.00376 |
0.00316 |
0 |
| 2027 |
0.0063 |
0.00456 |
0.00265 |
21 |
| 2028 |
0.00744 |
0.00543 |
0.00407 |
44 |
| 2029 |
0.00766 |
0.00644 |
0.00373 |
71 |
| 2030 |
0.00874 |
0.00705 |
0.00655 |
87 |
| 2031 |
0.01168 |
0.00789 |
0.00758 |
110 |
IV. LL Professional Investment Strategies and Risk Management
LL Investment Methodology
(I) Long-term Holding Strategy
- Suitable for: Investors seeking exposure to Ethereum Layer 2 infrastructure with a focus on enterprise adoption
- Operational Recommendations:
- Consider accumulating positions during market downturns, particularly when the token trades near historical support levels
- Monitor LightLink's enterprise partnership announcements and adoption metrics as potential value drivers
- Implement secure storage solutions using non-custodial wallets such as Gate Web3 Wallet for enhanced security
(II) Active Trading Strategy
- Technical Analysis Tools:
- Moving Averages: Utilize 50-day and 200-day moving averages to identify potential trend reversals and entry points
- Volume Analysis: Monitor the 24-hour trading volume ($23,265.41) relative to historical averages to gauge market interest
- Swing Trading Considerations:
- Given the 24-hour high of $0.004299 and low of $0.00375, traders may identify intraday volatility opportunities
- Set stop-loss orders to manage downside risk, particularly given recent price declines across multiple timeframes
LL Risk Management Framework
(I) Asset Allocation Principles
- Conservative Investors: 1-3% of crypto portfolio allocation
- Aggressive Investors: 3-7% of crypto portfolio allocation
- Professional Investors: Up to 10% with appropriate hedging strategies
(II) Risk Hedging Solutions
- Portfolio Diversification: Combine LL holdings with established Layer 1 assets and stablecoins to reduce overall portfolio volatility
- Position Sizing: Scale positions based on market capitalization ($1.57M) and liquidity considerations
(III) Secure Storage Solutions
- Hot Wallet Recommendation: Gate Web3 Wallet for active trading and convenient access to DeFi applications
- Cold Storage Option: Hardware wallet solutions for long-term holdings exceeding personal risk thresholds
- Security Considerations: Always verify contract addresses (0x0921799cb1d702148131024d18fcde022129dc73 on Ethereum), enable two-factor authentication, and never share private keys
V. LL Potential Risks and Challenges
LL Market Risks
- High Volatility: The token has experienced a 48.06% decline over 30 days and 85.66% decline over one year, indicating substantial price volatility
- Limited Liquidity: With a market cap of approximately $1.57M and trading volume of $23,265.41, liquidity constraints may impact large order execution
- Market Cap Concentration: The circulating supply represents 41.79% of total supply, with potential dilution concerns as additional tokens enter circulation
LL Regulatory Risks
- Layer 2 Regulatory Uncertainty: Evolving regulatory frameworks for Layer 2 solutions may impact operational requirements and compliance costs
- Enterprise Adoption Barriers: Regulatory clarity requirements from enterprise partners may affect adoption timelines
- Cross-border Compliance: Enterprise-focused solutions may face varying regulatory requirements across different jurisdictions
LL Technical Risks
- Smart Contract Vulnerabilities: As an ERC-20 token on Ethereum, exposure to potential smart contract exploits or security vulnerabilities
- Layer 2 Dependency: Technical performance relies on the stability and security of the underlying Ethereum network
- Competition from Established Layer 2s: Intense competition from well-funded Layer 2 solutions may impact market share and adoption rates
VI. Conclusion and Action Recommendations
LL Investment Value Assessment
LightLink presents a specialized value proposition as an Ethereum Layer 2 solution targeting enterprise adoption and gasless transactions. The project's focus on bridging dApps with enterprise users addresses a specific market need. However, the token has experienced significant price declines across all measured timeframes, with limited liquidity and a relatively small market capitalization. Long-term value depends heavily on successful enterprise partnership execution and ecosystem growth, while short-term risks include continued price volatility and market sentiment challenges.
LL Investment Recommendations
✅ Beginners: Consider small allocation positions only after thorough research, focusing on understanding Layer 2 technology and monitoring project development milestones
✅ Experienced Investors: May consider strategic accumulation during favorable risk-reward scenarios, with strict position sizing and stop-loss disciplines
✅ Institutional Investors: Conduct comprehensive due diligence on enterprise partnership pipeline and technical infrastructure before considering allocation
LL Trading Participation Methods
- Spot Trading: Available on Gate.com with LL/USDT trading pairs for direct token acquisition
- Dollar-Cost Averaging: Systematic periodic purchases to mitigate timing risk in volatile market conditions
- Portfolio Rebalancing: Periodic adjustments to maintain target allocation percentages as market conditions evolve
Cryptocurrency investments carry extreme risk, and this article does not constitute investment advice. Investors should make prudent decisions based on their own risk tolerance and are advised to consult professional financial advisors. Never invest more than you can afford to lose.
FAQ
What factors influence LL price predictions?
LL price predictions are influenced by market supply and demand, trading volume, market sentiment, regulatory developments, and macroeconomic trends. Historical price data, project fundamentals, and broader crypto market conditions also significantly impact price forecasts.
How can I analyze LL price trends and make accurate predictions?
Analyze LL price trends by examining historical price data, identifying chart patterns, and monitoring trading volume changes. Use technical indicators like moving averages and RSI. Apply statistical models and regression analysis to validate patterns for more accurate price predictions.
What are the risks and limitations of LL price forecasting?
LL price forecasting relies on historical data and market analysis, but faces limitations from market volatility, sudden regulatory changes, and unpredictable trading volume fluctuations. Forecasts cannot account for all variables affecting crypto markets.
What historical price data and patterns should I consider for LL predictions?
Analyze long-term and short-term price movements using moving averages and seasonal patterns. Study historical trends, cycles, and trading volume fluctuations to identify key resistance and support levels for accurate LL price predictions.
MACD, RSI, and Bollinger Bands are most reliable for LL price analysis. These indicators effectively track momentum, overbought/oversold levels, and volatility. Combined with trading volume analysis, they provide comprehensive price movement insights.
* The information is not intended to be and does not constitute financial advice or any other recommendation of any sort offered or endorsed by Gate.