This comprehensive analysis examines Lnfi Network (LN) price trajectory and investment outlook from 2026 to 2031, providing professional forecasts for this Bitcoin Layer 2 DeFi infrastructure token. The article reviews LN's market position, current trading at $0.008141 with significant volatility patterns, and identifies core price drivers including global GDP correlation, macroeconomic conditions, and ecosystem development. Detailed price predictions range from $0.00594-$0.0105 in 2026 to $0.01368-$0.02041 by 2031, supported by technical and fundamental analysis. The guide addresses institutional and retail investment strategies on Gate, risk management frameworks, and critical challenges including liquidity constraints and regulatory uncertainties. Investors will gain actionable insights for position sizing, trading methodology, and portfolio allocation while understanding both opportunities and risks in this early-stage cryptocurrency project.
Introduction: LN's Market Position and Investment Value
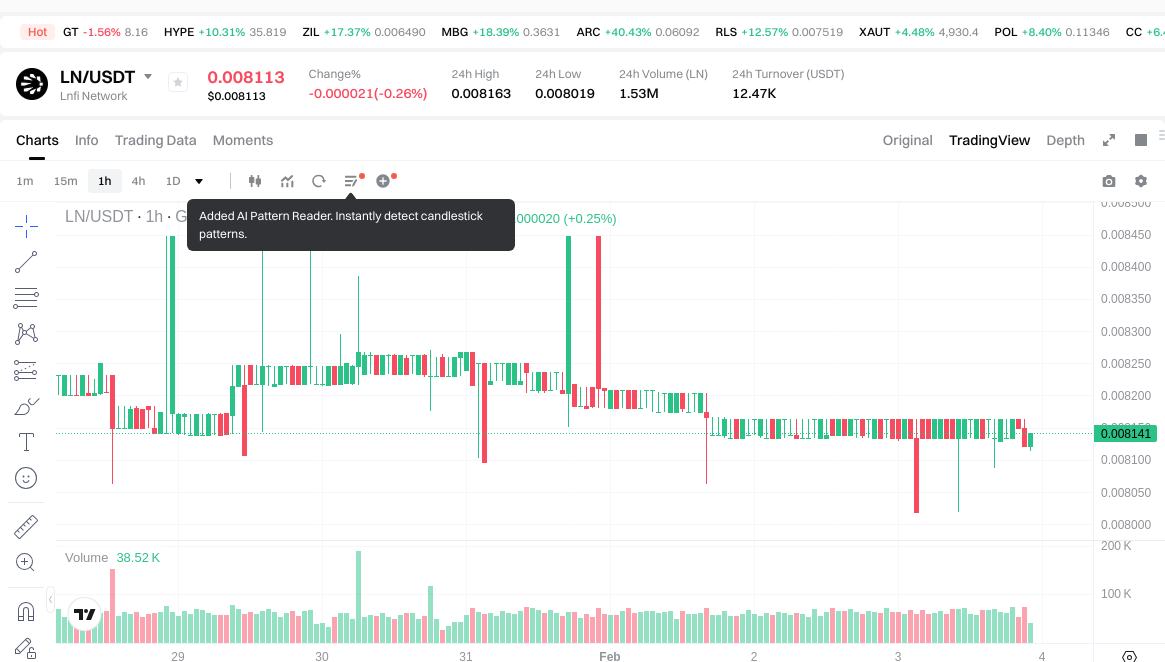
Lnfi Network (LN), positioned as a next-generation financial infrastructure that unlocks multi-asset DeFi capabilities on the Lightning Network, has been facilitating Bitcoin, Taproot Assets, and RGB asset trading and management since its launch in 2025. As of 2026, LN maintains a market capitalization of approximately $962,673, with a circulating supply of around 118.25 million tokens, and a price hovering around $0.008141. This asset, operating within the Lightning Network ecosystem, is playing an increasingly important role in enabling decentralized financial services for Bitcoin Layer 2 solutions.
This article will comprehensively analyze LN's price trajectory from 2026 to 2031, combining historical patterns, market supply and demand dynamics, ecosystem development, and macroeconomic conditions to provide investors with professional price forecasts and practical investment strategies.
I. LN Price History Review and Market Status
LN Historical Price Evolution Trajectory
- 2025: Lnfi Network (LN) launched on January 23, 2025, with an initial offering price of $0.05. The token experienced significant volatility in its early months, reaching a peak of $0.043 on July 25, 2025.
- 2026: The token entered a bearish phase, declining from previous levels. On January 23, 2026, LN recorded its all-time low of $0.008014, marking a substantial correction from its historical high.
LN Current Market Status
As of February 3, 2026, Lnfi Network (LN) is trading at $0.008141, representing a marginal increase of 1.58% from its all-time low. The token has experienced notable price movements across different timeframes:
Short-term Performance:
- 1-hour change: -0.11% (down $0.000008964961)
- 24-hour change: -0.61% (down $0.000049964886)
- 24-hour high: $0.008163
- 24-hour low: $0.008019
Medium to Long-term Trends:
- 7-day change: -1.43% (down $0.000118105204)
- 30-day change: -12.79% (down $0.001193938654)
- 1-year change: -88.11% (down $0.060328301934)
The current trading price represents an 81.07% decline from the all-time high of $0.043 recorded on July 25, 2025. The 24-hour trading volume stands at $12,484.20, with the token being listed on 4 exchanges.
Market Metrics:
- Market capitalization: $962,673.25
- Circulating supply: 118,250,000 LN (11.82% of total supply)
- Total supply: 1,000,000,000 LN
- Maximum supply: 1,000,000,000 LN
- Fully diluted market cap: $8,141,000
- Market cap to FDV ratio: 11.82%
- Market dominance: 0.00029%
- Current holder count: 1,152 addresses
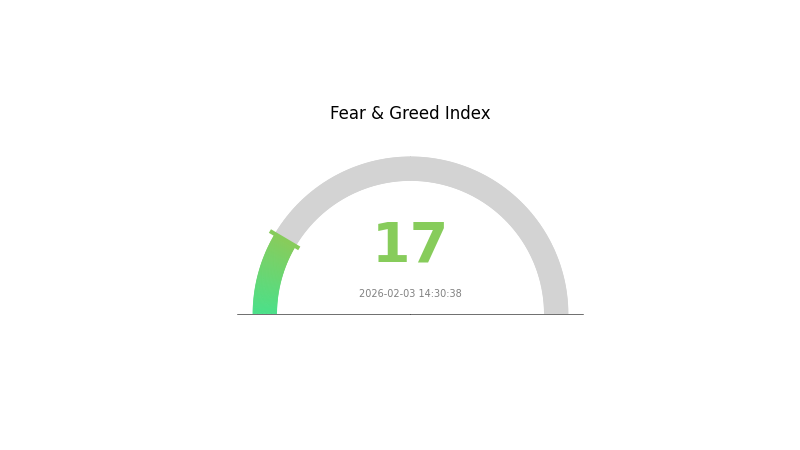
The crypto market sentiment index currently reflects a value of 17, indicating "Extreme Fear" conditions, which may be influencing LN's recent price performance alongside broader market dynamics.
Click to view current LN market price
LN Market Sentiment Indicator
2026-02-03 Fear and Greed Index: 17 (Extreme Fear)
Click to view the current Fear & Greed Index
The crypto market is currently experiencing extreme fear with an index reading of 17. This exceptionally low sentiment suggests investors are highly pessimistic about market conditions. During such periods, panic selling often intensifies, creating significant downward pressure on asset prices. However, extreme fear can also present contrarian opportunities for risk-tolerant investors who believe the market is oversold. Traders should exercise caution and consider their risk tolerance carefully before making investment decisions in this volatile environment.
LN Holding Distribution
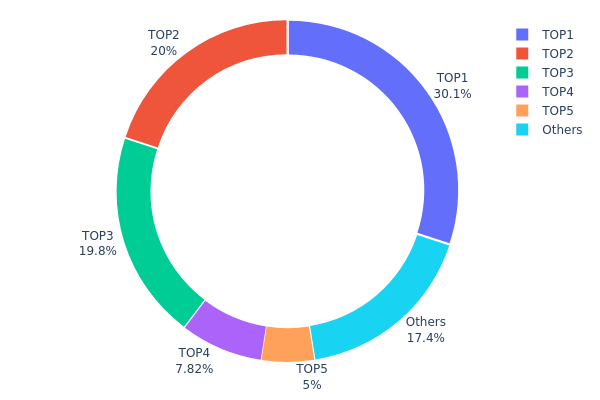
The holding distribution chart reveals the concentration level of token ownership across different wallet addresses, serving as a key indicator of decentralization and potential market manipulation risks. According to the latest on-chain data, LN demonstrates a notably concentrated holding structure. The top address holds 45,147.64K tokens, representing 30.09% of the total supply, while the second and third largest addresses control 19.96% and 19.76% respectively. Combined, the top three addresses account for nearly 70% of the circulating supply, indicating significant centralization.
This concentration pattern presents both opportunities and risks for market participants. The dominance of major holders suggests that price movements could be heavily influenced by the actions of a limited number of entities. Large-scale sell-offs from any top addresses could trigger substantial volatility, while coordinated accumulation might lead to rapid price appreciation. The relatively small portion held by "Others" at 17.39% further underscores the limited distribution among retail investors and smaller holders.
From a market structure perspective, such concentration levels raise concerns about the project's decentralization ethos and long-term sustainability. While concentrated holdings may provide stability during early development stages, they also create vulnerability to coordinated market manipulation and reduce the token's resilience against sudden liquidity shocks. Investors should monitor whale wallet activities closely, as movements from top addresses could serve as leading indicators for potential price trends.
Click to view current LN Holding Distribution
| Top |
Address |
Holding Qty |
Holding (%) |
| 1 |
0x59a8...a8471e |
45147.64K |
30.09% |
| 2 |
0x8c86...57cacf |
29940.00K |
19.96% |
| 3 |
0x68e6...8f5985 |
29640.08K |
19.76% |
| 4 |
0xd926...0daaed |
11724.28K |
7.81% |
| 5 |
0x0d07...b492fe |
7497.78K |
4.99% |
| - |
Others |
26050.21K |
17.39% |
II. Core Factors Influencing LN's Future Price
Supply Mechanism
- GDP-Linked Valuation Model: Research indicates that global GDP explains approximately 93% of LN's market capitalization variation, with logarithmic regression showing strong correlation between ln(global GDP) and ln(LN market value). This statistical relationship suggests LN's value closely tracks global economic expansion.
- Historical Pattern: Historical data demonstrates that periods of high global GDP growth have corresponded with increased demand for LN, supporting price appreciation. The remaining 7% of valuation variation stems from other influencing factors including market sentiment and technical developments.
- Current Impact: As global economic conditions evolve, with major economies implementing various monetary policies, the GDP-supply relationship continues to serve as a fundamental anchor for LN's valuation framework.
Institutional and Major Holder Dynamics
- Central Bank Activity: Central bank policies represent a significant factor in LN's price trajectory. Interest rate adjustments and quantitative measures directly influence investor appetite for alternative assets. Policy shifts by major central banks create ripple effects across LN markets.
- Economic Reform Influence: Structural economic reforms in key markets affect LN's adoption trajectory and institutional interest. Regulatory clarity and policy frameworks shape the environment for institutional participation.
- Market Positioning: As institutional awareness grows, LN's position within diversified portfolios continues to evolve, with sophisticated investors analyzing its correlation patterns with traditional assets.
Macroeconomic Environment
- Monetary Policy Impact: Central bank decisions regarding interest rates and liquidity conditions create direct implications for LN markets. Accommodative policies may enhance appeal for alternative assets, while tightening cycles can shift capital allocation patterns.
- Economic Growth Correlation: The strong statistical relationship between global economic output and LN valuation suggests macroeconomic health serves as a primary driver. GDP growth trajectories across major economies warrant close monitoring.
- Market Sentiment Factors: Beyond quantitative metrics, investor sentiment regarding economic stability and growth prospects influences capital flows into LN markets. Confidence indicators and expectations play meaningful roles.
Technical Development and Ecosystem Building
- Analytical Framework Evolution: Advanced statistical models and machine learning approaches are increasingly applied to LN analysis, enhancing risk assessment capabilities. Random forest models and multi-dimensional feature analysis improve prediction accuracy.
- Data Infrastructure: Development of comprehensive data collection and analysis systems supports more sophisticated market understanding. Integration of financial indicators, market characteristics, and macroeconomic variables enables nuanced evaluation.
- Research Applications: Academic and industry research continues expanding, with studies examining LN's relationship to inflation dynamics, monetary policy transmission mechanisms, and broader financial market structures. These analytical advances contribute to more informed market participation.
III. 2026-2031 LN Price Prediction
2026 Outlook
- Conservative Prediction: $0.00594 - $0.00814
- Neutral Prediction: Around $0.00814
- Optimistic Prediction: Up to $0.0105 (requires favorable market conditions and increased adoption)
2027-2029 Mid-term Outlook
- Market Phase Expectation: Gradual growth phase with increasing market recognition and potential ecosystem expansion
- Price Range Predictions:
- 2027: $0.00662 - $0.01063 (projected 14% average increase)
- 2028: $0.00678 - $0.01476 (projected 22% average increase)
- 2029: $0.00643 - $0.01521 (projected 51% average increase)
- Key Catalysts: Market maturation, potential technological developments, and broader cryptocurrency market trends
2030-2031 Long-term Outlook
- Baseline Scenario: $0.01145 - $0.02041 (assuming steady market growth and sustained interest)
- Optimistic Scenario: $0.01368 - $0.01949 by 2031 (with enhanced adoption and favorable regulatory environment)
- Transformative Scenario: Approaching $0.02041 (under exceptionally favorable conditions including significant partnerships or technological breakthroughs)
- 2026-02-03: LN trading within initial predicted range, establishing foundation for potential multi-year growth trajectory
| Year |
Predicted High Price |
Predicted Average Price |
Predicted Low Price |
Price Change |
| 2026 |
0.0105 |
0.00814 |
0.00594 |
0 |
| 2027 |
0.01063 |
0.00932 |
0.00662 |
14 |
| 2028 |
0.01476 |
0.00997 |
0.00678 |
22 |
| 2029 |
0.01521 |
0.01237 |
0.00643 |
51 |
| 2030 |
0.02041 |
0.01379 |
0.01145 |
69 |
| 2031 |
0.01949 |
0.0171 |
0.01368 |
110 |
IV. LN Professional Investment Strategy and Risk Management
LN Investment Methodology
(1) Long-Term Holding Strategy
- Target Audience: Investors with moderate risk tolerance who believe in Bitcoin Lightning Network infrastructure development
- Operational Recommendations:
- Consider accumulating positions during price corrections below $0.010, given current trading range of $0.008-$0.008163
- Monitor project development milestones related to multi-asset DeFi functionality on Lightning Network
- Storage Solution: Utilize Gate Web3 Wallet for secure self-custody with support for BEP-20 tokens
(2) Active Trading Strategy
- Technical Analysis Tools:
- Volume Analysis: With 24-hour trading volume of $12,484, traders should watch for volume spikes indicating potential breakout opportunities
- Support/Resistance Levels: Current trading range shows support near $0.008014 (recent low) and resistance around $0.043 (previous high)
- Swing Trading Points:
- Monitor 1-hour and 24-hour price movements for entry points during pullbacks
- Consider taking partial profits during upward moves of 5-10% given recent volatility patterns
LN Risk Management Framework
(1) Asset Allocation Principles
- Conservative Investors: 1-2% of crypto portfolio allocation
- Aggressive Investors: 3-5% of crypto portfolio allocation
- Professional Investors: Up to 5-8% based on comprehensive risk assessment
(2) Risk Hedging Solutions
- Portfolio Diversification: Balance LN holdings with established Bitcoin and major altcoin positions
- Position Sizing: Use dollar-cost averaging to manage entry price volatility
(3) Secure Storage Solutions
- Hot Wallet Recommendation: Gate Web3 Wallet provides convenient access for active trading while maintaining security standards
- Cold Storage Solution: Transfer larger holdings to hardware wallet solutions after accumulation
- Security Precautions: Never share private keys, enable two-factor authentication, and verify all contract addresses (0x6d2ebdf6d551d8408e7d896e9a1ec6f84806e193 on BSC)
V. LN Potential Risks and Challenges
LN Market Risks
- High Volatility: Token has experienced -88.11% decline over the past year, demonstrating significant price instability
- Limited Liquidity: With only 4 exchanges listing the token and 24-hour volume of $12,484, liquidity constraints may impact larger trades
- Low Market Cap: Current market capitalization of approximately $962,673 indicates early-stage project with higher risk profile
LN Regulatory Risks
- DeFi Regulatory Uncertainty: Multi-asset DeFi platforms may face evolving regulatory scrutiny across different jurisdictions
- Lightning Network Compliance: Regulatory frameworks for Layer 2 Bitcoin solutions remain under development globally
- Token Classification: Potential regulatory changes regarding utility token classification could impact operations
LN Technical Risks
- Infrastructure Development: Project success depends on successful implementation of multi-asset DeFi functionality on Lightning Network
- Competition: Emerging competition in Bitcoin Layer 2 DeFi space may impact adoption and market share
- Network Dependencies: Relies on Lightning Network stability and Bitcoin ecosystem development
VI. Conclusion and Action Recommendations
LN Investment Value Assessment
Lnfi Network presents an innovative approach to unlocking DeFi functionality on Bitcoin's Lightning Network, targeting a niche market of multi-asset management including Bitcoin, Taproot Assets, and RGB assets. The project's long-term value proposition centers on Bitcoin ecosystem expansion and Lightning Network adoption. However, short-term risks include significant price volatility, limited liquidity with only 11.82% token circulation, and early-stage development challenges. Current market conditions show bearish trends across multiple timeframes, with investors advised to approach with caution.
LN Investment Recommendations
✅ Beginners: Consider waiting for clearer project milestones and increased liquidity before entering positions; start with minimal allocation not exceeding 1% of portfolio
✅ Experienced Investors: May consider strategic accumulation during price weakness below $0.009, maintaining strict risk management with 2-3% maximum portfolio allocation
✅ Institutional Investors: Conduct thorough due diligence on Lightning Network infrastructure development; consider pilot positions while monitoring ecosystem growth metrics
LN Trading Participation Methods
- Spot Trading on Gate.com: Direct purchase and trading with access to real-time market data and competitive trading fees
- Dollar-Cost Averaging: Systematic periodic purchases to mitigate timing risk in volatile market conditions
- Gate Web3 Wallet Integration: Self-custody solution for secure token storage while maintaining trading flexibility
Cryptocurrency investments carry extremely high risks, and this article does not constitute investment advice. Investors should make cautious decisions based on their own risk tolerance and are advised to consult professional financial advisors. Never invest more than you can afford to lose.
FAQ
What are the main factors affecting Lightning Network (LN) price?
LN price is primarily influenced by market demand, transaction volume, and BTC price correlation. Additional factors include network adoption, mining difficulty, and overall crypto market sentiment.
How to analyze and predict Lightning Network token price trends?
Analyze LN token prices by monitoring market sentiment, trading volume, and regulatory developments. Use technical indicators and historical price patterns to identify trends. Key metrics include network adoption, transaction activity, and macroeconomic factors affecting crypto markets overall.
Lightning Network typically commands higher prices due to greater complexity and development costs. Other Layer 2 solutions offer lower costs but limited functionality. Lightning Network provides broader payment capabilities and stronger market adoption, contributing to premium valuation in the market.
What is the historical price fluctuation range of Lightning Network tokens?
LN tokens have historically fluctuated from fractions of a dollar to several hundred dollars. The price peaked during the 2017-2018 bull market, subsequently experiencing significant volatility and corrections during market downturns.
What are professional institutions' predictions for Lightning Network price?
Professional institutions maintain optimistic outlooks on Lightning Network's price trajectory. Experts predict sustained growth driven by increasing adoption in payment systems and scaling solutions. Market analysts forecast LN will play a crucial role in Bitcoin's layer-two ecosystem expansion.
* The information is not intended to be and does not constitute financial advice or any other recommendation of any sort offered or endorsed by Gate.