This comprehensive guide analyzes MarsDAO (MDAO) token price trajectory from 2026 to 2031, providing expert forecasts and practical investment strategies for decentralized autonomous organization investors. The article examines MDAO's current market position—trading at $0.019468 with $1.53M market cap and 78.56M circulating supply—alongside historical price evolution and market sentiment indicators. It evaluates core factors influencing future price movements including supply mechanisms, macroeconomic conditions, and ecosystem development. The analysis projects 2026 price ranges of $0.01157-$0.02864 with potential growth trajectories through 2031. Additionally, the guide presents tailored investment methodologies for different investor profiles, comprehensive risk management frameworks, and critical considerations regarding market volatility, liquidity constraints, and regulatory uncertainties. Perfect for DeFi investors seeking data-driven insights on Gate trading platform.
Introduction: MDAO Market Position and Investment Value
MarsDAO (MDAO), positioned as a community-driven cryptocurrency project focused on delivering transparent profits and addressing market inflation, has been actively developing since its launch in 2022. As of 2026, MDAO maintains a market capitalization of approximately $1.53 million, with a circulating supply of around 78.56 million tokens, and the price hovering around $0.019468. This asset, supported by a holder community of over 104,000 participants, is playing an increasingly important role in fostering interaction within the rapidly evolving cryptocurrency market.
This article will comprehensively analyze MDAO's price trajectory from 2026 to 2031, combining historical patterns, market supply-demand dynamics, ecosystem development, and macroeconomic conditions to provide investors with professional price forecasts and practical investment strategies.
I. MDAO Price History Review and Market Status
MDAO Historical Price Evolution Trajectory
- 2023: The token reached a significant price milestone on February 10, with the price achieving a notable peak at $0.636821
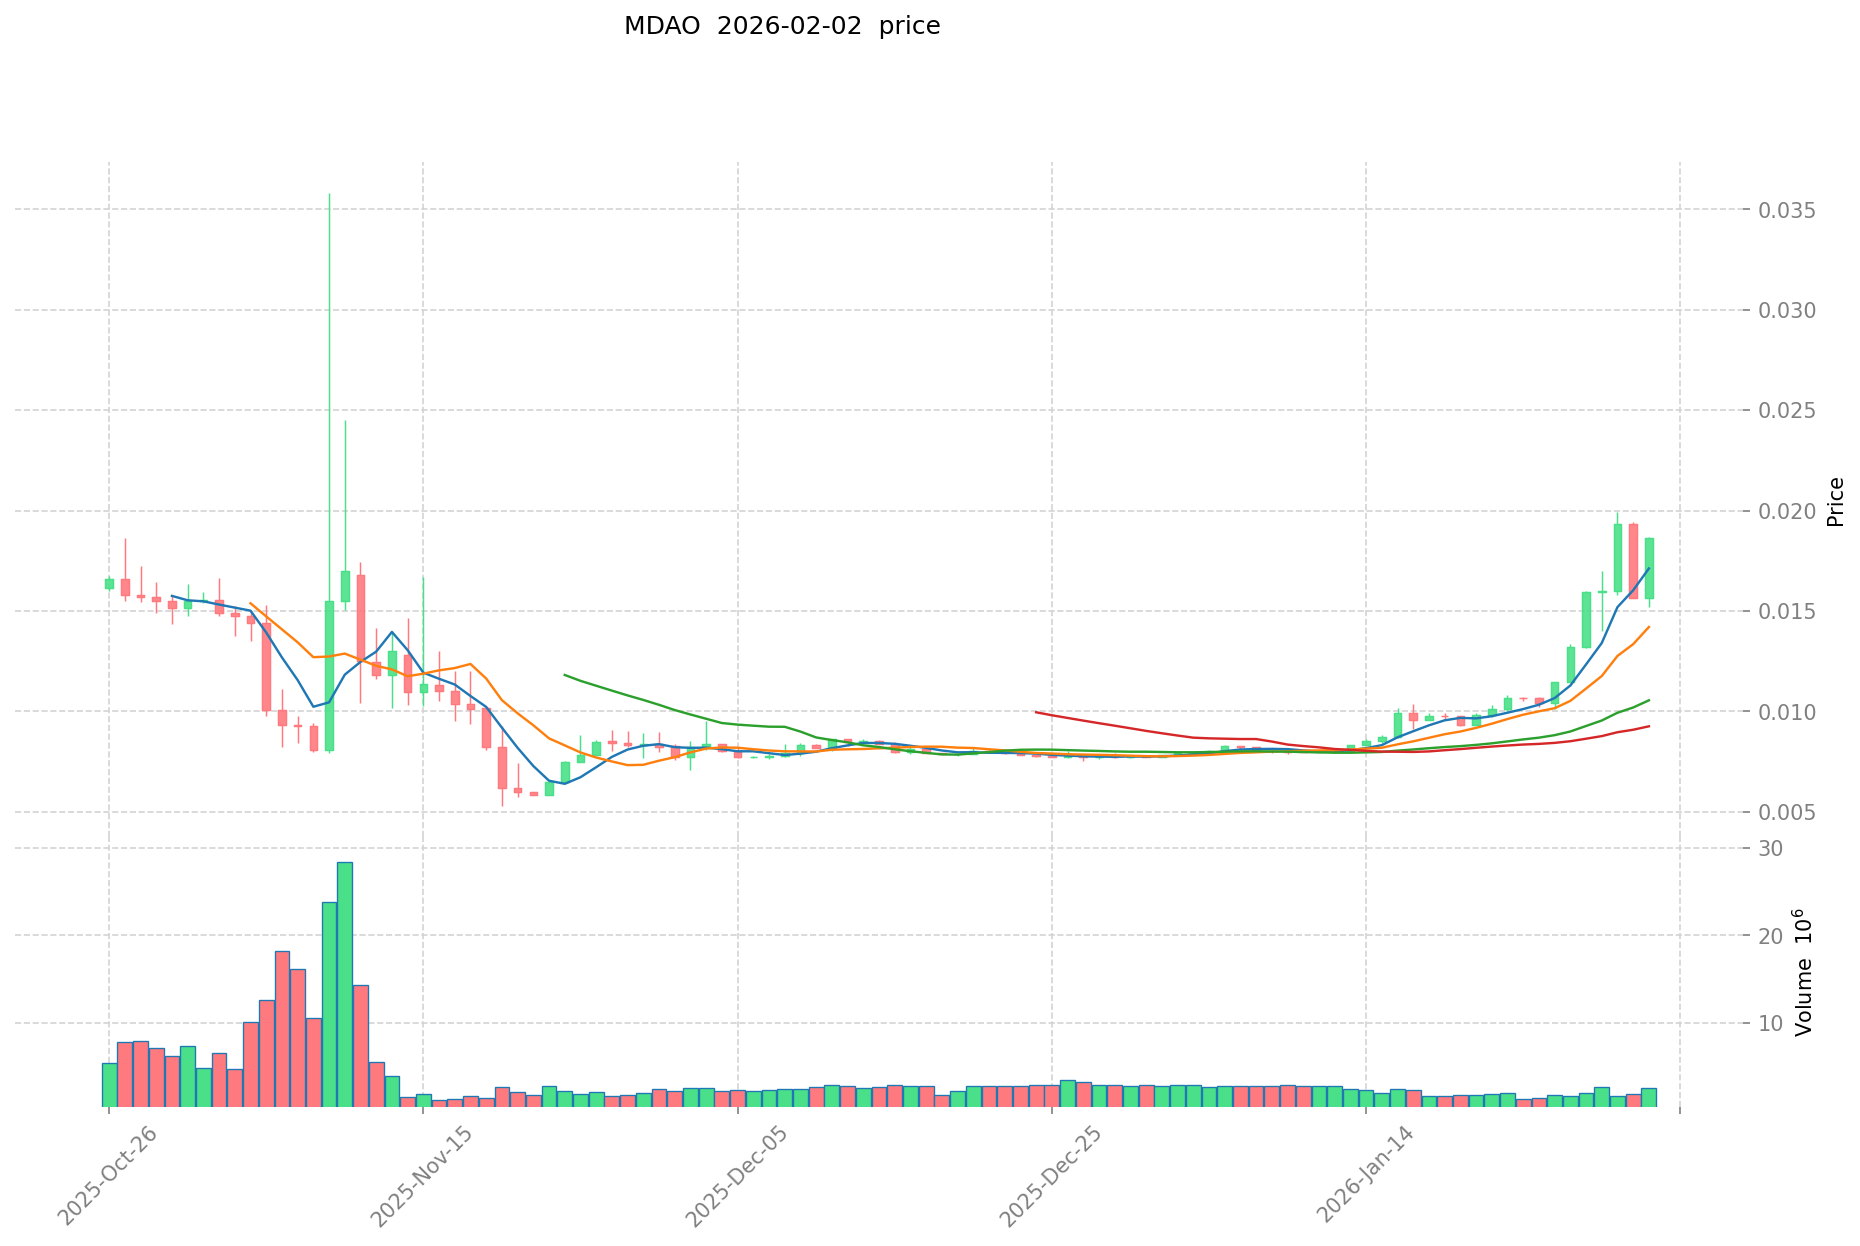
- 2025: The market experienced a downturn phase, with the price declining to a lower level of $0.00545195 on November 20
- 2023-2025: Throughout the market cycle, the price fluctuated from the peak of $0.636821 down to $0.00545195, reflecting broader market dynamics
MDAO Current Market Situation
As of February 2, 2026, MDAO is trading at $0.019468, showing varied performance across different timeframes. The token has demonstrated positive short-term momentum with a 0.75% increase over the past hour and a notable 23.16% gain in the last 24 hours. The weekly performance shows a substantial 85.7% increase, while the monthly timeframe reveals a significant 146.38% gain.
However, the yearly performance indicates a 58.64% decline compared to the previous year, suggesting the token has experienced considerable volatility over longer periods. The 24-hour trading volume stands at $40,718.89, with the price ranging between $0.015192 and $0.01985 during this period.
The token's market capitalization is approximately $1.53 million, with a circulating supply of 78,555,835.66 MDAO tokens, representing 78.56% of the maximum supply of 100 million tokens. The fully diluted market cap reaches approximately $1.87 million. The token holder community consists of 104,866 holders, indicating a distributed ownership structure.
Click to view current MDAO market price
MDAO Market Sentiment Indicator
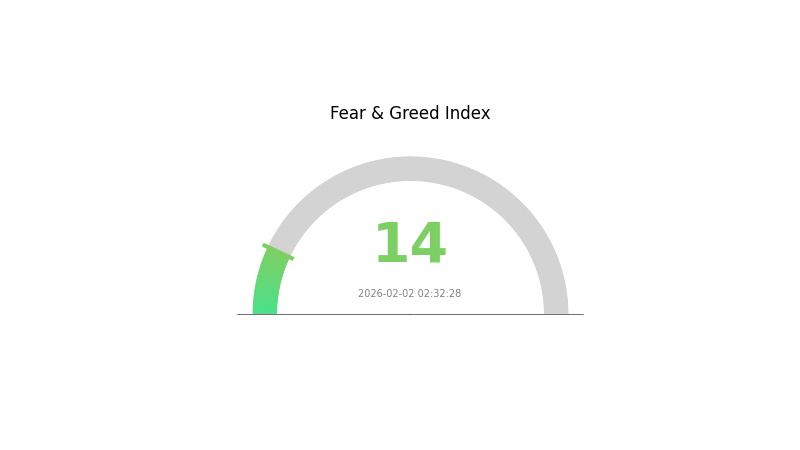
2026-02-02 Fear and Greed Index: 14 (Extreme Fear)
Click to view current Fear & Greed Index
The crypto market is experiencing extreme fear with an index reading of just 14, indicating intense investor pessimism. Market participants are showing heightened anxiety and risk aversion. This level of fear often creates contrarian opportunities for experienced traders, as such extreme sentiment readings have historically preceded significant market reversals. Investors should approach with caution while remaining alert to potential buying opportunities when fear reaches such elevated levels. Monitor market developments closely on Gate.com for the latest trading insights.
MDAO Holdings Distribution
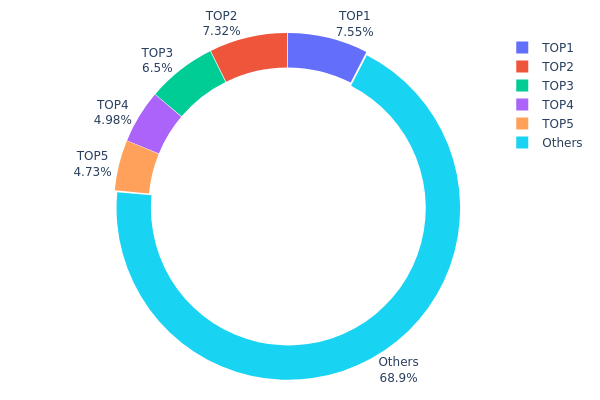
The holdings distribution chart illustrates the allocation of MDAO tokens across different wallet addresses, providing insights into the degree of token concentration among major holders. This metric serves as a crucial indicator of decentralization and potential market manipulation risks.
Based on the current data, the top 5 addresses collectively hold approximately 31.06% of the total MDAO supply, with the largest holder controlling 7.54% (7,546.89K tokens). The second and third largest addresses hold 7.31% and 6.50% respectively, while the remaining addresses in the top 5 each hold between 4.73% and 4.98%. The distribution shows a relatively moderate concentration level, as no single entity dominates an overwhelming portion of the supply, and the remaining 68.94% is distributed among other holders.
This distribution pattern suggests a reasonably balanced on-chain structure that reduces the risk of significant price manipulation by individual whales. The relatively even distribution among the top holders indicates that no single entity has disproportionate control over the market, which typically contributes to more stable price action and healthier trading dynamics. However, the fact that nearly one-third of the supply is concentrated in just five addresses still warrants attention, as coordinated actions among these major holders could potentially influence market sentiment and liquidity conditions.
Click to view current MDAO Holdings Distribution
| Top |
Address |
Holding Qty |
Holding (%) |
| 1 |
0x4982...6e89cb |
7546.89K |
7.54% |
| 2 |
0x0ea0...64652a |
7316.81K |
7.31% |
| 3 |
0xbaef...eff288 |
6501.57K |
6.50% |
| 4 |
0xeaed...6a6b8d |
4982.50K |
4.98% |
| 5 |
0xf89d...5eaa40 |
4730.29K |
4.73% |
| - |
Others |
68921.94K |
68.94% |
II. Core Factors Influencing MDAO's Future Price
Supply Mechanism
- Algorithmic Supply Adjustment: MDAO employs blockchain technology to manage supply dynamics through transparent governance mechanisms. When market conditions fluctuate, the protocol may adjust token distribution to maintain ecosystem stability.
- Historical Pattern: Supply mechanisms in decentralized ecosystems have historically influenced price stability, with controlled distribution helping mitigate excessive volatility during market downturns.
- Current Impact: The current supply framework focuses on yield optimization and market interaction, which may support price resilience as the community actively participates in governance decisions.
Institutional and Major Holder Dynamics
- Institutional Holdings: Available materials do not provide specific data on institutional holdings for MDAO.
- Corporate Adoption: Information regarding corporate adoption of MDAO is not available in the provided materials.
- National Policies: Regulatory challenges represent a potential constraint on MDAO's growth trajectory, though specific national policy details are not documented in the reference materials.
Macroeconomic Environment
- Monetary Policy Impact: Broader market liquidity conditions significantly affect cryptocurrency valuations. Historical data indicates that restrictive monetary policies can create headwinds for digital asset markets.
- Inflation Hedging Characteristics: MDAO's governance framework includes inflation management mechanisms designed to address financial pain points, potentially offering some utility during inflationary periods.
- Geopolitical Factors: Overall market sentiment driven by global economic conditions continues to play a role in cryptocurrency price movements, though specific geopolitical impacts on MDAO are not detailed in available sources.
Technological Development and Ecosystem Building
- Blockchain Technology Innovation: MDAO leverages blockchain infrastructure to enhance transparency in yield generation and market interaction, differentiating itself through technical implementation focused on solving financial challenges.
- Community Engagement: Active community participation and governance represent key competitive advantages, with stakeholder involvement in protocol decisions contributing to ecosystem development.
- Ecosystem Applications: MDAO emphasizes addressing financial pain points through its platform, though specific decentralized applications or ecosystem projects are not enumerated in the provided materials.
III. 2026-2031 MDAO Price Prediction
2026 Outlook
- Conservative prediction: $0.01157 - $0.01961
- Neutral prediction: $0.01961 (average market scenario)
- Optimistic prediction: $0.02864 (requires favorable market conditions and increased adoption)
2027-2029 Outlook
- Market stage expectation: Gradual recovery and consolidation phase with potential for steady growth momentum
- Price range predictions:
- 2027: $0.01809 - $0.02485
- 2028: $0.01592 - $0.03306
- 2029: $0.01813 - $0.03798
- Key catalysts: Market sentiment improvement, potential ecosystem development, and broader cryptocurrency market trends
2030-2031 Long-term Outlook
- Baseline scenario: $0.02637 - $0.03338 (assuming steady market conditions and maintained project development)
- Optimistic scenario: $0.03905 - $0.04472 (assuming enhanced adoption rates and positive market dynamics)
- Transformative scenario: $0.04764 (requires exceptional market conditions and significant ecosystem expansion)
- February 2, 2026: MDAO trading within the predicted range of $0.01157 - $0.02864 (initial phase of multi-year growth trajectory)
| Year |
Predicted High Price |
Predicted Average Price |
Predicted Low Price |
Price Change |
| 2026 |
0.02864 |
0.01961 |
0.01157 |
0 |
| 2027 |
0.02485 |
0.02413 |
0.01809 |
23 |
| 2028 |
0.03306 |
0.02449 |
0.01592 |
25 |
| 2029 |
0.03798 |
0.02877 |
0.01813 |
47 |
| 2030 |
0.04472 |
0.03338 |
0.02637 |
71 |
| 2031 |
0.04764 |
0.03905 |
0.03397 |
100 |
IV. MDAO Professional Investment Strategy and Risk Management
MDAO Investment Methodology
(1) Long-term Holding Strategy
- Target Investors: Investors seeking exposure to community-driven DeFi projects with high risk tolerance
- Operational Recommendations:
- Consider accumulating MDAO during market corrections, as the token has shown significant volatility with a 7-day increase of 85.7% and 30-day surge of 146.38%
- Monitor the project's progress in delivering transparent profits to token holders and inflation solutions
- Storage Solution: Use Gate Web3 Wallet for secure self-custody with multi-chain support, particularly for BSC-based tokens
(2) Active Trading Strategy
- Technical Analysis Tools:
- Volume Analysis: Monitor 24-hour trading volume ($40,718.89) relative to market cap ($1.53M) to identify liquidity patterns
- Price Range Indicators: Track daily ranges (current: $0.015192 - $0.01985) to identify optimal entry and exit points
- Swing Trading Key Points:
- The token has demonstrated high volatility with 24-hour gains of 23.16%, presenting short-term trading opportunities
- Set stop-loss orders considering the token's historical low of $0.00545195 and current recovery trajectory
MDAO Risk Management Framework
(1) Asset Allocation Principles
- Conservative Investors: 1-2% portfolio allocation
- Aggressive Investors: 3-5% portfolio allocation
- Professional Investors: Up to 10% portfolio allocation with active monitoring
(2) Risk Hedging Solutions
- Position Sizing: Limit MDAO exposure considering its low market cap ($1.53M) and limited exchange listings (1 exchange)
- Diversification Strategy: Balance MDAO holdings with established cryptocurrencies and other DeFi tokens
(3) Secure Storage Solutions
- Multi-signature Wallet Recommendation: Gate Web3 Wallet provides enhanced security features for BSC tokens
- Cold Storage Solution: For long-term holdings, consider hardware wallet integration through Gate Web3 Wallet
- Security Precautions: Verify the official contract address (0x60322971a672B81BccE5947706D22c19dAeCf6Fb) on BSCScan before any transactions
V. MDAO Potential Risks and Challenges
MDAO Market Risks
- High Volatility: MDAO experienced a 1-year decline of 58.64%, demonstrating significant downside risk despite recent recovery
- Low Liquidity: With trading volume of approximately $40,718 against a market cap of $1.53M, large orders may face slippage
- Limited Exchange Availability: Trading on only 1 exchange restricts liquidity and price discovery mechanisms
MDAO Regulatory Risks
- DeFi Regulatory Uncertainty: Community-driven DeFi projects may face evolving regulatory scrutiny in various jurisdictions
- Compliance Requirements: Potential future regulations on decentralized autonomous organizations could impact operations
- Cross-border Restrictions: Limited exchange listings may reflect regulatory challenges in certain markets
MDAO Technical Risks
- Smart Contract Vulnerability: As a BSC-based token, MDAO relies on contract security; investors should verify audit reports
- Token Distribution: With 78.56% of max supply in circulation, remaining token releases could create selling pressure
- Adoption Risk: The project's success depends on delivering its promised solutions for transparent profits and inflation management
VI. Conclusion and Action Recommendations
MDAO Investment Value Assessment
MarsDAO presents a high-risk, high-reward opportunity in the community-driven DeFi space. While the token has demonstrated impressive short-term gains (85.7% weekly, 146.38% monthly), its 58.64% annual decline and low market capitalization of $1.53 million indicate significant volatility. The project's focus on transparent profits, market interaction, and inflation solutions aligns with current DeFi trends, but execution risks remain substantial. With limited exchange listings and trading volume, MDAO is suitable primarily for experienced investors with high risk tolerance who can withstand potential significant price fluctuations.
MDAO Investment Recommendations
✅ Beginners: Consider allocating only 0.5-1% of portfolio as educational exposure; start with small amounts to understand DeFi mechanics
✅ Experienced Investors: Limit allocation to 2-5% with clear stop-loss strategies; actively monitor project development and community activity
✅ Institutional Investors: Conduct thorough due diligence on project fundamentals and team; consider pilot allocations not exceeding 1% pending further maturity
MDAO Trading Participation Methods
- Spot Trading on Gate.com: Direct purchase and trading with competitive fees and secure custody options
- Gate Web3 Wallet Integration: Self-custody solution for holding MDAO while maintaining control of private keys
- Dollar-Cost Averaging: Spread purchases over time to mitigate volatility impact, particularly suitable given MDAO's price fluctuations
Cryptocurrency investment carries extremely high risks, and this article does not constitute investment advice. Investors should make prudent decisions based on their own risk tolerance and are advised to consult professional financial advisors. Never invest more than you can afford to lose.
FAQ
MDAO reached an all-time high of ¥4.50 on February 9, 2023, and has since declined significantly. The all-time low stands at ¥0.03707 as of November 19, 2025. Currently, MDAO trades between ¥0.08098 and ¥0.09193 in 24-hour volatility.
What are the main factors affecting MDAO price?
MDAO price is primarily influenced by supply and demand dynamics, investor sentiment, trading volume, market trends, and broader cryptocurrency market conditions. Adoption rates and ecosystem developments also play significant roles in price movements.
What is the price prediction for MDAO token in 2024-2025?
MDAO token price in 2024-2025 is difficult to predict precisely, but is expected to be influenced by market demand and DeFi industry development. Price volatility may occur, with market trends and policy changes being key factors affecting its value.
What advantages does MDAO have compared to other DAO governance tokens?
MDAO offers more flexible decision-making mechanisms and higher transparency. Its governance process is more efficient and automated. Through innovative profit models, MDAO enhances community participation and engagement.
What are the circulating supply and total supply of MDAO tokens?
MDAO has a total supply of 100.00M tokens and a current circulating supply of 70.60M tokens.
What are the main risks of investing in MDAO tokens?
MDAO investment risks include market volatility, platform technical failures, decentralization risks, and regulatory changes that may affect token value and liquidity.
* The information is not intended to be and does not constitute financial advice or any other recommendation of any sort offered or endorsed by Gate.