This comprehensive analysis examines MICHI, a meme-based token on the Solana blockchain, currently trading at $0.002239 with a market cap of $1.24 million. The article provides detailed price trajectories from 2026 through 2031, analyzing historical patterns and market dynamics influencing the token's value movements. It evaluates key factors including community engagement, meme coin sector performance, and market sentiment reflected by the current Extreme Fear index reading of 14. The guide presents multiple price scenarios ranging from conservative to optimistic outlooks, accompanied by practical investment strategies suitable for different investor profiles. Additionally, it addresses significant risks including high volatility, limited liquidity, and regulatory uncertainties. Trading recommendations include spot trading on Gate.com with dollar-cost averaging approaches. The analysis emphasizes rigorous risk management and position sizing appropriate to individual risk tolerance levels.
Introduction: MICHI's Market Position and Investment Value
MICHI, as a meme-based token on the Solana blockchain, has captured significant attention since its emergence in the cryptocurrency space. As of February 2026, MICHI maintains a market capitalization of approximately $1.24 million, with a circulating supply of around 555.77 million tokens and a current price hovering near $0.002239. This asset, characterized as "one of the most memeable cats on the internet," is establishing its presence within the meme coin sector while leveraging the technical capabilities of the Solana network.
This article will comprehensively analyze MICHI's price trajectory from 2026 to 2031, examining historical patterns, market dynamics, ecosystem developments, and macroeconomic conditions to provide investors with professional price forecasts and practical investment strategies.
I. MICHI Price History Review and Market Status
MICHI Historical Price Evolution Trajectory
- 2024: MICHI reached its peak price at 0.5915 USD on November 13, marking a significant milestone since its launch with an initial offering price of 0.34 USD
- 2026: The token experienced considerable volatility, recording its lowest price at 0.001904 USD on February 2, representing a substantial decline from previous levels
MICHI Current Market Situation
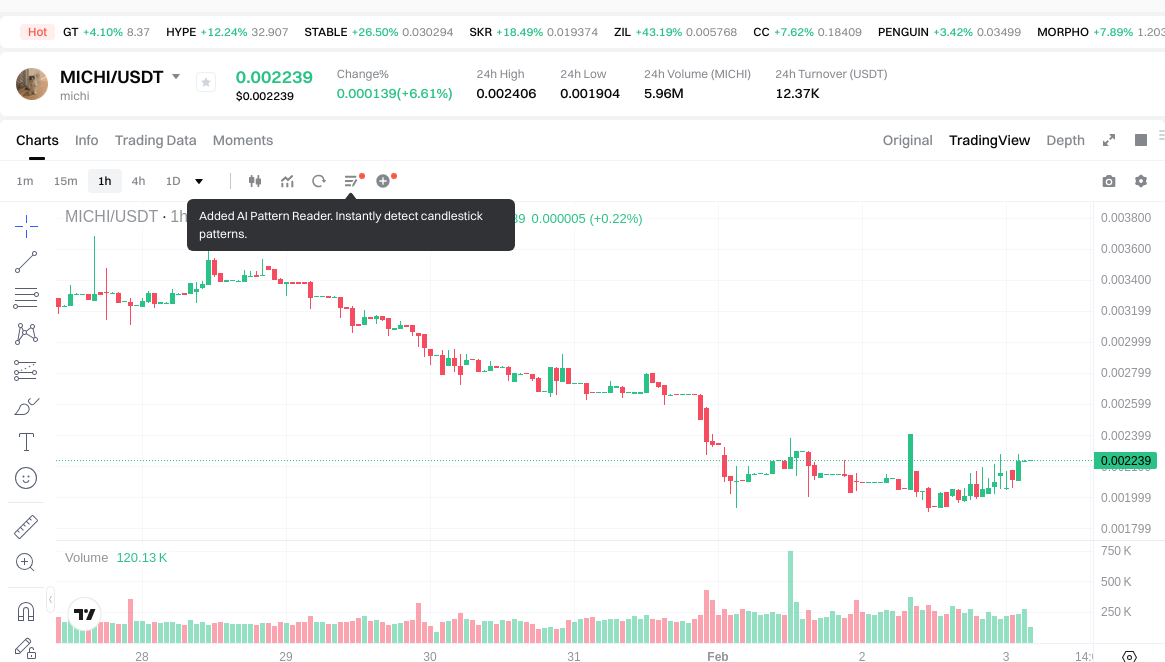
As of February 3, 2026, MICHI is trading at 0.002239 USD, showing a 24-hour increase of 6.61%. The token's 24-hour trading volume stands at 12,361.459747 USD, with a total market capitalization of 1,244,370.586105 USD. The circulating supply represents 555,770,695 tokens, accounting for 55.58% of the maximum supply of 1,000,000,000 tokens.
The token's recent performance shows mixed signals across different timeframes. While demonstrating short-term recovery with a 0.53% gain in the past hour and 6.61% increase over 24 hours, MICHI has experienced notable declines over extended periods, dropping 31.34% in the past week and 48.16% over the last 30 days. The one-year performance indicates a 95.1% decrease from previous levels.
MICHI maintains a holder base of 44,557 participants and operates on the Solana blockchain using the SPL algorithm. The token's fully diluted valuation matches its market capitalization at 1,244,370.586105 USD, with a market dominance of 0.000045%. The 24-hour price range fluctuated between 0.001904 USD and 0.002406 USD.
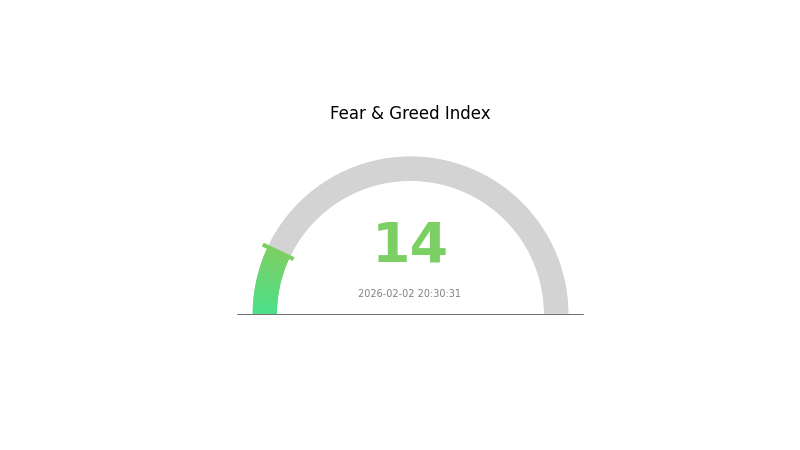
The current market sentiment indicator shows a reading of 14, classified as Extreme Fear, reflecting broader market uncertainty. MICHI is available for trading on Gate.com, with its contract address verified on the Solana blockchain at 5mbK36SZ7J19An8jFochhQS4of8g6BwUjbeCSxBSoWdp.
Click to view current MICHI market price
MICHI Market Sentiment Indicator
2026-02-02 Fear and Greed Index: 14 (Extreme Fear)
Click to view current Fear & Greed Index
The crypto market is experiencing extreme fear, with the Fear and Greed Index plummeting to 14. This indicates significant market pessimism and heightened risk aversion among investors. Such extreme readings historically present opportunities for contrarian traders, as panic-driven sell-offs often create attractive entry points for long-term investors. However, caution remains essential during periods of severe market stress. Monitor key support levels closely and consider dollar-cost averaging strategies to mitigate timing risks. Market conditions remain volatile, so position sizing and risk management should remain your top priorities.
MICHI Holdings Distribution
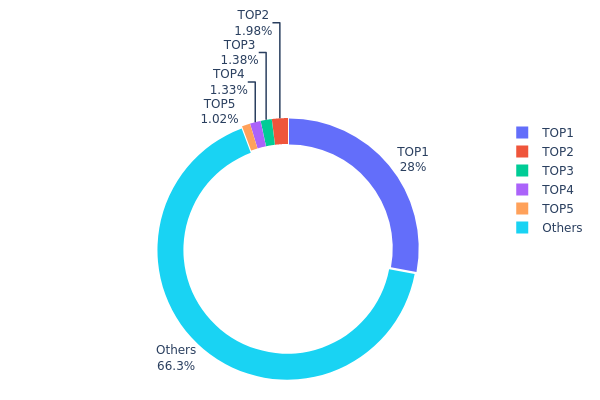
The holdings distribution chart illustrates how MICHI tokens are allocated across different wallet addresses, providing crucial insights into the token's concentration and decentralization level. This metric reveals whether token ownership is dispersed among numerous holders or concentrated within a few major addresses, which significantly impacts market dynamics and price stability.
According to the current data, MICHI exhibits a moderately high concentration pattern. The top-ranking address holds approximately 155.34 million tokens, accounting for 27.95% of the total supply. The top five addresses collectively control around 187.05 million tokens, representing approximately 33.63% of the circulating supply. Meanwhile, the remaining 66.37% is distributed among other holders. This distribution structure indicates that while a significant portion remains concentrated in major addresses, a substantial amount of tokens is held by smaller participants, suggesting a relatively balanced ownership pattern compared to highly centralized projects.
This concentration level presents both opportunities and risks for market participants. The dominance of the largest holder at nearly 28% creates potential vulnerability to significant price movements should this address decide to liquidate or redistribute holdings. However, the fact that two-thirds of the supply is distributed among numerous smaller holders provides a cushion against extreme manipulation and contributes to market liquidity. The current structure reflects a transitional phase typical of emerging tokens, where early investors or project-related addresses maintain substantial positions while community adoption gradually increases distribution breadth.
Click to view current MICHI Holdings Distribution
| Top |
Address |
Holding Qty |
Holding (%) |
| 1 |
5Q544f...pge4j1 |
155344.04K |
27.95% |
| 2 |
E2RvJg...qnatYy |
11005.16K |
1.98% |
| 3 |
ASTyfS...g7iaJZ |
7658.75K |
1.37% |
| 4 |
u6PJ8D...ynXq2w |
7382.87K |
1.32% |
| 5 |
5PAhQi...cnPRj5 |
5665.97K |
1.01% |
| - |
Others |
368696.27K |
66.37% |
II. Core Factors Influencing MICHI's Future Price
Market Demand and Community Engagement
- Market Demand: The price of meme coins like MICHI is influenced by various factors, with market demand being a primary driver. The attraction of decentralization concepts and potential profit opportunities has drawn significant interest from the community.
- Community Conversion: As market structures evolve, the ability to reach broader communities and convert them into active buyers has become essential for meme projects. The simple buying game dynamics make community engagement a key factor in price movements.
- Smart Money Activity: During market fluctuations, whale wallets and smart money have been observed accumulating positions during dips, which can lead to strong rebounds in meme coins.
Meme Coin Market Dynamics
- Sector Performance: Recent meme seasons have seen new-generation popular meme coins experiencing oversold rebounds during market volatility. When market downturns occur with significant drops, these tokens can show strong upward momentum during recovery phases.
- Volatility Opportunities: Price volatility in meme markets creates trading opportunities. Finding appropriate entry points and managing position timing can be crucial factors for capturing price movements.
- Public Chain Performance: The underlying blockchain's performance, along with factors such as regulatory policies, AI technology integration, and IP collaborations, can impact the meme coin market landscape.
Market Sentiment and Trading Patterns
- Popularity Trends: The rising popularity of decentralization and the prospect of quick profits continue to attract participants to the meme coin space.
- Price Action Analysis: Market participants need to consider multiple factors when engaging with meme coins, including entry timing and risk management strategies.
- Rebound Characteristics: Meme tokens have shown tendencies to experience sharp reversals, particularly when supported by large capital inflows during market corrections.
III. 2026-2031 MICHI Price Prediction
2026 Outlook
- Conservative Prediction: $0.00128 - $0.00224
- Neutral Prediction: Around $0.00224
- Optimistic Prediction: Up to $0.00325 (requires favorable market conditions and increased adoption)
2027-2029 Outlook
- Market Stage Expectation: Recovery and gradual growth phase, with potential market volatility as the crypto ecosystem matures
- Price Range Prediction:
- 2027: $0.00263 - $0.00288 (approximately 22% increase expected)
- 2028: $0.00155 - $0.00408 (approximately 25% increase projected, with wider volatility range)
- 2029: $0.00262 - $0.0043 (approximately 53% increase anticipated)
- Key Catalysts: Market recovery momentum, potential ecosystem developments, broader cryptocurrency adoption trends, and macroeconomic factors influencing digital asset sentiment
2030-2031 Long-term Outlook
- Baseline Scenario: $0.00329 - $0.00496 range for 2030 (assuming steady market growth and maintained project momentum)
- Optimistic Scenario: $0.00389 - $0.00459 range by 2031 (contingent on strong ecosystem expansion and sustained investor interest)
- Transformative Scenario: Potential to reach $0.00496 by 2030 (under conditions of exceptional market conditions and significant adoption breakthroughs)
- 2031-12-31: MICHI could potentially trade around $0.00442 (reflecting a cumulative growth of approximately 97% from 2026 baseline under favorable long-term conditions)
| Year |
Predicted High Price |
Predicted Average Price |
Predicted Low Price |
Price Change |
| 2026 |
0.00325 |
0.00224 |
0.00128 |
0 |
| 2027 |
0.00288 |
0.00274 |
0.00263 |
22 |
| 2028 |
0.00408 |
0.00281 |
0.00155 |
25 |
| 2029 |
0.0043 |
0.00344 |
0.00262 |
53 |
| 2030 |
0.00496 |
0.00387 |
0.00329 |
73 |
| 2031 |
0.00459 |
0.00442 |
0.00389 |
97 |
IV. MICHI Professional Investment Strategy and Risk Management
MICHI Investment Methodology
(I) Long-term Holding Strategy
- Suitable for: Investors who believe in the long-term potential of meme-based tokens and have high risk tolerance
- Operational Recommendations:
- Accumulate MICHI during market corrections when prices approach historical support levels
- Monitor community engagement metrics and Solana ecosystem developments to assess project health
- Implement Gate Web3 Wallet for secure storage with multi-layer authentication enabled
(II) Active Trading Strategy
- Technical Analysis Tools:
- Volume Profile Analysis: Monitor 24-hour trading volume patterns; current volume of $12,361 suggests moderate liquidity for short-term trading opportunities
- Support and Resistance Levels: Track price movements between the recent low of $0.001904 and 24-hour high of $0.002406
- Swing Trading Key Points:
- Consider entry positions during price consolidation phases within the $0.0019-$0.0024 range
- Set stop-loss orders below recent support levels to manage downside risk
MICHI Risk Management Framework
(I) Asset Allocation Principles
- Conservative Investors: 1-2% of crypto portfolio
- Aggressive Investors: 3-5% of crypto portfolio
- Professional Investors: 5-8% of crypto portfolio with active monitoring
(II) Risk Hedging Solutions
- Diversification Strategy: Balance MICHI holdings with established cryptocurrencies and stablecoins
- Position Sizing: Limit individual trade exposure to prevent significant capital loss during volatility
(III) Secure Storage Solutions
- Hot Wallet Recommendation: Gate Web3 Wallet for convenient trading access with enhanced security features
- Security Considerations: Enable two-factor authentication, regularly update security settings, and never share private keys or seed phrases
V. MICHI Potential Risks and Challenges
MICHI Market Risks
- High Volatility: MICHI has experienced significant price fluctuations, with a 95.1% decline over the past year, indicating substantial market volatility
- Limited Liquidity: With market cap of approximately $1.24 million and dominance of only 0.000045%, the token faces liquidity constraints that may impact large transactions
- Meme Token Dependency: As a meme-based asset, MICHI's value is heavily influenced by social media trends and community sentiment rather than fundamental utility
MICHI Regulatory Risks
- Regulatory Uncertainty: Evolving cryptocurrency regulations globally may impact meme token trading and accessibility
- Compliance Requirements: Potential future regulatory frameworks may impose additional compliance obligations on meme-based digital assets
- Exchange Limitations: Limited exchange availability (currently available on one exchange) may restrict trading opportunities and market access
MICHI Technical Risks
- Smart Contract Vulnerabilities: Token deployed on Solana blockchain carries inherent smart contract risks that could affect asset security
- Network Dependency: MICHI's performance is tied to Solana network stability and transaction processing capabilities
- Token Supply Concerns: With 55.58% of maximum supply in circulation, future token releases could create selling pressure
VI. Conclusion and Action Recommendations
MICHI Investment Value Assessment
MICHI represents a high-risk, speculative investment opportunity within the meme token sector. While the project benefits from an engaged community of over 44,000 holders and operates on the efficient Solana blockchain, it faces significant challenges including substantial price depreciation, limited liquidity, and high volatility. The token's value proposition relies primarily on community engagement and meme culture appeal rather than fundamental utility. Short-term risks include continued price pressure and market sentiment fluctuations, while long-term prospects depend on sustained community growth and broader meme token market recovery.
MICHI Investment Recommendations
✅ Beginners: Avoid or allocate minimal exposure (under 1% of portfolio) only after gaining experience with established cryptocurrencies
✅ Experienced Investors: Consider limited allocation (2-3%) for speculative positions with strict risk management and stop-loss implementation
✅ Institutional Investors: Generally unsuitable for institutional portfolios due to limited liquidity, high volatility, and lack of fundamental value drivers
MICHI Trading Participation Methods
- Spot Trading: Execute spot purchases on Gate.com with careful position sizing and risk controls
- Dollar-Cost Averaging: Implement systematic small purchases over time to reduce timing risk and average entry costs
- Community Monitoring: Actively track project developments through official channels and assess community engagement before making investment decisions
Cryptocurrency investment carries extreme risk, and this article does not constitute investment advice. Investors should make prudent decisions based on their own risk tolerance and are advised to consult professional financial advisors. Never invest more than you can afford to lose.
FAQ
What is the current price of MICHI token, and what are its all-time high and all-time low prices?
MICHI is currently trading between $0.00324 and $0.00361. The all-time high is $0.5957162408774378, while the all-time low is $0.000001.
How to analyze and predict MICHI's future price trends?
Analyze MICHI price trends using technical indicators like moving averages and RSI to identify support and resistance levels. Study historical trading patterns and volume data to forecast potential price movements and market trends.
What are the practical application scenarios and project background of MICHI token?
MICHI is designed to empower users through decentralized finance solutions, focusing on user-friendly interfaces and accessibility. Its core application includes providing DeFi services to enhance financial inclusion in the Web3 ecosystem.
What are the risks of investing in MICHI tokens and how should I evaluate them?
MICHI token risks include market volatility, regulatory changes, and project execution challenges. Evaluate by assessing team credentials, reviewing whitepaper details, analyzing community engagement, and monitoring transaction volume trends carefully.
How does MICHI differ from other meme coins like DOGE and SHIB?
MICHI distinguishes itself through innovative tokenomics, stronger community governance, and unique utility features. Unlike DOGE's fixed supply and SHIB's massive token volume, MICHI employs strategic deflation mechanisms and enhanced blockchain functionality, positioning it for superior long-term value growth.
Where can I buy and trade MICHI tokens?
MICHI tokens are available on decentralized and centralized exchanges. Raydium is the most popular platform, with the MICHI/SOL pair being the most active trading pair, featuring significant daily trading volume.
* The information is not intended to be and does not constitute financial advice or any other recommendation of any sort offered or endorsed by Gate.