This comprehensive analysis examines MerlinSwap (MP) price trajectory from 2026 to 2031, providing professional forecasts for Bitcoin ecosystem investors. MP, the leading decentralized exchange on Bitcoin Layer 2 networks, currently trades at $0.0001593 with a market cap of $501,795 and faces extreme market fear conditions. The article analyzes historical price evolution, supply-demand dynamics, ecosystem development, and macroeconomic factors influencing MP's valuation. Key forecasts predict MP trading between $0.00009-$0.0002 in 2026, with potential growth to $0.00027-$0.00035 by 2031 under favorable conditions. The guide offers tailored investment strategies for beginners through institutional investors, emphasizing secure storage via Gate Web3 Wallet, risk management protocols, and long-term accumulation opportunities. Investors should weigh significant volatility risks, limited liquidity with $22,665.77 daily volume, and regulatory uncertainties surrounding Bitcoin Layer 2 infrastructure before participa
Introduction: MP's Market Position and Investment Value
MerlinSwap (MP), positioned as the leading decentralized exchange in the Bitcoin ecosystem, has established itself as a liquidity hub for BTC and Bitcoin eco-assets across Bitcoin Layer 2 networks since its launch in 2024. As of 2026, MP maintains a market capitalization of approximately $501,795, with a circulating supply of around 3.15 billion tokens, and a current price hovering near $0.0001593. This asset, recognized as a key player in Bitcoin DeFi infrastructure, is playing an increasingly important role in facilitating decentralized trading and liquidity provision within the Bitcoin ecosystem.
This article will comprehensively analyze MP's price trajectory from 2026 to 2031, combining historical patterns, market supply and demand dynamics, ecosystem development, and macroeconomic conditions to provide investors with professional price forecasts and practical investment strategies.
I. MP Price History Review and Market Status
MP Historical Price Evolution Trajectory
- 2024: The token was officially launched in March with an initial price of $0.001, subsequently experiencing significant growth momentum and reaching a notable price level of $0.009488 in April
- 2024-2025: Following the peak period, the token entered a consolidation phase with price fluctuations reflecting broader market dynamics
- 2025-2026: The market experienced a correction phase, with the price adjusting from previous levels to the current range
MP Current Market Status
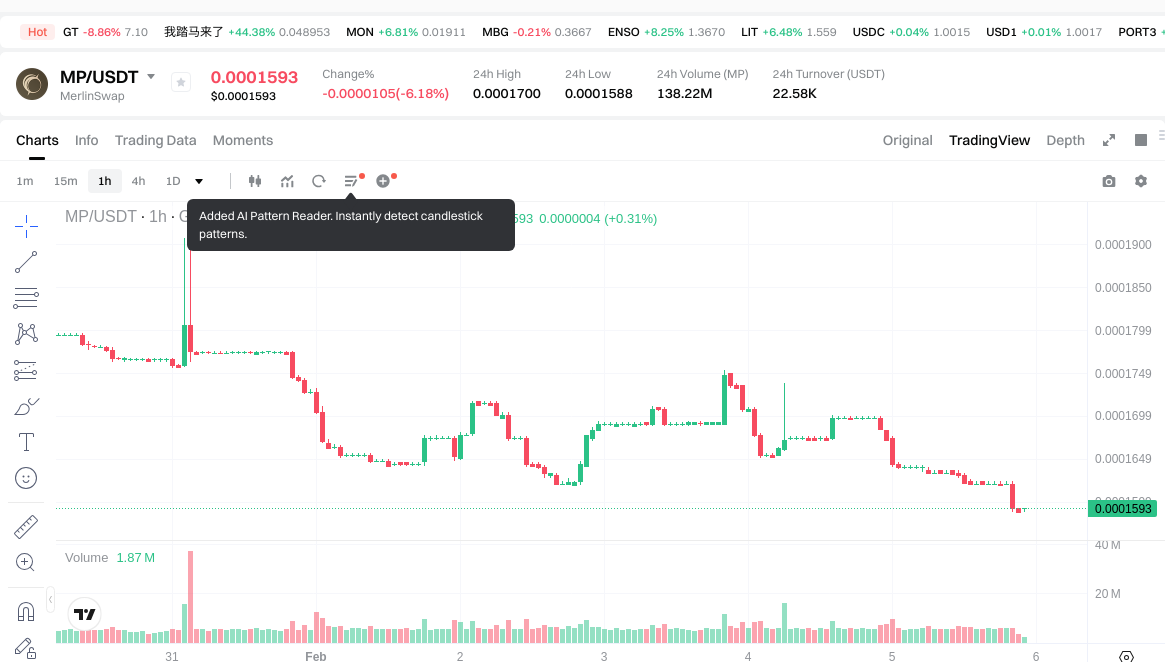
As of February 5, 2026, MP is trading at $0.0001593, with the 24-hour trading range between $0.0001588 and $0.00017. The token has demonstrated mixed short-term performance, showing a 0.31% increase over the past hour, while experiencing a 6.47% decline in the 24-hour period.
From a longer-term perspective, MP has recorded a 14.62% decrease over the past week and a 26.55% decline over the past month. The yearly performance indicates a 60.16% decrease from previous levels. The current market capitalization stands at approximately $501,795, with a circulating supply of 3.15 billion tokens, representing 15% of the maximum supply of 21 billion tokens.
The trading volume over the past 24 hours reached $22,665.77, with the token holder count standing at 66,009 participants. The fully diluted market capitalization is calculated at $3,345,300, with a market cap to FDV ratio of 15%. The current market sentiment index registers at a level indicating cautious market conditions.
MP maintains its position as a decentralized exchange token within the Bitcoin ecosystem, operating on Merlin Chain infrastructure. The token's contract address on the Merlin Chain is 0xbd40c74cb5cf9f9252B3298230Cb916d80430bBa, which can be verified through the blockchain explorer.
Click to view the current MP market price
MP Market Sentiment Index
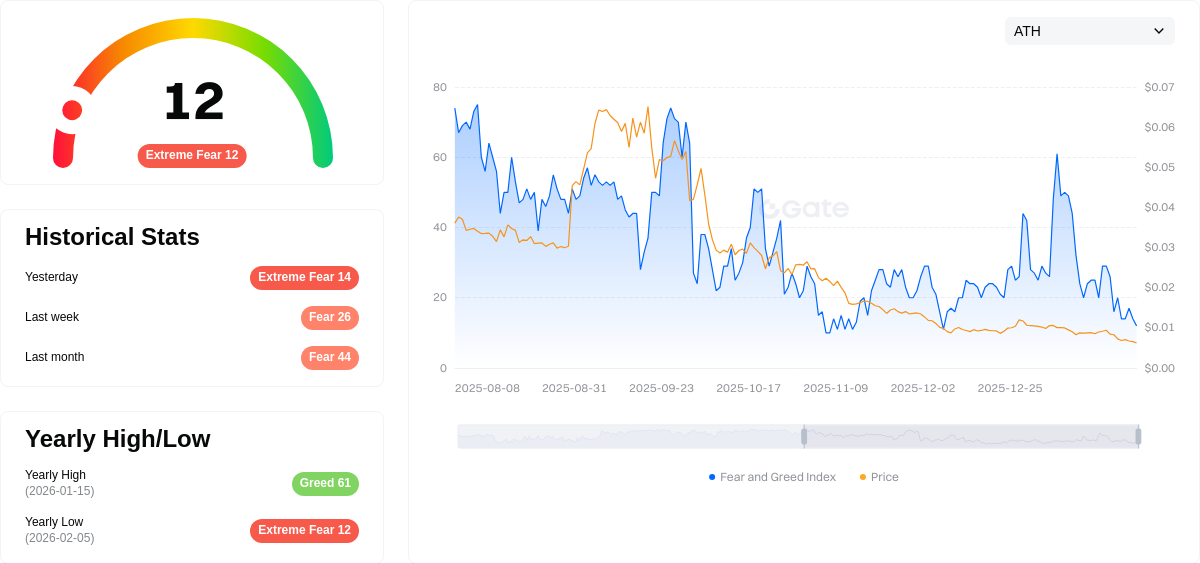
February 05, 2026 Fear and Greed Index: 12 (Extreme Fear)
Click to view current Fear & Greed Index
The cryptocurrency market is currently experiencing extreme fear, with the Fear and Greed Index standing at just 12. This exceptionally low reading indicates heightened market anxiety and risk aversion among investors. Such extreme fear conditions often present contrarian opportunities, as markets tend to overcorrect during panic selling. Investors should exercise caution while monitoring for potential entry points. Risk management remains crucial during volatile periods like this.
MP Holding Distribution
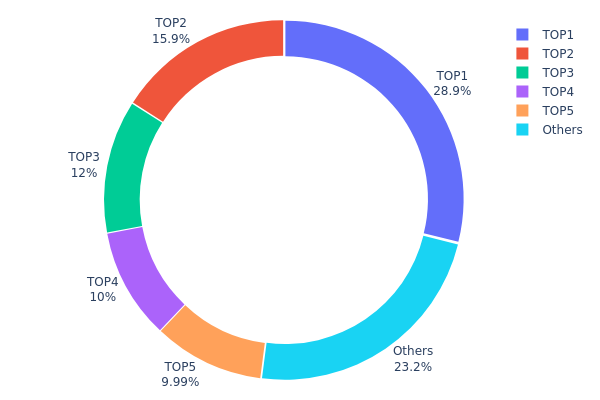
The holding distribution chart reveals the allocation of MP tokens across different blockchain addresses, serving as a key indicator of decentralization and potential market manipulation risks. This metric provides crucial insights into whether token supply is concentrated among few large holders or distributed more evenly across a broader base of participants.
Based on current data, MP exhibits a relatively concentrated holding structure. The top address controls approximately 28.88% of total supply (6,063,750K tokens), while the second-largest holder—a burn address (0x0000...00dead)—accounts for 15.95% (3,348,514.61K tokens). The top five addresses collectively hold 76.82% of circulating supply, with the remaining 23.18% distributed among other market participants. This concentration pattern suggests that a small number of entities maintain significant control over token supply, which could amplify price volatility during large-scale trading activities.
From a market structure perspective, this distribution pattern presents both risks and considerations. The high concentration among top holders creates potential vulnerability to coordinated selling pressure or strategic accumulation. However, the presence of a substantial burn address indicates some supply has been permanently removed from circulation, which may support long-term price stability. The current structure reflects a market still in relatively early stages of distribution, where token circulation has not yet achieved broad diversification across retail and institutional participants. Investors should monitor changes in this distribution pattern, as gradual dispersion toward smaller holders would typically signal improving market maturity and reduced manipulation risks.
Click to view current MP Holding Distribution
| Top |
Address |
Holding Qty |
Holding (%) |
| 1 |
0xb198...35e9c0 |
6063750.00K |
28.88% |
| 2 |
0x0000...00dead |
3348514.61K |
15.95% |
| 3 |
0x92d0...c07a49 |
2520000.00K |
12.00% |
| 4 |
0xcd25...12c044 |
2100000.00K |
10.00% |
| 5 |
0x0f78...48dc5a |
2098673.32K |
9.99% |
| - |
Others |
4869062.07K |
23.18% |
II. Core Factors Influencing MP's Future Price
Supply-Side Dynamics
-
Production Capacity Expansion: MP Materials is rapidly scaling its neodymium-praseodymium oxide production from approximately 1,500 tons annually to nearly 40,000 tons. This significant capacity increase aims to meet growing demand from electric vehicles, wind turbines, and defense systems.
-
Historical Pattern: Operational improvements that boost rare earth oxide output have historically translated into revenue growth and enhanced market positioning for MP Materials.
-
Current Impact: The company's downstream integration into magnet alloy and finished magnet production represents a critical value-chain shift. Once magnet production contributes directly to sales, this vertical integration could substantially alter profit margins by moving beyond raw material sales to higher-margin products.
Institutional and Strategic Partnerships
-
Government Support: MP Materials has secured multi-billion dollar agreements with the U.S. Department of Defense (DoD), which invested through preferred shares and committed to long-term magnet purchases with price floor guarantees. This arrangement ensures stable demand and represents substantial governmental backing.
-
Strategic Positioning: As the only commercial rare earth mining operation in the United States, MP Materials serves as a critical component of national security and industrial competitiveness strategies, particularly in reducing dependence on imported materials.
-
Analyst Ratings: Morgan Stanley recently upgraded MP Materials from "Equal Weight" to "Overweight," citing the company's strategic position in U.S. supply chains and strong year-to-date performance, while also raising price targets.
Macroeconomic Environment
-
Policy Reshoring Initiatives: Broader U.S. policy measures aimed at critical mineral independence have catalyzed sector-wide competition, confirming MP Materials' position within a larger thematic trend of supply chain localization.
-
Geopolitical Considerations: Global rare earth production and processing remain dominated by China. Any trade restrictions or export capacity reductions from China could significantly impact the global electronics ecosystem, potentially benefiting U.S.-based producers like MP Materials.
-
Trade Policy Volatility: Temporary easing of trade tensions or changes in Chinese export policies could adversely affect short-term valuation multiples for U.S. supply chain initiatives, creating potential near-term headwinds for companies like MP Materials.
Operational Execution and Capital Investment
-
Refining and Magnet Production Development: MP Materials continues to deploy substantial capital toward developing its refining and magnet production facilities. While these operations currently require significant investment, they are expected to eventually achieve profitability.
-
Execution Risk: The company faces considerable execution risk and capital intensity as it pursues vertical integration. Investors must balance the strategic importance of domestic rare earth supply against operational challenges and the capital-intensive nature of facility development.
-
Revenue Trajectory Monitoring: Quarterly production milestones, magnet product revenue trajectories, and policy developments serve as leading indicators for assessing whether current valuation multiples remain justified as the company progresses toward its operational targets.
III. 2026-2031 MP Price Prediction
2026 Outlook
- Conservative forecast: $0.00009 - $0.00016
- Neutral forecast: $0.00016
- Optimistic forecast: $0.0002 (requires favorable market conditions and increased adoption)
2027-2029 Outlook
- Market stage expectation: MP may experience gradual growth as the project matures and potentially expands its ecosystem
- Price range forecast:
- 2027: $0.00013 - $0.00025
- 2028: $0.00013 - $0.00029
- 2029: $0.00019 - $0.00028
- Key catalysts: Ecosystem development, strategic partnerships, and broader market recovery could drive price appreciation
2030-2031 Long-term Outlook
- Baseline scenario: $0.0002 - $0.00027 (assuming steady adoption and market stability)
- Optimistic scenario: $0.00027 - $0.00029 (assuming accelerated ecosystem growth and increased utility)
- Transformative scenario: $0.00027 - $0.00035 (under exceptionally favorable conditions including significant technological breakthroughs and mass adoption)
- 2026-02-05: MP price movements remain in early stage with potential for gradual appreciation over the forecast period
| Year |
Predicted High Price |
Predicted Average Price |
Predicted Low Price |
Price Change |
| 2026 |
0.0002 |
0.00016 |
0.00009 |
0 |
| 2027 |
0.00025 |
0.00018 |
0.00013 |
12 |
| 2028 |
0.00029 |
0.00021 |
0.00013 |
33 |
| 2029 |
0.00028 |
0.00025 |
0.00019 |
58 |
| 2030 |
0.00029 |
0.00027 |
0.0002 |
68 |
| 2031 |
0.00035 |
0.00028 |
0.00027 |
74 |
IV. MP Professional Investment Strategy and Risk Management
MP Investment Methodology
(1) Long-term Holding Strategy
- Target Investors: Investors who believe in the long-term development of Bitcoin Layer 2 ecosystem and decentralized exchanges, willing to hold through market fluctuations
- Operational Recommendations:
- Consider accumulating positions during significant market corrections, as MP has shown volatility with a -26.55% decline over the past 30 days
- Monitor the development progress of MerlinSwap's liquidity hub and its adoption across Bitcoin Layer 2 networks
- Storage Solution: Use Gate Web3 Wallet for secure storage, which provides comprehensive support for Merlin Chain-based assets
(2) Active Trading Strategy
- Technical Analysis Tools:
- Support and Resistance Levels: Current price at $0.0001593 shows proximity to the all-time low of $0.0001588, suggesting potential support zone
- Volume Analysis: Monitor the 24-hour trading volume of $22,665.77 to identify liquidity patterns and potential breakout opportunities
- Swing Trading Points:
- Consider the 24-hour range between $0.0001588 and $0.00017 for short-term trading opportunities
- Watch for recovery signals after the recent 1-hour gain of 0.31% following the 24-hour decline of 6.47%
MP Risk Management Framework
(1) Asset Allocation Principles
- Conservative Investors: 1-2% of cryptocurrency portfolio
- Aggressive Investors: 3-5% of cryptocurrency portfolio
- Professional Investors: 5-10% of cryptocurrency portfolio, with active monitoring
(2) Risk Hedging Solutions
- Portfolio Diversification: Balance MP holdings with other established Bitcoin ecosystem assets to reduce concentration risk
- Position Sizing: Given the 60.16% decline over the past year, limit individual position exposure and consider dollar-cost averaging
(3) Secure Storage Solutions
- Web3 Wallet Recommendation: Gate Web3 Wallet supports Merlin Chain assets with enhanced security features
- Cold Storage Option: For long-term holdings, consider transferring to hardware wallets compatible with Merlin Chain
- Security Precautions: Always verify contract address (0xbd40c74cb5cf9f9252B3298230Cb916d80430bBa) before transactions, enable two-factor authentication, and never share private keys
V. MP Potential Risks and Challenges
MP Market Risks
- High Volatility: MP has experienced significant price fluctuations, declining from its all-time high of $0.009488 to current levels near $0.0001593, representing a substantial decrease
- Limited Liquidity: With a 24-hour trading volume of approximately $22,665.77 and market cap of $501,795, liquidity constraints may impact larger transactions
- Low Exchange Availability: Currently trading on only one exchange, which may limit market access and price discovery
MP Regulatory Risks
- Bitcoin Layer 2 Regulatory Uncertainty: As regulatory frameworks for Bitcoin Layer 2 solutions continue to evolve, potential policy changes could impact MerlinSwap's operations
- DeFi Compliance Requirements: Increasing global scrutiny of decentralized exchanges may introduce new compliance obligations that could affect the platform's functionality
- Jurisdictional Restrictions: Regulatory variations across different regions may limit accessibility for certain users
MP Technical Risks
- Smart Contract Vulnerabilities: As with all DeFi protocols, potential security vulnerabilities in smart contracts could pose risks to user funds
- Merlin Chain Dependency: MP's performance is closely tied to the stability and development of the Merlin Chain infrastructure
- Competition Risk: As the 1# DEX in the Bitcoin ecosystem faces potential competition from emerging platforms, market share could be impacted
VI. Conclusion and Action Recommendations
MP Investment Value Assessment
MerlinSwap (MP) positions itself as the leading decentralized exchange within the Bitcoin ecosystem, aiming to serve as a liquidity hub for BTC and Bitcoin eco-assets across Layer 2 networks. The long-term value proposition centers on the growth of Bitcoin's Layer 2 ecosystem and increasing demand for decentralized trading venues. However, significant short-term risks are evident from the substantial price decline of 60.16% over the past year and the token trading near its all-time low. The project's low circulating supply (15% of max supply) and limited exchange availability present both opportunities and challenges for investors.
MP Investment Recommendations
✅ Beginners: Approach MP with caution due to its high volatility and early-stage nature. If interested, allocate only a small percentage (1-2%) of your total cryptocurrency portfolio and use Gate Web3 Wallet for secure storage. Focus on understanding the Bitcoin Layer 2 ecosystem before investing.
✅ Experienced Investors: Consider MP as a strategic allocation within a diversified Bitcoin ecosystem portfolio. Monitor MerlinSwap's development milestones, liquidity growth, and adoption metrics. Implement dollar-cost averaging to manage volatility risk, and maintain positions between 3-5% of your cryptocurrency holdings.
✅ Institutional Investors: Conduct thorough due diligence on MerlinSwap's technical infrastructure, team credentials, and competitive positioning. Evaluate the platform's liquidity metrics and user adoption trends. Consider participating in governance if available, and maintain appropriate risk controls given the limited trading venues.
MP Trading Participation Methods
- Spot Trading: Purchase MP directly on Gate.com with various trading pairs, enabling immediate ownership and participation in the ecosystem
- Portfolio Allocation: Integrate MP as part of a broader Bitcoin Layer 2 investment strategy, balancing holdings across multiple ecosystem projects
- Long-term Accumulation: For believers in the Bitcoin DeFi thesis, consider systematic accumulation during market downturns while maintaining strict position size limits
Cryptocurrency investment carries extremely high risks, and this article does not constitute investment advice. Investors should make prudent decisions based on their own risk tolerance and are advised to consult professional financial advisors. Never invest more than you can afford to lose.
FAQ
What are the main methods and models for MP price prediction?
MP price prediction mainly uses discounted cash flow analysis, comparable company valuation multiples, and dividend discount models to estimate intrinsic value. Technical analysis of trading volume, transaction amount trends, and market sentiment indicators also play important roles in price forecasting.
What are the key factors affecting MP price?
MP price is influenced by market demand, trading volume, token supply dynamics, market sentiment, regulatory developments, and macroeconomic conditions. Increased adoption and positive industry trends typically drive price appreciation.
How to use historical data for MP price trend analysis?
Analyze MP historical data to identify price patterns and trends. Use minute-level data for technical analysis to discover recurring patterns. Access historical datasets including price, trading volume, and trading amount data to make informed trend predictions.
TradingView is considered reliable for MP price prediction, with analysts forecasting target prices between 78.87 and 94.00 USD for 2027. Other trustworthy tools include Yahoo Finance and Zacks for comprehensive market analysis.
Short-term and long-term MP price prediction accuracy rates respectively?
Short-term MP price predictions face higher uncertainty due to market volatility and geopolitical factors. Long-term predictions show stronger confidence, with expected value appreciation through 2025-2026 supported by strategic partnerships and policy backing.
What risks and limitations should be noted when conducting MP price predictions?
MP price predictions involve market volatility uncertainty, future earnings variability, and competitive industry dynamics. Historical data may not predict future performance. Market sentiment shifts and external factors significantly impact accuracy.
What are the reasons for the deviation between MP price predictions and actual market prices?
MP price prediction deviations stem from differences in volatility assumptions. Our model uses historical volatility data, while actual market prices reflect real-time implied volatility. Market sentiment, trading volume, and sudden price movements can cause actual prices to diverge from predictions.
* The information is not intended to be and does not constitute financial advice or any other recommendation of any sort offered or endorsed by Gate.