This comprehensive analysis examines Nodecoin (NC), a decentralized bandwidth-sharing platform for predictive intelligence, trading at $0.001156 as of February 2026. The article provides professional price forecasts spanning 2026-2031, combining historical patterns, supply-demand dynamics, and ecosystem development analysis. Investors gain actionable insights into conservative, neutral, and optimistic scenarios, alongside practical investment strategies including long-term holding and active trading approaches. The analysis addresses key market factors—from extreme fear sentiment to concentrated token holdings—while detailing essential risk management frameworks and allocation principles. Comprehensive sections cover regulatory risks, technical vulnerabilities, and liquidity constraints, enabling informed decision-making for beginners through institutional investors engaging with this emerging AI-driven data network on Gate.com.
Introduction: NC's Market Position and Investment Value
Nodecoin (NC), positioning itself as a real-time predictive intelligence platform powered by decentralized bandwidth-sharing infrastructure, has emerged as an innovative player in the crypto ecosystem since its launch in 2025. As of February 2026, NC maintains a market capitalization of approximately $342,165, with a circulating supply of around 295.99 million tokens, trading at approximately $0.001156. This asset, which aggregates user signal inputs, social activity, and on-chain data to deliver actionable market insights, is playing an increasingly notable role in the AI-driven data intelligence sector.
This article will comprehensively analyze NC's price trajectory from 2026 to 2031, combining historical patterns, market supply-demand dynamics, ecosystem development, and macroeconomic conditions to provide investors with professional price forecasts and practical investment strategies.
I. NC Price History Review and Market Status
NC Historical Price Evolution Trajectory
- January 2025: NC token was launched on Gate.com at an initial price of $0.1, marking its debut in the cryptocurrency market
- January 17, 2025: The token reached a notable price level of $0.335, representing the highest price point recorded to date
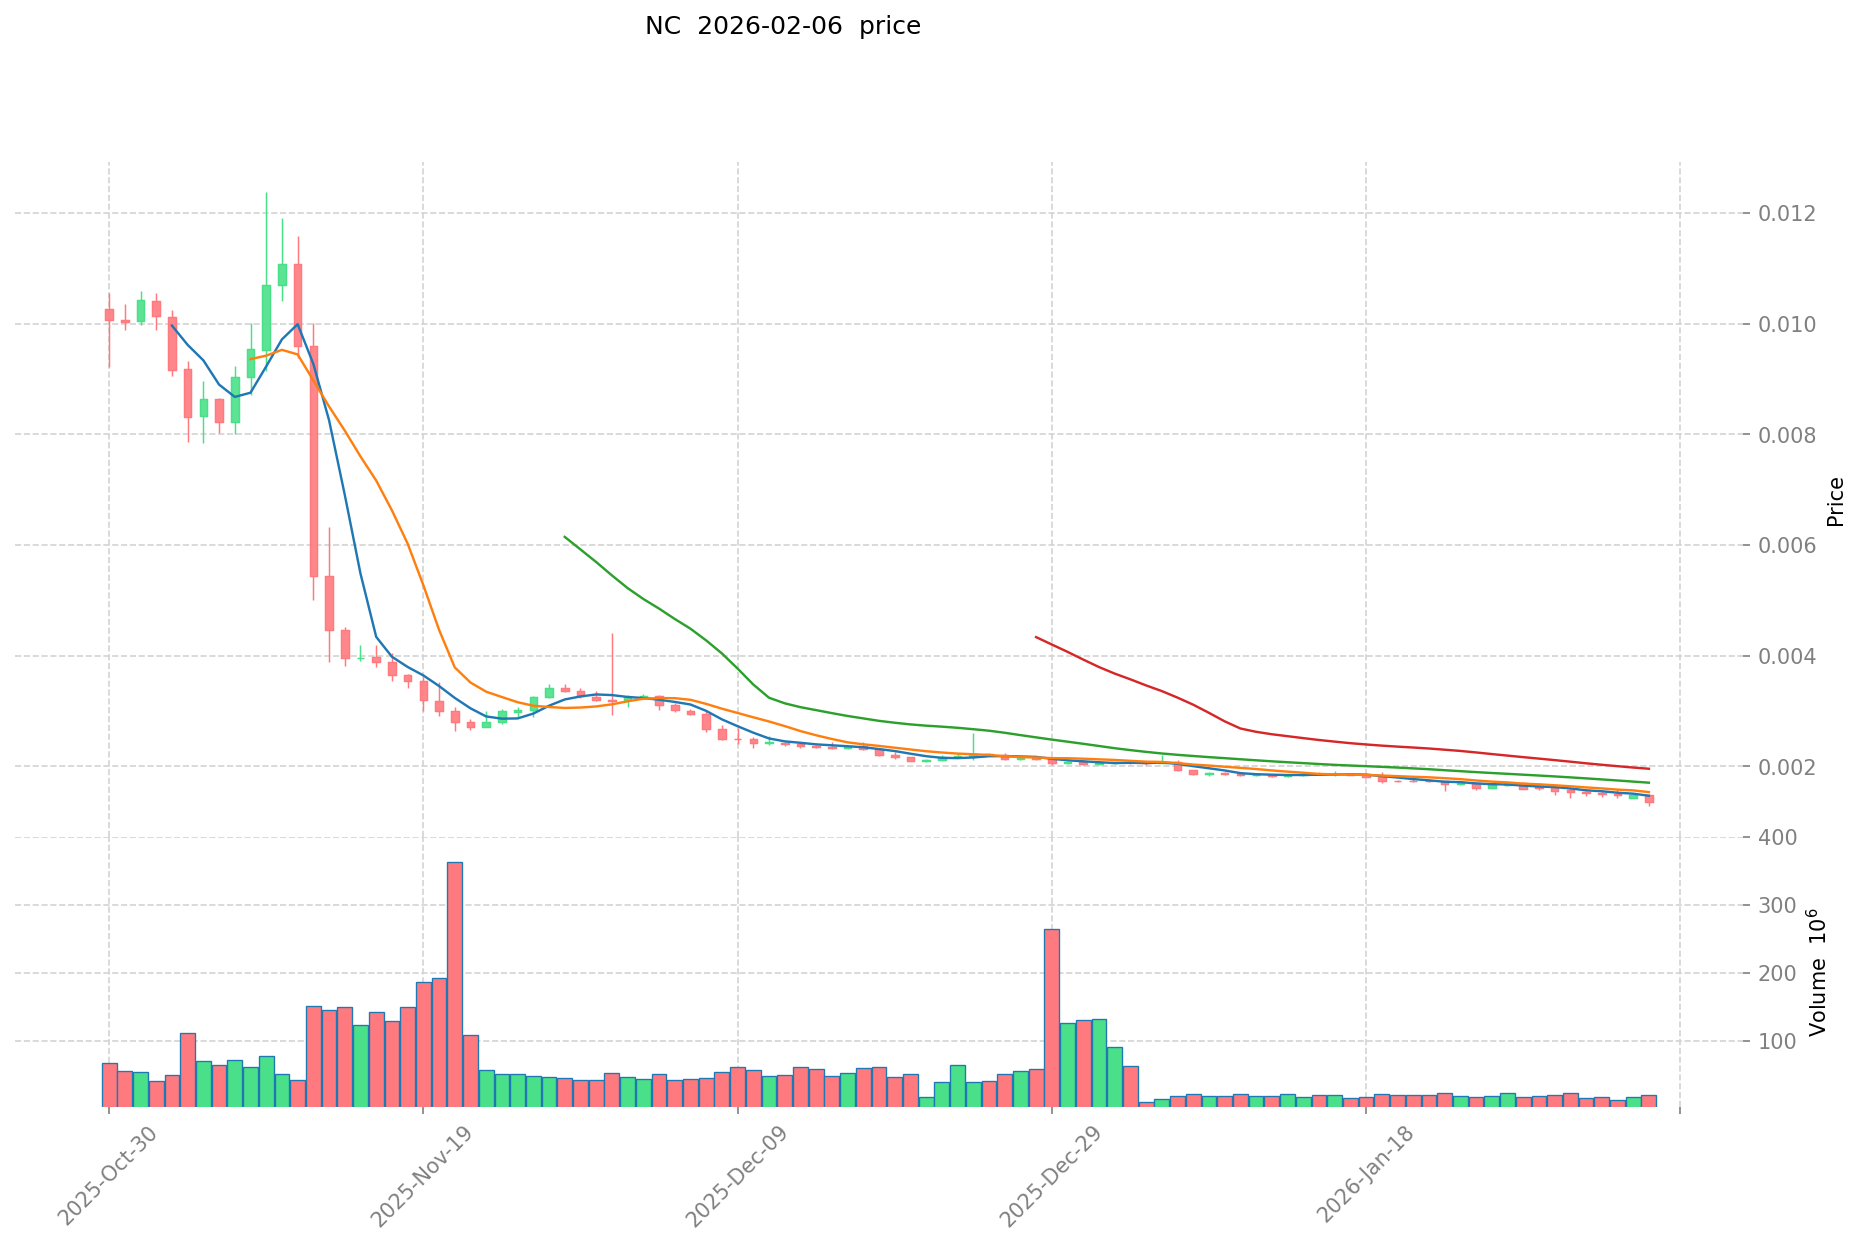
- February 2026: Market experienced significant downward pressure, with the price declining to $0.001132, marking a considerable correction from previous levels
NC Current Market Situation
As of February 7, 2026, NC is trading at $0.001156, with a 24-hour trading volume of $26,999.38. The token demonstrates notable short-term volatility, declining 0.26% over the past hour and 16.18% over the past 24 hours. Weekly and monthly trends show continued downward pressure, with decreases of 26.93% and 37.34% respectively.
The market capitalization stands at approximately $342,165, based on a circulating supply of 295,990,695 NC tokens. This represents 29.6% of the total supply of 999,962,813 tokens, with a maximum supply capped at 1 billion. The fully diluted market cap is calculated at $1,155,957. NC currently holds the 3,381st position in cryptocurrency rankings, with a market dominance of 0.000046%.
The token is available on 7 exchanges and maintains a holder base of 128,161 addresses. The 24-hour price range fluctuated between $0.001132 and $0.001392. The Fear and Greed Index currently registers at 9, indicating an extreme fear sentiment in the broader market.
Click to view current NC market price
NC Market Sentiment Indicator
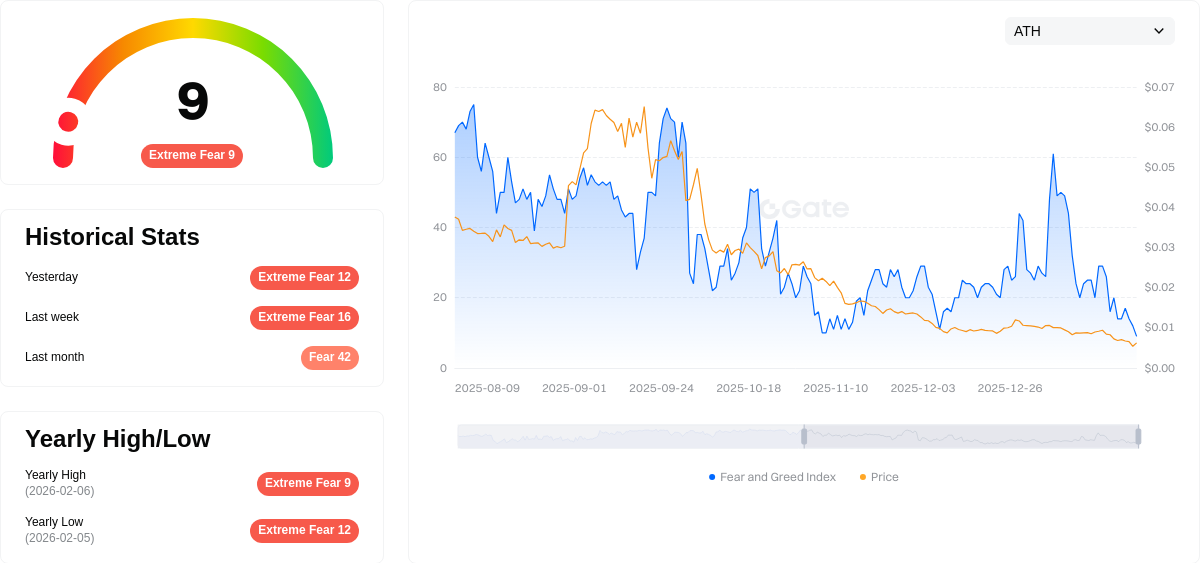
2026-02-06 Fear & Greed Index: 9 (Extreme Fear)
Click to view current Fear & Greed Index
The cryptocurrency market is currently experiencing extreme fear, with the Fear & Greed Index plunging to 9. This exceptionally low reading indicates severe market pessimism and heightened risk aversion among investors. When the index reaches such extreme levels, it often signals potential oversold conditions and potential buying opportunities for contrarian investors. Market participants should exercise caution and conduct thorough analysis before making investment decisions during this period of intense market anxiety.
NC Holdings Distribution
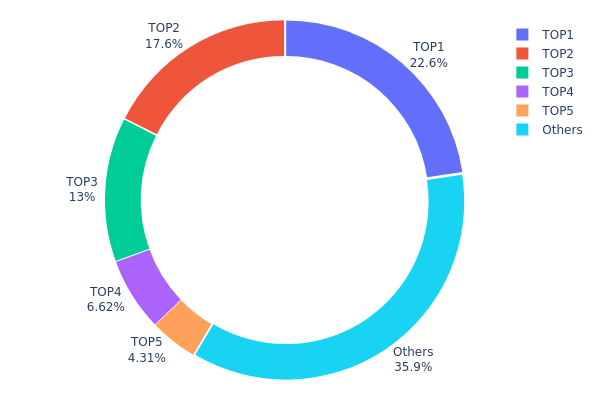
The holdings distribution chart reveals the allocation of NC tokens across different wallet addresses, serving as a key indicator of decentralization and potential market manipulation risks. This metric helps assess whether token supply is concentrated among a few major holders or distributed more evenly across the community, which directly impacts price stability and market dynamics.
Based on the current data, NC exhibits a moderately concentrated holdings structure. The top 5 addresses collectively control 64.09% of the total supply, with the largest holder possessing 22.60% (approximately 226 million tokens), followed by the second-largest at 17.56% and the third at 13.00%. The remaining 35.91% is distributed among other addresses, indicating that while there is some degree of distribution, a significant portion of supply remains concentrated in relatively few wallets.
This concentration level presents both opportunities and risks for market participants. On the positive side, large holders may have vested interests in the project's long-term success, potentially providing price stability during market downturns. However, the substantial holdings by top addresses also introduce heightened volatility risks, as significant sell pressure from any major holder could trigger sharp price movements. The current structure suggests that NC's on-chain ecosystem is still in a relatively early stage of development, where achieving broader token distribution and enhanced decentralization remains an important objective for improving market structure resilience and reducing susceptibility to concentrated selling pressure.
Click to view the current NC Holdings Distribution
| Top |
Address |
Holding Qty |
Holding (%) |
| 1 |
F5o3ML...yEnSiU |
225996.12K |
22.60% |
| 2 |
9cM2M6...DtKnUg |
175617.80K |
17.56% |
| 3 |
7QaLNh...YubMfZ |
130000.00K |
13.00% |
| 4 |
u6PJ8D...ynXq2w |
66241.15K |
6.62% |
| 5 |
9i33D8...5TLQzW |
43108.26K |
4.31% |
| - |
Others |
358999.46K |
35.91% |
II. Core Factors Influencing NC's Future Price
Macroeconomic Environment
- Monetary Policy Impact: Major central banks are expected to maintain cautious monetary policies in response to ongoing economic uncertainty.
- Inflation Hedging Attribute: NC may serve as a potential hedge against inflation, though its effectiveness depends on broader market conditions and investor sentiment.
- Geopolitical Factors: Global regulatory dynamics and shifts in digital asset policies across different jurisdictions continue to shape market conditions.
Market Supply and Demand
- Circulation Volume: Changes in the circulating supply and the number of addresses holding NC directly influence short-term price movements.
- Trading Depth: Buy and sell depth on major trading platforms affects liquidity and price stability.
- Historical Patterns: NC has experienced significant volatility, with substantial price fluctuations observed across different market cycles.
Technology Development and Ecosystem Building
- Project Upgrades: Mainnet upgrades, new partnership additions, and the implementation of practical application scenarios form the foundation of long-term value.
- Ecosystem Applications: The expansion of real-world use cases and the development of the project's ecosystem are key drivers of sustained growth.
- Technical Innovation: Ongoing technological improvements and infrastructure development support the project's competitive positioning.
Market Liquidity and Trading Activity
- Platform Support: Availability and trading volume on major exchanges, including Gate.com, influence accessibility and price discovery.
- Investor Sentiment: Market participants' risk preferences and overall sentiment toward digital assets shape demand patterns.
- Market Trends: The performance of mainstream digital assets and overall market cycles create the external environment in which NC operates.
III. 2026-2031 NC Price Forecast
2026 Outlook
- Conservative forecast: $0.00096 - $0.00116
- Neutral forecast: $0.00116
- Optimistic forecast: $0.0016 (requires favorable market conditions)
2027-2029 Outlook
- Market stage expectation: NC may experience gradual growth as the project develops and adoption potentially increases
- Price range forecast:
- 2027: $0.0008 - $0.00195
- 2028: $0.0013 - $0.00228
- 2029: $0.00114 - $0.00237
- Key catalysts: Market sentiment improvement, potential ecosystem expansion, and broader cryptocurrency market trends
2030-2031 Long-term Outlook
- Baseline scenario: $0.00132 - $0.0028 (assuming steady market development)
- Optimistic scenario: $0.00196 - $0.00291 (assuming enhanced adoption and positive regulatory environment)
- Transformative scenario: Potential breakthrough above $0.003 (requires exceptional market conditions and significant technological breakthroughs)
- 2026-02-07: NC trading within the predicted range of $0.00096 - $0.0016 (early stage of forecast period)
| Year |
Predicted High Price |
Predicted Average Price |
Predicted Low Price |
Price Change |
| 2026 |
0.0016 |
0.00116 |
0.00096 |
0 |
| 2027 |
0.00195 |
0.00138 |
0.0008 |
19 |
| 2028 |
0.00228 |
0.00166 |
0.0013 |
43 |
| 2029 |
0.00237 |
0.00197 |
0.00114 |
70 |
| 2030 |
0.0028 |
0.00217 |
0.00132 |
87 |
| 2031 |
0.00291 |
0.00248 |
0.00196 |
114 |
IV. NC Professional Investment Strategy and Risk Management
NC Investment Methodology
(1) Long-Term Holding Strategy
- Target Investors: Investors who believe in the long-term value of decentralized predictive intelligence platforms and AI-driven data networks
- Operational Recommendations:
- Consider accumulating NC tokens during market corrections when prices approach support levels
- Monitor the platform's development progress and user growth metrics to assess long-term potential
- Utilize secure storage solutions such as Gate Web3 Wallet for long-term holdings
(2) Active Trading Strategy
- Technical Analysis Tools:
- Moving Averages: Use 50-day and 200-day moving averages to identify trend directions and potential entry/exit points
- RSI (Relative Strength Index): Monitor overbought (above 70) and oversold (below 30) conditions to time trades
- Swing Trading Key Points:
- Set clear profit targets and stop-loss levels before entering positions
- Consider the high volatility of NC, which has shown significant price fluctuations in recent periods
NC Risk Management Framework
(1) Asset Allocation Principles
- Conservative Investors: 1-3% of crypto portfolio
- Aggressive Investors: 5-10% of crypto portfolio
- Professional Investors: Up to 15% of crypto portfolio with active monitoring
(2) Risk Hedging Solutions
- Diversification Strategy: Avoid concentrating holdings solely in NC; maintain exposure across multiple crypto assets
- Position Sizing: Implement gradual accumulation rather than lump-sum investment to average entry costs
(3) Secure Storage Solutions
- Hot Wallet Recommendation: Gate Web3 Wallet for convenient trading and access
- Cold Storage Solution: Consider hardware wallet solutions for long-term holdings exceeding trading needs
- Security Precautions: Never share private keys or seed phrases; enable two-factor authentication on all accounts; verify contract addresses before transactions
V. NC Potential Risks and Challenges
NC Market Risks
- High Volatility: NC has experienced significant price fluctuations, with a 98% decline from its all-time high of 0.335 USD reached in January 2025 to current levels
- Limited Liquidity: With a 24-hour trading volume of approximately 27,000 USD and market cap around 342,000 USD, liquidity constraints may impact large transactions
- Low Market Capitalization: Ranking at position 3381 with only 0.000046% market dominance indicates limited market adoption and higher risk exposure
NC Regulatory Risks
- Evolving Regulatory Landscape: Decentralized data networks and AI-driven platforms may face increased scrutiny from regulatory authorities
- Compliance Uncertainty: The integration of user-contributed bandwidth resources and data aggregation may encounter data privacy and regulatory challenges in different jurisdictions
- Token Classification: Uncertainty regarding how NC tokens may be classified by various regulatory bodies could impact trading and usage
NC Technical Risks
- Network Dependency: The platform's reliance on user-contributed bandwidth and internet resources creates potential vulnerabilities if participation declines
- Competition: Other predictive intelligence and AI-driven platforms may emerge with superior technology or larger user bases
- Smart Contract Risks: As an SPL20 token on the Solana blockchain, NC is subject to potential smart contract vulnerabilities and network-specific risks
VI. Conclusion and Action Recommendations
NC Investment Value Assessment
Nodecoin presents an interesting proposition in the decentralized predictive intelligence space, leveraging user-contributed bandwidth to power AI data retrieval and market sentiment analysis. However, the token faces significant challenges including substantial price decline from its peak, limited liquidity, low market capitalization, and a circulating supply representing only 29.6% of total supply. The project's long-term value proposition depends on successful platform adoption, user growth, and the ability to deliver actionable market insights. Short-term risks remain elevated due to market volatility and limited trading volume.
NC Investment Recommendations
✅ Beginners: Exercise extreme caution; if interested, allocate no more than 1-2% of your crypto portfolio and prioritize learning about the platform's fundamentals before investing
✅ Experienced Investors: Consider NC as a speculative, high-risk position within a diversified portfolio; monitor platform development and user metrics closely; implement strict stop-loss measures
✅ Institutional Investors: Conduct thorough due diligence on the platform's technology, team, and market positioning; consider the limited liquidity and high volatility before committing significant capital
NC Trading Participation Methods
- Spot Trading: Purchase NC tokens directly on Gate.com or other supporting exchanges for long-term holding or active trading
- Dollar-Cost Averaging: Gradually accumulate positions over time to mitigate timing risk and reduce average entry cost
- Research-Driven Approach: Monitor the platform's whitepaper, social media channels, and on-chain metrics to stay informed about development progress and ecosystem growth
Cryptocurrency investment carries extremely high risks, and this article does not constitute investment advice. Investors should make cautious decisions based on their own risk tolerance and are advised to consult professional financial advisors. Never invest more than you can afford to lose.
FAQ
What is NC's historical price trend? What was the price change over the past year?
NC has remained relatively stable over the past year, with price fluctuations below 1%. The current price stands at $0, reflecting minimal volatility in the market.
What are the main factors affecting NC price?
NC price is primarily influenced by market supply and demand dynamics, trading volume, market sentiment, technological developments, and macroeconomic factors. Additionally, token economics, adoption trends, and competitive positioning within the blockchain ecosystem significantly impact its valuation.
What are experts' predictions for NC's future price?
Experts predict NC will reach $0.001624 in 2027, $0.001705 in 2028, and $0.003062 in 2040, based on market trends and growth assumptions.
What are NC's advantages or disadvantages compared to other similar assets?
NC demonstrates strong fundamentals in water utilities with extensive operational experience and larger asset scale than comparable competitors. However, it faces market competition and regulatory risks that may impact long-term performance.
What risks should I pay attention to when investing in NC?
NC investment carries market volatility risk. Price fluctuations can be significant in short term. Investors should implement proper risk management strategies and only invest capital they can afford to lose.
What is the liquidity and trading volume of NC? Which exchanges can trade it?
NC is issued on Solana with fast and low-fee trading characteristics. It maintains healthy liquidity and trading volume. NC is available on major cryptocurrency exchanges. Check the order book depth on your preferred platform for current trading conditions.
* The information is not intended to be and does not constitute financial advice or any other recommendation of any sort offered or endorsed by Gate.