This comprehensive article analyzes OpenLeverage (OLE) token's price trajectory and investment potential through 2031. Starting from OLE's current market position—trading at $0.001544 with $291,245 market cap—the analysis examines historical price evolution, supply mechanisms, and ecosystem development. Professional price forecasts range from $0.00122-$0.00172 in 2026 to $0.00222-$0.00288 by 2031, depending on adoption rates and market conditions. The article provides tailored investment strategies for different investor profiles, outlines risk management frameworks including asset allocation principles, and addresses regulatory and technical risks inherent to DeFi margin trading protocols. Real-time OLE market data and trading opportunities are available on Gate, with emphasis on secure storage solutions and dollar-cost averaging strategies for navigating volatility.
Introduction: OLE's Market Position and Investment Value
OpenLeverage (OLE), as a permissionless lending and margin trading protocol, has been enabling traders to long or short any trading pair on decentralized exchanges since its launch in 2022. As of 2026, OLE maintains a market capitalization of approximately $291,245, with a circulating supply of around 188.63 million tokens, and the price stabilizes at about $0.001544. This asset, recognized as a "DeFi margin trading enabler," is playing an increasingly important role in decentralized finance and leveraged trading applications.
This article will comprehensively analyze OLE's price trends from 2026 to 2031, combining historical patterns, market supply and demand, ecosystem development, and macroeconomic environment to provide investors with professional price forecasts and practical investment strategies.
I. OLE Price History Review and Market Status
OLE Historical Price Evolution Trajectory
- 2022: OpenLeverage reached a notable price level during market expansion, with OLE trading at $0.155627 on July 7th
- 2022-2026: The token experienced a significant correction phase, reflecting broader market dynamics and project development cycles
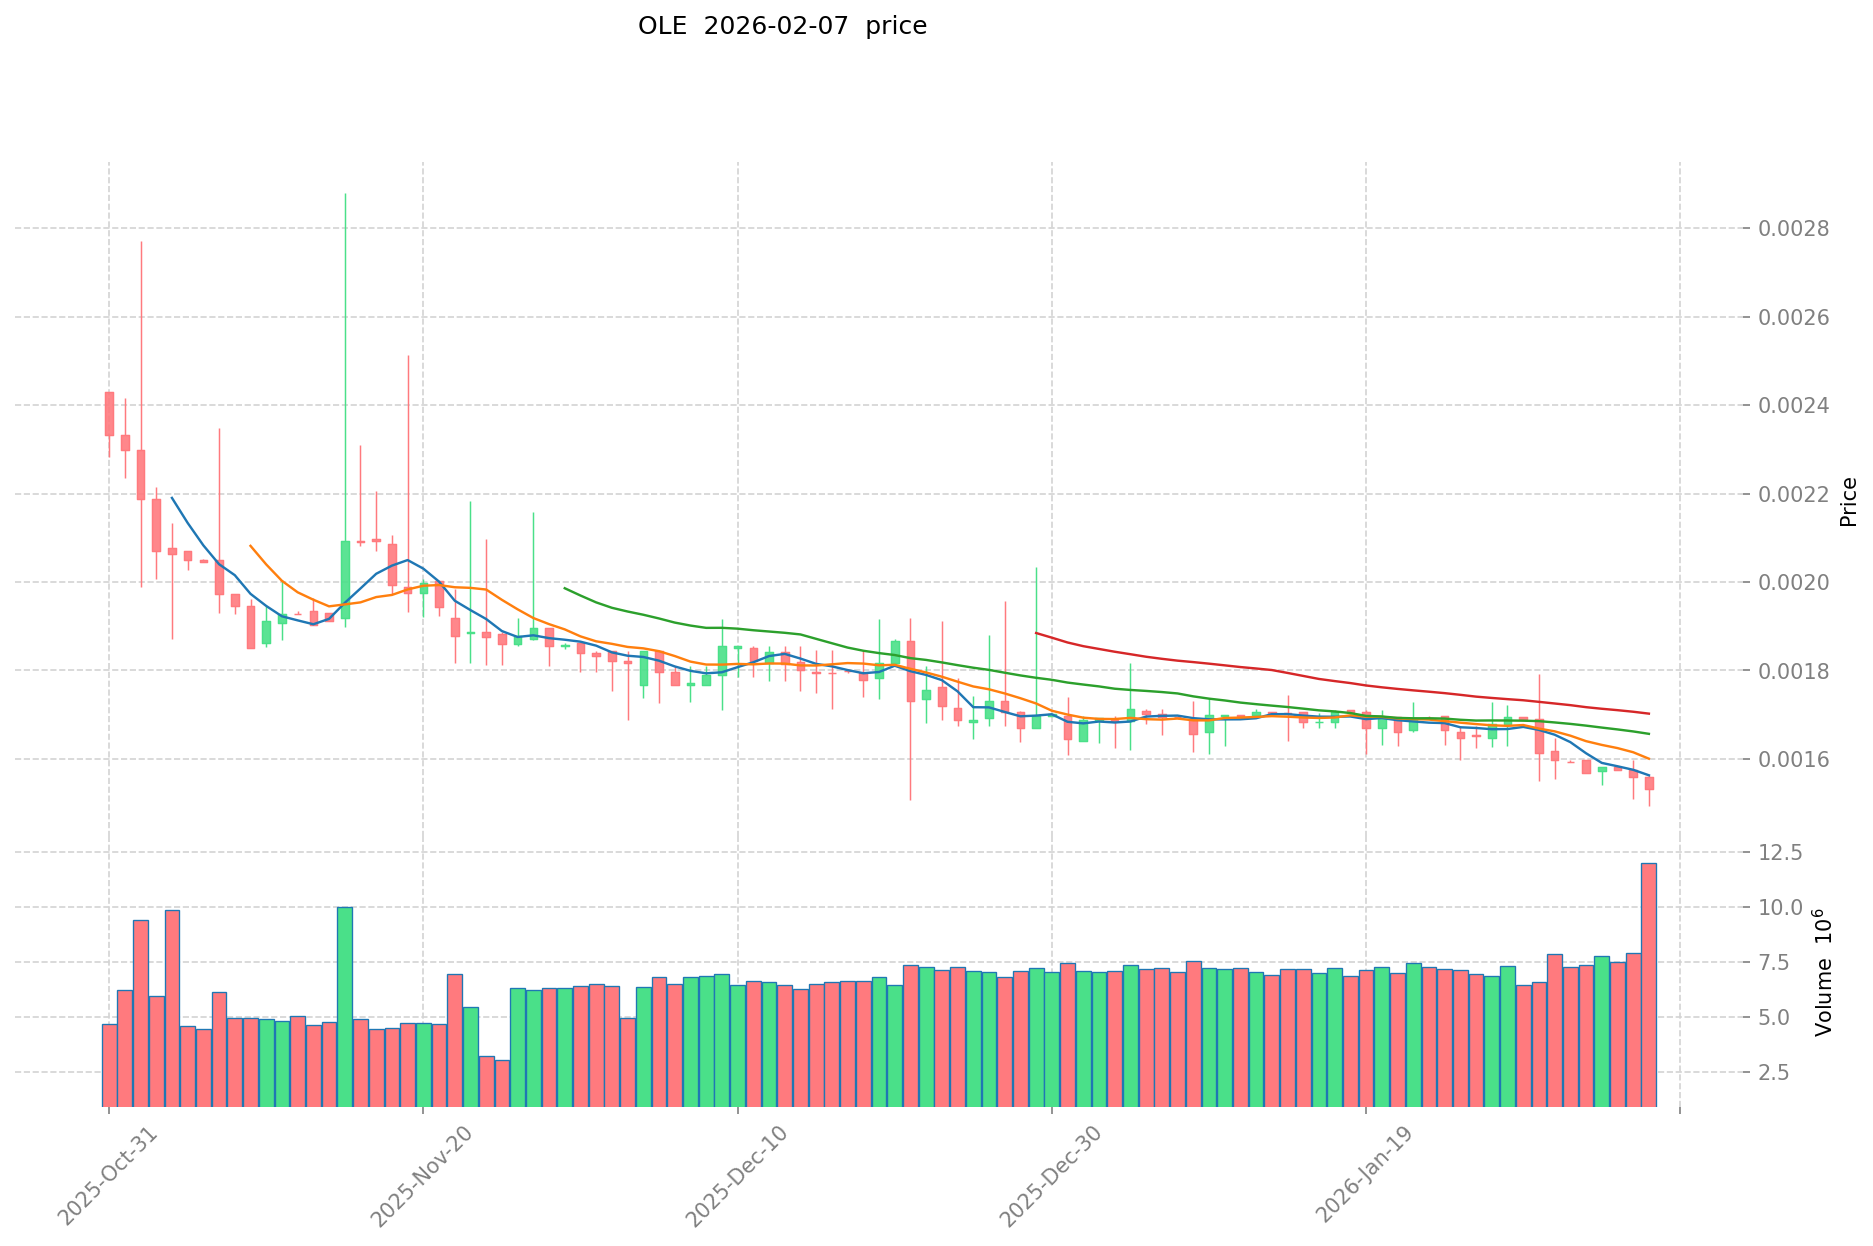
- 2026: Price movement continued with adjustment, reaching $0.001468 on February 7th
OLE Current Market Situation
As of February 7th, 2026, OLE is trading at $0.001544, with a 24-hour trading volume of $20,919.76. The token has shown a decline of 0.89% over the past 24 hours, with recent price movements indicating a downward trend of 0.26% in the last hour and 4.39% over the past week.
The current market capitalization stands at $291,245.60, with a circulating supply of 188,630,573 OLE tokens, representing 18.86% of the maximum supply of 1 billion tokens. The fully diluted market cap is positioned at $1,544,000.
OpenLeverage operates as a permissionless lending and margin trading protocol that enables traders to long or short trading pairs on decentralized exchanges. The protocol has been deployed across multiple blockchain networks and has processed over $700 million in trading volume, with a historical TVL of $14.5 million. The project was incubated by Binance Labs and Creative Destruction Lab, and has undergone security audits from PeckShield, Code4rena, and Certik.
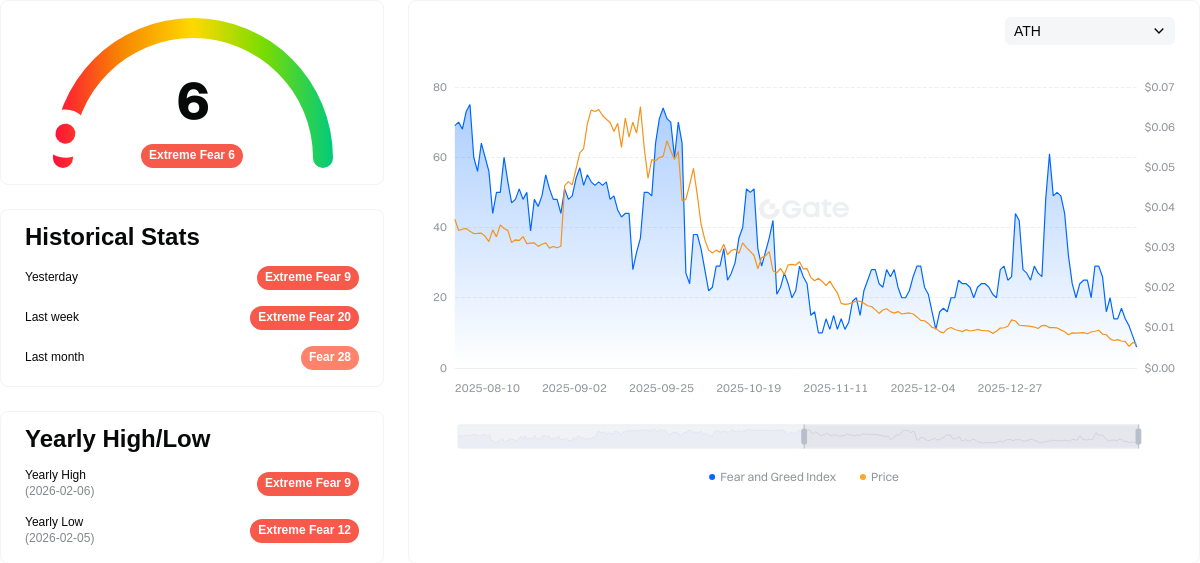
The broader cryptocurrency market sentiment index currently indicates a fear level of 6, suggesting cautious market conditions that may influence trading activity across digital assets.
Click to view current OLE market price
OLE Market Sentiment Indicator
2026-02-07 Fear and Greed Index: 6 (Extreme Fear)
Click to view current Fear & Greed Index
The cryptocurrency market is experiencing extreme fear conditions with the Fear and Greed Index reaching just 6 points. This exceptionally low reading indicates widespread investor panic and risk aversion across the market. Such extreme fear levels typically present contrarian opportunities for long-term investors, as markets often find support at sentiment extremes. However, caution remains advised as fear-driven volatility may continue. Monitor market fundamentals closely and consider dollar-cost averaging strategies during periods of pronounced panic.
OLE Holding Distribution
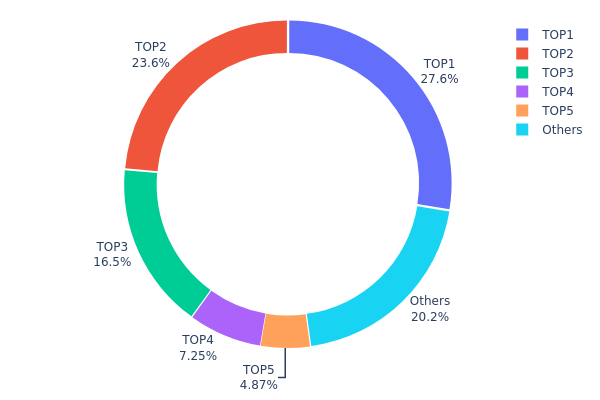
The holding distribution chart illustrates the concentration of OLE tokens across various wallet addresses, reflecting the degree of decentralization within the token's on-chain ecosystem. This metric serves as a critical indicator of market structure health, as it reveals whether token ownership is dispersed among numerous holders or concentrated in the hands of a few major participants.
Based on the current data, OLE exhibits a relatively high degree of concentration. The top five addresses collectively control approximately 79.75% of the total circulating supply, with the largest holder alone possessing 27.59%. The dominance of these major addresses, particularly the top three which account for 67.63%, suggests a centralized ownership structure that significantly deviates from the decentralized ideal typically sought in cryptocurrency projects.
This concentration pattern introduces notable structural risks to the market. The substantial holdings by top addresses create potential vulnerabilities to price manipulation, as large-scale sell-offs from any of these wallets could trigger significant market volatility. Additionally, the limited token distribution among the remaining addresses (only 20.25% held by "Others") indicates relatively low retail participation, which may constrain liquidity depth and increase susceptibility to sharp price fluctuations during periods of heightened trading activity.
Click to view current OLE Holding Distribution
| Top |
Address |
Holding Qty |
Holding (%) |
| 1 |
0x511d...c27e20 |
126289.10K |
27.59% |
| 2 |
0x6974...bfc524 |
107874.80K |
23.57% |
| 3 |
0xff4e...ec6cc3 |
75377.22K |
16.47% |
| 4 |
0xcffa...290703 |
33193.39K |
7.25% |
| 5 |
0x4634...eb9758 |
22288.35K |
4.87% |
| - |
Others |
92553.02K |
20.25% |
II. Core Factors Influencing OLE's Future Price
Supply Mechanism
- Token Supply Structure: OLE has a maximum supply of 1,000,000,000 tokens with a circulating supply of 188,630,580 OLE, representing approximately 18.86% of the total supply.
- Historical Pattern: The gradual release of tokens into circulation may create selling pressure, though specific unlock schedules were not detailed in available materials.
- Current Impact: With over 80% of tokens yet to enter circulation, future supply releases could influence price dynamics depending on vesting schedules and market absorption capacity.
Institutional and Major Holder Dynamics
Specific institutional holdings, enterprise adoption cases, and national-level policies regarding OLE were not mentioned in the provided materials.
Macroeconomic Environment
- Monetary Policy Impact: Market analysts note that momentum has become a significant factor affecting price movements across crypto markets. The broader cryptocurrency market trend directly correlates with OLE's price volatility.
- Market Sentiment: According to Saxo Bank's commodity strategy head Ole Hansen, the "fear of missing out" (FOMO) psychology plays a notable role when prices break through historical levels, which applies to the broader crypto space where OLE operates.
- Geopolitical Factors: Global uncertainty and geopolitical tensions have historically driven investors toward alternative assets, potentially benefiting cryptocurrency markets including tokens like OLE.
Technical Development and Ecosystem Building
- Project Fundamentals: OLE's development prospects depend significantly on the project's fundamental information and whether current market valuation reflects appropriate pricing levels.
- Application Scenarios: OpenLeverage's application scenarios may expand as the crypto market develops and the project progresses. Current use cases for OLE include community applications and ecosystem integration, though specific details require verification through official project channels.
- Market Demand: Whether OLE is worth investing requires comprehensive consideration of current market factors, including overall cryptocurrency market trends, project fundamentals, current market capitalization assessment, and appropriate entry price positions.
III. 2026-2031 OLE Price Prediction
2026 Outlook
- Conservative Forecast: $0.00122 - $0.00155
- Neutral Forecast: $0.00155 (average price scenario)
- Optimistic Forecast: $0.00172 (subject to favorable market conditions and increased adoption)
2027-2029 Mid-term Outlook
- Market Stage Expectation: The token may enter a gradual growth phase with moderate volatility as the project expands its ecosystem and user base
- Price Range Forecast:
- 2027: $0.00136 - $0.00198 (approximately 5% change from 2026 baseline)
- 2028: $0.00134 - $0.00197 (approximately 16% change from baseline)
- 2029: $0.00138 - $0.00253 (approximately 22% change from baseline)
- Key Catalysts: Ecosystem development, technological improvements, broader market sentiment, and potential partnership announcements could drive price movements during this period
2030-2031 Long-term Outlook
- Baseline Scenario: $0.00124 - $0.00285 in 2030 (assuming steady project development and stable market conditions)
- Optimistic Scenario: $0.00221 - $0.00288 by 2031 (assuming enhanced adoption and favorable regulatory environment)
- Transformative Scenario: Prices reaching $0.00288 or higher (contingent upon breakthrough developments, significant ecosystem expansion, or major institutional adoption)
- 2026-02-07: OLE trading within the projected range of $0.00122 - $0.00172 (based on current market positioning and early-year projections)
| Year |
Predicted High Price |
Predicted Average Price |
Predicted Low Price |
Price Change |
| 2026 |
0.00172 |
0.00155 |
0.00122 |
0 |
| 2027 |
0.00198 |
0.00163 |
0.00136 |
5 |
| 2028 |
0.00197 |
0.0018 |
0.00134 |
16 |
| 2029 |
0.00253 |
0.00189 |
0.00138 |
22 |
| 2030 |
0.00285 |
0.00221 |
0.00124 |
42 |
| 2031 |
0.00288 |
0.00253 |
0.00222 |
63 |
IV. OLE Professional Investment Strategies and Risk Management
OLE Investment Methodology
(1) Long-Term Holding Strategy
- Suitable for: Investors with moderate to high risk tolerance who believe in the DeFi lending and margin trading sector's long-term growth potential
- Operational Recommendations:
- Consider dollar-cost averaging during market downturns to reduce entry price volatility
- Monitor OpenLeverage protocol development milestones, including TVL growth and trading volume expansion beyond the current $700 million milestone
- Storage Solution: Utilize Gate Web3 Wallet for secure self-custody with multi-chain support for ETH and BSC networks
(2) Active Trading Strategy
- Technical Analysis Tools:
- Volume Analysis: Track the 24-hour trading volume ($20,919.76) relative to market cap ($291,245.60) to identify liquidity patterns
- Support/Resistance Levels: Monitor the 24-hour range ($0.001465-$0.001563) and historical price boundaries
- Swing Trading Considerations:
- The token has shown significant volatility with a 74.52% decline over one year, presenting both risks and opportunities for experienced traders
- Set strict stop-loss orders given the low liquidity relative to fully diluted valuation
OLE Risk Management Framework
(1) Asset Allocation Principles
- Conservative Investors: 0.5-1% of crypto portfolio allocation
- Aggressive Investors: 2-3% of crypto portfolio allocation
- Professional Investors: Up to 5% with active monitoring and hedging strategies
(2) Risk Hedging Solutions
- Portfolio Diversification: Balance OLE exposure with blue-chip DeFi tokens and stablecoins
- Position Sizing: Limit individual position size based on the token's low market dominance (0.000063%)
(3) Secure Storage Solutions
- Self-Custody Recommendation: Gate Web3 Wallet supports both Ethereum and BSC networks where OLE is deployed
- Multi-Signature Option: For institutional holdings, consider multi-sig wallets for enhanced security
- Security Precautions: Never share private keys; verify contract addresses (ETH: 0x1b6e9c73bee68102d9dd4a2627f97bff4183ab0a, BSC: 0xB7E2713CF55cf4b469B5a8421Ae6Fc0ED18F1467) before transactions
V. OLE Potential Risks and Challenges
OLE Market Risks
- Liquidity Risk: With only 18.86% of tokens in circulation and relatively low 24-hour trading volume, executing large orders may face significant slippage
- Volatility Risk: The token has experienced a 74.52% decline over the past year, indicating high price instability
- Market Cap Risk: Ranked 3545 with a market dominance of 0.000063%, the project faces intense competition in the DeFi lending space
OLE Regulatory Risks
- DeFi Protocol Scrutiny: Permissionless lending and margin trading protocols may face increased regulatory attention as global authorities develop clearer crypto frameworks
- Cross-Chain Compliance: Operating on multiple chains (Ethereum, BSC, KCC) may complicate compliance as different jurisdictions develop varying regulatory standards
- Leverage Product Regulation: Margin trading features could be subject to stricter oversight similar to traditional financial derivatives
OLE Technical Risks
- Smart Contract Vulnerabilities: Despite audits from PeckShield, Code4rena, and CertiK, complex DeFi protocols inherently carry smart contract exploitation risks
- DEX Dependency: The protocol's reliance on decentralized exchange liquidity means performance is tied to external DEX health and availability
- Multi-Chain Security: Deployment across multiple blockchains increases attack surface and requires continuous security monitoring
VI. Conclusion and Action Recommendations
OLE Investment Value Assessment
OpenLeverage presents a specialized opportunity within the DeFi margin trading sector, supported by incubation from notable institutions and security audits. However, the token faces significant headwinds including a 74.52% year-over-year decline, low circulating supply (18.86%), and minimal market dominance. The protocol's $700 million trading volume milestone and $14.5 million TVL demonstrate operational traction, but investors should weigh this against high volatility and liquidity constraints. Long-term value depends on continued protocol adoption and successful expansion of the lending pool ecosystem.
OLE Investment Recommendations
✅ Beginners: Approach with extreme caution; if interested, allocate no more than 0.5% of your crypto portfolio and prioritize education about DeFi lending mechanics before investing
✅ Experienced Investors: Consider small speculative positions (1-2% allocation) with strict stop-loss orders; actively monitor protocol metrics such as TVL growth and trading volume trends
✅ Institutional Investors: Conduct thorough due diligence on protocol security, competitive positioning, and team execution capability; consider waiting for improved liquidity conditions before establishing positions
OLE Trading Participation Methods
- Spot Trading: Available on Gate.com with ETH and BSC network support for deposits and withdrawals
- DCA Strategy: Implement systematic purchase plans to mitigate timing risk in volatile market conditions
- Protocol Participation: Engage directly with OpenLeverage platform for lending, borrowing, or margin trading to understand value proposition firsthand
Cryptocurrency investments carry extremely high risk, and this article does not constitute investment advice. Investors should make prudent decisions based on their own risk tolerance and are advised to consult professional financial advisors. Never invest more than you can afford to lose.
FAQ
OLE token reached an all-time high of $0.155627 on July 6, 2022, and an all-time low of $0.00153248 on December 21, 2025. As of February 7, 2026, OLE is trading between $0.00156145 and $0.00161895, showing strong recovery potential from recent lows.
What are the main factors affecting OLE price?
OLE price is primarily influenced by supply and demand dynamics, market sentiment, trading volume, adoption trends, and broader cryptocurrency market conditions. Platform activity and token utility also play significant roles in price movement.
How to conduct OLE price prediction analysis?
Analyze OLE price trends by examining historical data patterns, market supply and demand dynamics, ecosystem development progress, and macroeconomic factors. Monitor trading volume, community sentiment, and technological updates to identify growth potential and market opportunities for informed analysis.
What are OLE's future development prospects and price trend predictions?
OLE demonstrates strong growth potential driven by increasing demand for advanced display technology. As production scales and market matures, prices are expected to stabilize at higher levels. The cryptocurrency benefits from expanding institutional adoption and technological improvements in the ecosystem.
What risks should I pay attention to when investing in OLE?
OLE investment involves market volatility, price manipulation risks, regulatory uncertainty, and technical security concerns. Investors should carefully assess these factors before participating in the market.
* The information is not intended to be and does not constitute financial advice or any other recommendation of any sort offered or endorsed by Gate.