This comprehensive guide provides expert analysis of OpenOcean (OOE) price movements and detailed forecasts through 2031. The article examines OOE's current market position at $0.001556, analyzes historical price evolution, and evaluates core influencing factors including supply dynamics, macroeconomic conditions, and technological development. It presents multi-scenario price predictions ranging from $0.00121 to $0.00275 based on market conditions. Additionally, the guide outlines professional investment strategies including long-term holding and active trading approaches, establishes risk management frameworks for different investor profiles, and identifies key risks including high volatility, liquidity constraints, and regulatory uncertainties. The analysis includes secure storage recommendations via Gate Web3 Wallet and practical trading participation methods on Gate exchange, offering actionable insights for investors evaluating OOE's DeFi aggregation infrastructure potential.
Introduction: OOE's Market Position and Investment Value
OpenOcean (OOE) serves as a comprehensive aggregator for cryptocurrency trading across both decentralized and centralized exchanges, having emerged in 2021 to optimize trading routes through intelligent algorithms. As of 2026, OOE maintains a market capitalization of approximately $785,042, with a circulating supply of around 504.5 million tokens, and the price hovering near $0.001556. This asset, recognized for its cross-platform trading optimization capabilities, is playing an increasingly relevant role in enhancing liquidity accessibility and price discovery across the crypto ecosystem.
This article will comprehensively analyze OOE's price trajectory from 2026 to 2031, combining historical patterns, market supply-demand dynamics, ecosystem developments, and macroeconomic conditions to provide investors with professional price forecasts and practical investment strategies.
I. OOE Price History Review and Market Status
OOE Historical Price Evolution Trajectory
- 2021: Token launch at initial price of $0.335, reaching a peak of $1.034 on September 3rd, representing significant early adoption interest
- 2026: Market experienced substantial correction, with price declining approximately 76.57% year-over-year
OOE Current Market Situation
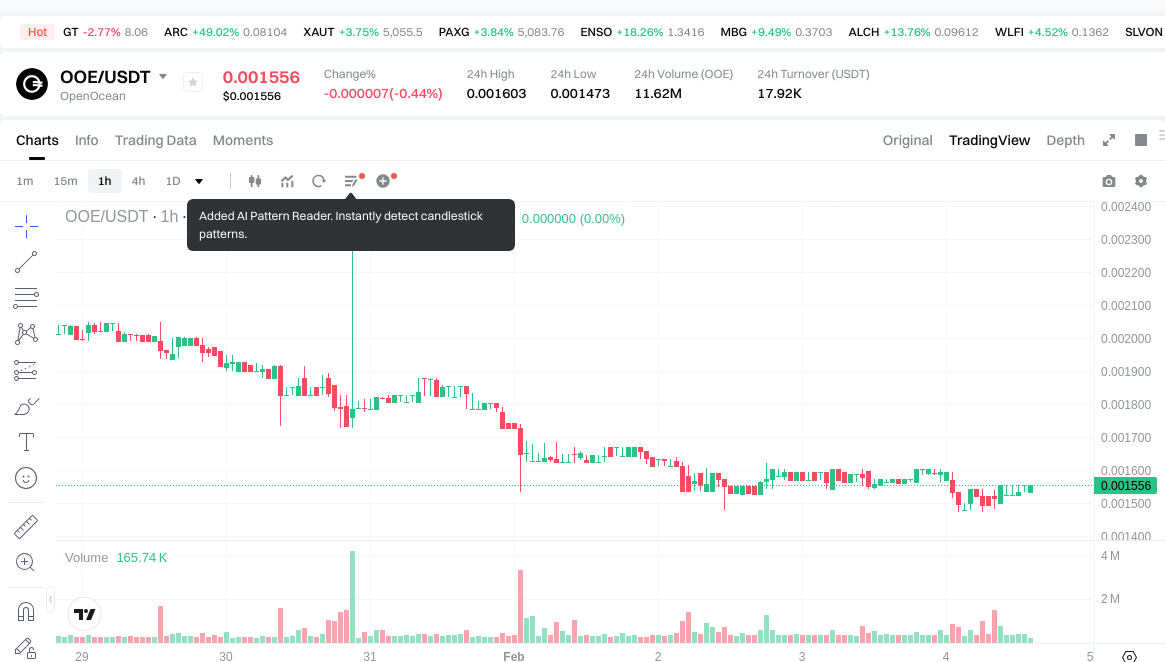
As of February 4, 2026, OOE is trading at $0.001556, with a 24-hour trading volume of $17,977.72. The token has experienced a 1.5% increase over the past hour, while showing a 1.08% decrease in the last 24 hours. Over the weekly timeframe, OOE has declined by 25.36%, and monthly performance indicates a 34.07% reduction.
The current market capitalization stands at $785,042, with 504,525,932 tokens in circulation, representing 50.45% of the total supply of 1 billion tokens. The fully diluted market cap is approximately $1.56 million. OOE maintains a market dominance of 0.000057%, with the token being traded across 3 exchanges and held by 8,093 addresses.
The 24-hour price range has fluctuated between $0.001473 and $0.001603. The broader market sentiment, as indicated by the VIX index at 14, suggests an environment of extreme fear among cryptocurrency investors.
Click to view current OOE market price
OOE Market Sentiment Index
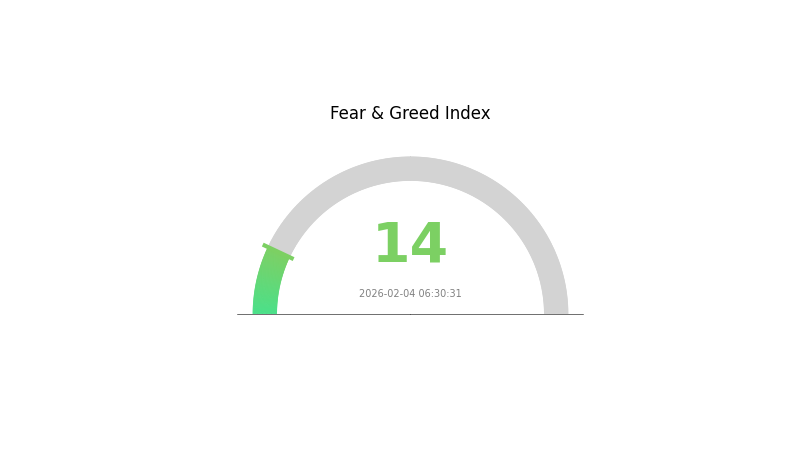
2026-02-04 Fear and Greed Index: 14 (Extreme Fear)
Click to view current Fear & Greed Index
The crypto market is currently experiencing extreme fear, with the Fear and Greed Index plummeting to 14. This reading indicates widespread pessimism and risk aversion among investors. During such periods, market sentiment is heavily bearish, and investors typically adopt defensive strategies. However, historically, extreme fear has often preceded market recoveries, as capitulation tends to mark local bottoms. Traders should remain cautious while monitoring potential entry opportunities, ensuring proper risk management before making investment decisions.
OOE Holdings Distribution
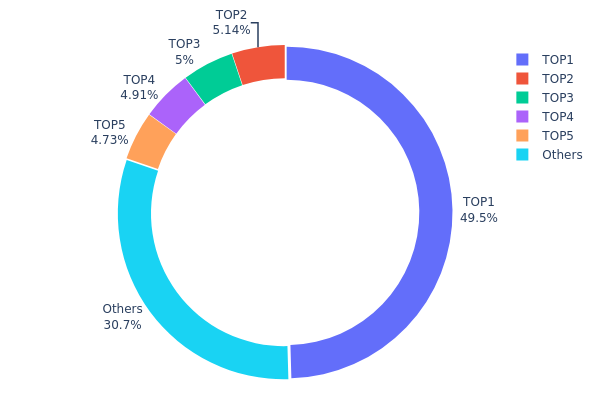
The holdings distribution chart serves as a critical metric for evaluating the decentralization level and structural stability of a cryptocurrency's on-chain ecosystem. By analyzing the concentration of tokens across different wallet addresses, this indicator reveals the power dynamics within the token economy and potential vulnerabilities in market structure. A highly concentrated distribution typically signals elevated risks of price manipulation and centralization, while a more dispersed pattern generally indicates healthier market maturity and broader community participation.
According to current on-chain data, OOE exhibits a significantly concentrated holdings structure. The top-ranking address controls 495,474.07K tokens, accounting for 49.54% of the total circulating supply—effectively holding nearly half of all tokens. The second through fifth largest addresses hold 5.13%, 5.00%, 4.91%, and 4.73% respectively. Cumulatively, the top five addresses control approximately 69.31% of the total supply, while all remaining addresses collectively hold only 30.69%. This distribution pattern reveals an extremely centralized token structure, far exceeding the concentration levels typical of mature cryptocurrency projects.
This high degree of centralization poses multiple potential risks to market stability. First, the dominant address holding nearly 50% of supply possesses substantial market influence, with the capacity to trigger significant price volatility through large-scale selling or strategic market operations. Second, such concentrated holdings may undermine investor confidence in the project's decentralization credentials, potentially affecting long-term valuation and adoption. From a market microstructure perspective, this distribution increases systemic fragility—any behavioral changes from major holders could trigger cascading effects across the broader market. Additionally, this concentration level suggests the project remains in relatively early development stages, lacking sufficient token distribution breadth and depth of community participation.
Click to view current OOE Holdings Distribution
| Top |
Address |
Holding Qty |
Holding (%) |
| 1 |
0x22aa...fd1097 |
495474.07K |
49.54% |
| 2 |
0x4982...6e89cb |
51366.73K |
5.13% |
| 3 |
0xe7af...394a5a |
50000.00K |
5.00% |
| 4 |
0x0d07...b492fe |
49103.38K |
4.91% |
| 5 |
0xc639...eeddb2 |
47303.31K |
4.73% |
| - |
Others |
306752.52K |
30.69% |
II. Core Factors Influencing OOE's Future Price
Supply Mechanism
- Market Demand and Supply Balance: The future price trajectory of OOE is significantly influenced by the fundamental dynamics of market demand and available supply. As market demand experiences growth, upward pressure on pricing typically emerges.
- Historical Patterns: Historical market data suggests that periods of supply constraints combined with rising demand have consistently led to price appreciation across similar asset classes.
- Current Impact: Market participants anticipate that evolving supply dynamics, coupled with expanding adoption, may contribute to positive price momentum in the medium term.
Institutional and Major Holder Dynamics
- Institutional Positioning: While specific institutional holdings data for OOE remains limited in available materials, broader market trends indicate growing institutional interest in digital assets, which could potentially extend to emerging tokens.
- Market Competition: The competitive landscape among market participants and the stability of supply chain infrastructure are expected to play important roles in shaping price behavior over extended time horizons.
Macroeconomic Environment
- Economic Volatility: Market analysis indicates that digital assets may experience heightened sensitivity to macroeconomic fluctuations in the near term, though they could benefit from broader market recovery trends over longer periods.
- Cost Structure Dynamics: Production costs and operational efficiency improvements remain key considerations for price formation, with technological advancements potentially reducing cost pressures over time.
Technological Development and Ecosystem Building
- Technological Innovation: Expected technological innovations represent a significant potential driver for OOE's value proposition. Advances in underlying technology could enhance utility and adoption rates.
- Market Demand Growth: Expanding use cases and growing market acceptance may provide fundamental support for price appreciation, particularly as ecosystem development progresses and practical applications increase.
- Long-term Market Competition: The evolving competitive landscape and supply chain reliability will likely influence price stability and growth potential as the market matures.
III. 2026-2031 OOE Price Forecast
2026 Outlook
- Conservative prediction: $0.00121 - $0.00156
- Neutral prediction: $0.00156 (average market conditions)
- Optimistic prediction: $0.00213 (requires favorable market sentiment and increased adoption)
2027-2029 Outlook
- Market stage expectation: Gradual growth phase with moderate volatility, driven by ecosystem development and community expansion
- Price range predictions:
- 2027: $0.00144 - $0.0019 (18% growth)
- 2028: $0.00095 - $0.00193 (20% growth)
- 2029: $0.00169 - $0.00256 (22% growth)
- Key catalysts: Enhanced market recognition, potential technological improvements, and broader cryptocurrency market trends
2030-2031 Long-term Outlook
- Baseline scenario: $0.00185 - $0.00223 (assuming stable market conditions and continued project development)
- Optimistic scenario: $0.00248 - $0.00272 (assuming accelerated adoption and positive regulatory environment)
- Transformative scenario: $0.00275 (requires exceptional market conditions, breakthrough partnerships, and widespread mainstream acceptance)
- 2026-02-04: OOE trading within $0.00121 - $0.00213 range (early growth phase with potential upward momentum over the forecast period)
| Year |
Predicted High Price |
Predicted Average Price |
Predicted Low Price |
Price Change |
| 2026 |
0.00213 |
0.00156 |
0.00121 |
0 |
| 2027 |
0.0019 |
0.00184 |
0.00144 |
18 |
| 2028 |
0.00193 |
0.00187 |
0.00095 |
20 |
| 2029 |
0.00256 |
0.0019 |
0.00169 |
22 |
| 2030 |
0.00272 |
0.00223 |
0.00185 |
43 |
| 2031 |
0.00275 |
0.00248 |
0.00191 |
59 |
IV. OOE Professional Investment Strategy and Risk Management
OOE Investment Methodology
(1) Long-term Holding Strategy
- Suitable for: Investors who believe in the DeFi aggregation sector and OpenOcean's cross-chain trading infrastructure
- Operational recommendations:
- Consider accumulating positions during market downturns when technical indicators show oversold conditions
- Monitor OpenOcean's platform development progress and trading volume growth as key holding metrics
- Implement secure storage solutions such as Gate Web3 Wallet for long-term asset custody
(2) Active Trading Strategy
- Technical analysis tools:
- Moving Averages: Use 50-day and 200-day moving averages to identify trend directions and potential entry/exit points
- RSI Indicator: Monitor relative strength index to identify overbought (above 70) or oversold (below 30) conditions for timing trades
- Swing trading considerations:
- Pay attention to OOE's correlation with broader DeFi sector movements and overall crypto market sentiment
- Set stop-loss orders at 8-12% below entry points to manage downside risk in volatile conditions
OOE Risk Management Framework
(1) Asset Allocation Principles
- Conservative investors: 1-3% of crypto portfolio allocation
- Aggressive investors: 5-8% of crypto portfolio allocation
- Professional investors: Up to 10-15% with active hedging strategies
(2) Risk Hedging Solutions
- Diversification approach: Combine OOE holdings with established DeFi blue-chip tokens to reduce sector-specific risk
- Position sizing discipline: Never allocate more than you can afford to lose, considering OOE's volatility profile
(3) Secure Storage Solutions
- Hot wallet recommendation: Gate Web3 Wallet for active trading and staking participation
- Cold storage approach: For long-term holdings exceeding $10,000, consider hardware wallet solutions with multi-signature capabilities
- Security precautions: Enable two-factor authentication, verify contract addresses before transactions, and never share private keys or seed phrases
V. OOE Potential Risks and Challenges
OOE Market Risks
- High volatility: OOE has experienced significant price fluctuations, with 30-day decline of 34.07% and 1-year decline of 76.57%, indicating substantial downside risk
- Liquidity concerns: With 24-hour trading volume of approximately $17,978, limited liquidity may result in wider bid-ask spreads and slippage during large transactions
- Market sentiment dependency: As a DeFi aggregator token, OOE's price performance correlates strongly with overall DeFi sector sentiment and adoption trends
OOE Regulatory Risks
- DeFi regulatory uncertainty: Evolving regulatory frameworks for decentralized finance protocols may impact OpenOcean's operations and OOE token utility
- Cross-border compliance: As a global aggregation platform, OpenOcean may face varying regulatory requirements across different jurisdictions
- Token classification: Potential regulatory scrutiny regarding OOE's classification as utility versus security token could affect its trading status
OOE Technical Risks
- Smart contract vulnerabilities: As with all DeFi protocols, smart contract bugs or exploits could compromise user funds and platform integrity
- Aggregation complexity: Technical challenges in maintaining optimal routing algorithms across multiple DEXs and CEXs may affect platform competitiveness
- Integration dependencies: Reliance on third-party exchanges and blockchain networks creates systemic risks if underlying infrastructure experiences disruptions
VI. Conclusion and Action Recommendations
OOE Investment Value Assessment
OpenOcean (OOE) represents a specialized DeFi infrastructure play focused on trade aggregation across decentralized and centralized exchanges. While the project offers utility through protocol governance, fee subsidies, and liquidity mining, investors should weigh the long-term value proposition of cross-chain aggregation technology against substantial short-term risks evidenced by significant price declines and limited trading liquidity. The token's utility across multiple functions including VIP membership and collateral usage provides fundamental support, but market conditions and competitive dynamics require careful monitoring.
OOE Investment Recommendations
✅ Beginners: Limit exposure to 1-2% of total crypto portfolio; focus on understanding DeFi aggregation concepts before investing; use only funds you can afford to lose entirely
✅ Experienced investors: Consider strategic positions of 3-5% during technical oversold conditions; implement strict stop-loss disciplines; monitor OpenOcean's platform metrics and partnership developments
✅ Institutional investors: Evaluate OOE as part of broader DeFi infrastructure exposure with hedging strategies; conduct thorough due diligence on smart contract audits and team credentials; consider phased accumulation approach
OOE Trading Participation Methods
- Spot trading: Purchase OOE directly on Gate.com and other supporting exchanges for immediate ownership and utility access
- Liquidity provision: Participate in liquidity mining programs on OpenOcean platform to earn additional rewards while supporting trading infrastructure
- Dollar-cost averaging: Implement systematic purchasing strategy over time to mitigate timing risk and reduce average entry price volatility
Cryptocurrency investment carries extreme risk, and this article does not constitute investment advice. Investors should make prudent decisions based on their own risk tolerance and are advised to consult professional financial advisors. Never invest more than you can afford to lose.
FAQ
What is OOE token? What are its uses and application scenarios?
OOE token is a digital asset enabling payments and transactions within its ecosystem. It facilitates user engagement, incentive mechanisms, and community participation across various platforms and decentralized applications.
What is OOE's historical price trend? What are the main factors affecting its price movements?
OOE's price has experienced significant volatility influenced by market sentiment and overall cryptocurrency market trends. Key factors include market demand, trading volume, platform developments, and broader crypto market conditions.
What is the OOE price prediction for 2024? What are professional analysts' views on its future prospects?
While 2024 predictions are outdated, experts anticipated OOE growth through 2025. Current trading price stands at $0.002075. Analysts remain bullish on OOE's potential as a multi-chain DeFi aggregator with strong utility fundamentals driving long-term value appreciation.
What risks does investing in OOE involve? How to assess its investment value?
OOE investment carries market volatility, regulatory, and operational risks. Evaluate value by analyzing financial health, revenue growth trends, market competition, and regulatory compliance. Monitor trading volume and price movements to make informed decisions.
How does OOE compare to mainstream cryptocurrencies like BTC and ETH in terms of advantages and disadvantages?
OOE offers faster transaction speeds and lower fees compared to BTC and ETH, with superior scalability. However, it has a smaller market cap and less mature ecosystem, facing intense competition from established blockchains.
* The information is not intended to be and does not constitute financial advice or any other recommendation of any sort offered or endorsed by Gate.