This comprehensive analysis examines Polkamarkets (POLK) price dynamics and investment outlook through 2031. POLK, a DeFi-powered prediction market protocol built on Polkadot infrastructure, currently trades near historical lows at $0.003844 with a market cap of $384,400. The article synthesizes historical price patterns, market sentiment indicators showing extreme fear (index at 9), and token distribution metrics to project price ranges: conservative $0.00331-$0.00384 for 2026, with potential growth trajectory reaching $0.00496-$0.00848 by 2031 under optimistic scenarios. Key sections address macroeconomic influences, regulatory considerations, and actionable trading strategies via Gate, complemented by detailed risk management frameworks and security recommendations for diverse investor profiles.
Introduction: POLK's Market Position and Investment Value
Polkamarkets (POLK), as a DeFi-powered prediction market protocol built for cross-chain information exchange and trading, has been operational since its launch in 2021. As of 2026, POLK maintains a market capitalization of approximately $384,400, with a circulating supply of 100 million tokens and a current price hovering around $0.003844. This asset, positioned as a decentralized prediction market platform based on Polkadot's interoperable infrastructure, enables users to take positions on real-world event outcomes in a trustless environment.
This article will comprehensively analyze POLK's price trajectory from 2026 to 2031, combining historical patterns, market supply-demand dynamics, ecosystem development, and macroeconomic factors to provide investors with professional price forecasts and practical investment strategies.
I. POLK Price History Review and Market Status
POLK Historical Price Evolution Trajectory
- 2021: POLK reached a significant price milestone of $4.18 on March 16, marking an important early-stage peak for the project
- 2021-2025: The token experienced substantial price adjustments from its historical high, reflecting broader market cycles and evolving market conditions
- 2026: POLK recorded its historical low price of $0.00343311 on February 6, representing significant downward movement from previous levels
POLK Current Market Status
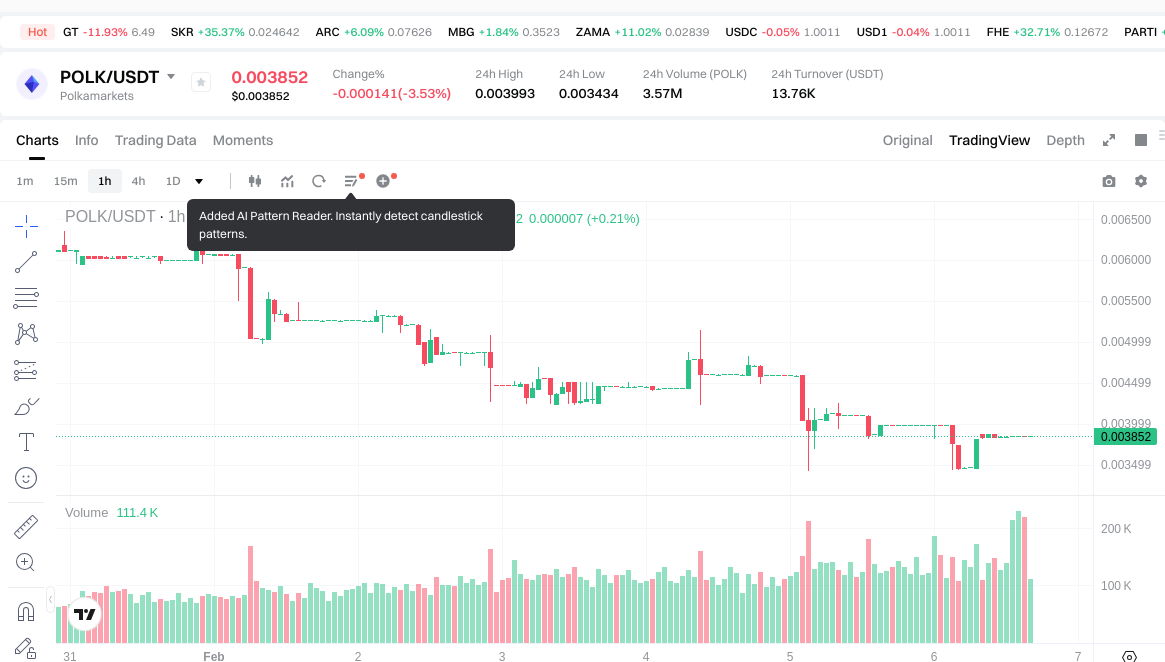
As of February 6, 2026, POLK is trading at $0.003844, representing a position near its historical low range. The token has experienced notable price movements across various timeframes, with a decrease of 3.31% over the past 24 hours.
Looking at broader timeframes, POLK has declined 41.37% over the past 7 days and 48.07% over the past 30 days. The annual performance shows a decrease of 66.60% compared to one year prior. The 24-hour trading volume stands at $13,702.38, with intraday price fluctuations between $0.003434 and $0.003993.
The token maintains a fully circulating supply of 100,000,000 POLK tokens, with market capitalization and fully diluted valuation both at $384,400. Currently, POLK holds a market dominance of 0.000016%, with the token being held by 8,814 addresses.
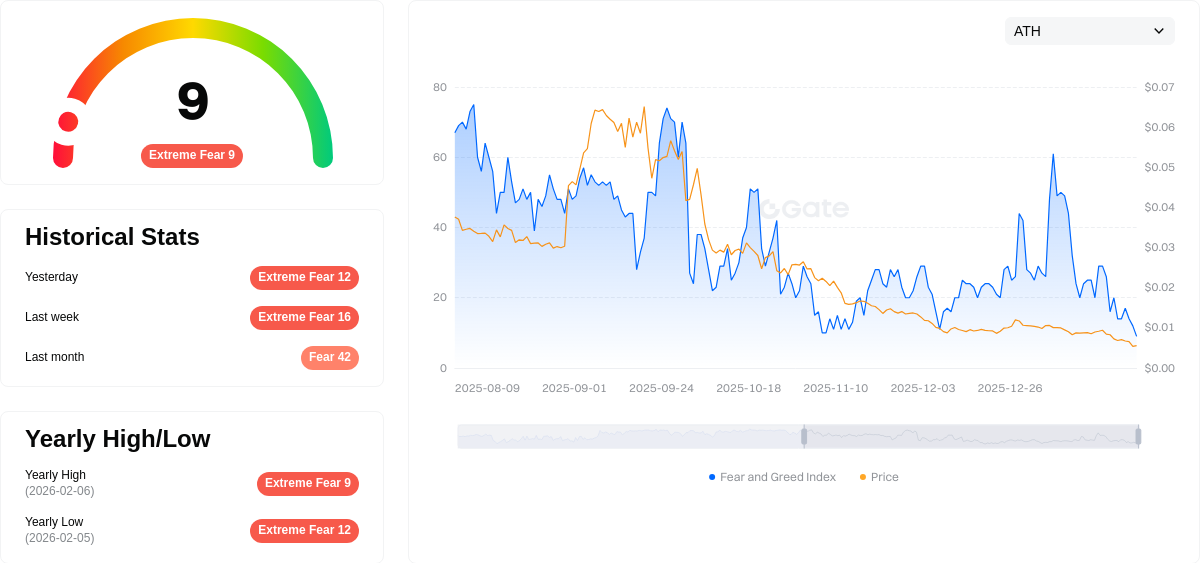
The cryptocurrency market sentiment index currently registers at 9, indicating an extreme fear environment, which may be influencing broader market dynamics and price movements.
Click to view current POLK market price
POLK Market Sentiment Index
2026-02-06 Fear and Greed Index: 9 (Extreme Fear)
Click to view current Fear & Greed Index
The crypto market is experiencing extreme fear with the Fear and Greed Index at just 9 points. This exceptionally low reading indicates widespread pessimism and risk aversion among investors. Such extreme fear conditions often create significant buying opportunities for contrarian traders and long-term holders. Market participants should remain cautious while monitoring for potential reversal signals. Historical data suggests that extreme fear periods frequently precede market recoveries. Consider dollar-cost averaging strategies during such volatile downturns to build positions at lower valuations.
POLK Holdings Distribution
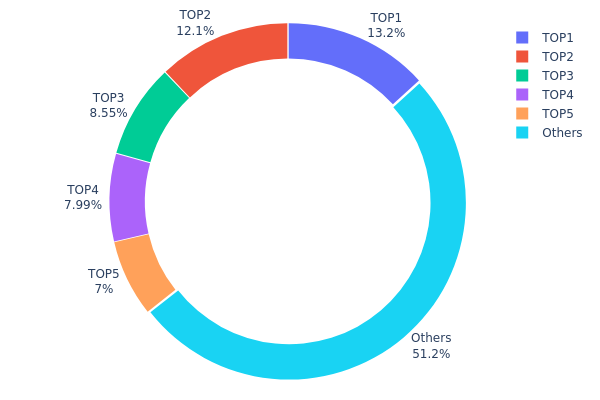
The holdings distribution chart illustrates the concentration of POLK tokens across different wallet addresses, providing insight into the decentralization level and potential market control by major holders. This metric is crucial for assessing the health of token distribution and identifying potential risks associated with centralized ownership.
Based on current data, POLK exhibits a moderate level of concentration among top holders. The largest address controls 13.18% of the total supply (13,187.92K tokens), while the top five addresses collectively hold approximately 48.8% of the circulating supply. The remaining 51.2% is distributed among other addresses, indicating a relatively balanced distribution structure. This concentration level falls within a reasonable range for emerging crypto assets, neither excessively centralized nor completely dispersed.
From a market structure perspective, this distribution pattern presents both stability and volatility potential. The significant holdings by top addresses could provide price support during market downturns, as these major holders typically have long-term investment horizons. However, the concentrated ownership also introduces the risk of substantial price swings if any top holder decides to liquidate their position. The fact that over half of the supply remains distributed among smaller holders suggests decent liquidity and trading activity, which helps mitigate manipulation risks while maintaining healthy market dynamics.
Click to view current POLK Holdings Distribution
| Top |
Address |
Holding Qty |
Holding (%) |
| 1 |
0x53c6...0a87ce |
13187.92K |
13.18% |
| 2 |
0x34b8...30cd43 |
12097.11K |
12.09% |
| 3 |
0x0d07...b492fe |
8546.62K |
8.54% |
| 4 |
0xdb6f...82019a |
7990.21K |
7.99% |
| 5 |
0x4bb7...71e25e |
7000.13K |
7.00% |
| - |
Others |
51178.01K |
51.2% |
II. Core Factors Influencing POLK's Future Price
Market Sentiment and Adoption
- Market Demand: Price volatility is influenced by market sentiment and adoption trends. Historical data shows POLK reached a peak price of $4.18 on March 16, 2021, while the lowest point was $0.00561973 on April 9, 2025, reflecting significant market sentiment shifts.
- Adoption Dynamics: The level of adoption and integration within the prediction markets ecosystem may impact POLK's value trajectory.
- External Economic Factors: Overall economic conditions and macroeconomic trends play a role in shaping investor behavior and price movements.
Macroeconomic Environment
- Monetary Policy Impact: Broader economic policies and central bank decisions can affect cryptocurrency markets, including POLK, by influencing liquidity and investor risk appetite.
- Economic Uncertainty: External economic factors, including inflation expectations and global financial conditions, may drive investors toward or away from digital assets.
- Geopolitical Factors: International developments and regulatory changes can create volatility in cryptocurrency markets, affecting POLK's price performance.
Industry Trends and Policy Changes
- Regulatory Landscape: Investors should monitor evolving regulations and policy developments that may impact prediction market platforms and associated tokens.
- Market Positioning: POLK's position within the prediction markets sector and its competitive advantages or challenges may influence long-term price trends.
- Technological Developments: Innovations and upgrades within the Polkamarkets ecosystem could affect user adoption and token utility.
III. 2026-2031 POLK Price Predictions
2026 Outlook
- Conservative prediction: $0.00331 - $0.00384
- Neutral prediction: $0.00384 (average scenario)
- Optimistic prediction: $0.00465 (requires favorable market conditions and increased adoption)
2027-2029 Outlook
- Market stage expectation: POLK is anticipated to enter a phase of moderate volatility with gradual upward momentum as the project matures and potentially expands its ecosystem partnerships.
- Price range predictions:
- 2027: $0.00302 - $0.00446 (approximately 10% change from 2026 baseline)
- 2028: $0.0037 - $0.00583 (approximately 13% change, reflecting continued development)
- 2029: $0.00458 - $0.0056 (approximately 32% change, suggesting stronger momentum)
- Key catalysts: Progressive ecosystem development, potential technological upgrades, broader market recovery trends, and increasing utility within the Polkadot network could serve as primary drivers for price appreciation during this period.
2030-2031 Long-term Outlook
- Baseline scenario: $0.00353 - $0.00722 (assuming steady project development and moderate market conditions through 2030)
- Optimistic scenario: $0.00496 - $0.00848 (assuming enhanced adoption, successful network upgrades, and favorable regulatory environment by 2031)
- Transformative scenario: Potential to approach the upper range of $0.00848 by 2031 (requires exceptional market conditions, breakthrough partnerships, and significant expansion of use cases, representing approximately 63% growth from baseline)
- February 6, 2026: POLK trades within the $0.00331 - $0.00465 range (establishing foundation for potential multi-year growth trajectory)
| Year |
Predicted High Price |
Predicted Average Price |
Predicted Low Price |
Price Change |
| 2026 |
0.00465 |
0.00384 |
0.00331 |
0 |
| 2027 |
0.00446 |
0.00425 |
0.00302 |
10 |
| 2028 |
0.00583 |
0.00435 |
0.0037 |
13 |
| 2029 |
0.0056 |
0.00509 |
0.00458 |
32 |
| 2030 |
0.00722 |
0.00535 |
0.00353 |
39 |
| 2031 |
0.00848 |
0.00628 |
0.00496 |
63 |
IV. POLK Professional Investment Strategies and Risk Management
POLK Investment Methodology
(I) Long-Term Holding Strategy
- Suitable for: Investors with high risk tolerance who believe in the long-term value of decentralized prediction markets and Polkadot ecosystem development
- Operational Recommendations:
- Consider accumulating positions during market downturns, as POLK has declined approximately 66.60% over the past year
- Monitor Polkamarkets platform development milestones and user adoption metrics
- Storage Solution: Use Gate Web3 Wallet for secure custody, supporting ERC-20 tokens with multi-layer security features
(II) Active Trading Strategy
- Technical Analysis Tools:
- Volume Analysis: Current 24-hour trading volume stands at approximately $13,702, monitor volume spikes for potential breakout signals
- Support and Resistance Levels: Key support near $0.00343 (historical low), resistance around $0.00399 (24-hour high)
- Swing Trading Points:
- Watch for price consolidation patterns within the $0.0034-$0.0040 range
- Consider short-term volatility, with recent 7-day decline of 41.37% indicating potential oversold conditions
POLK Risk Management Framework
(I) Asset Allocation Principles
- Conservative Investors: 1-2% of crypto portfolio allocation
- Aggressive Investors: 3-5% of crypto portfolio allocation
- Professional Investors: Up to 5-8% with active monitoring and hedging strategies
(II) Risk Hedging Solutions
- Position Sizing: Never allocate more than recommended percentages to mitigate total loss risk
- Stop-Loss Implementation: Set stop-loss orders 10-15% below entry points for active positions
(III) Secure Storage Solutions
- Software Wallet Recommendation: Gate Web3 Wallet provides convenient access for active traders with enhanced security protocols
- Security Best Practices: Enable two-factor authentication, use strong passwords, regularly backup wallet credentials, and never share private keys
V. POLK Potential Risks and Challenges
POLK Market Risks
- High Volatility: POLK experienced a 41.37% decline over 7 days and 48.07% over 30 days, indicating substantial price instability
- Low Liquidity: With a market cap of approximately $384,400 and ranking at #3234, limited liquidity may result in significant slippage during large trades
- Limited Exchange Availability: Currently listed on only 1 exchange, reducing trading accessibility and price discovery efficiency
POLK Regulatory Risks
- Prediction Market Scrutiny: Decentralized prediction markets may face regulatory challenges in jurisdictions with strict gambling or financial forecasting regulations
- Token Classification Uncertainty: Evolving regulatory frameworks may impact POLK's classification and legal status in different regions
- Compliance Requirements: Future regulatory developments may impose additional compliance obligations on the Polkamarkets platform
POLK Technical Risks
- Smart Contract Vulnerabilities: As with all DeFi protocols, potential undiscovered bugs in smart contracts could expose user funds to risks
- Blockchain Dependency: Platform performance and security rely on underlying blockchain infrastructure stability
- Platform Adoption Risk: User adoption remains crucial for POLK's utility value; low engagement could impact token demand
VI. Conclusion and Action Recommendations
POLK Investment Value Assessment
POLK operates within the niche decentralized prediction market sector on the Polkadot ecosystem. While the concept offers potential for cross-chain information exchange, investors should note significant challenges: the token has declined 66.60% over the past year, currently trading near historical lows at approximately $0.00384, with a relatively small market capitalization of $384,400. The limited exchange availability and low trading volume suggest constrained liquidity. Long-term value depends on successful platform development, user adoption growth, and broader acceptance of decentralized prediction markets. Short-term risks include continued price volatility, regulatory uncertainties, and competition within the DeFi space.
POLK Investment Recommendations
✅ Beginners: Avoid significant exposure; if interested in the prediction market sector, allocate no more than 1% of total crypto portfolio and thoroughly research DeFi risks first
✅ Experienced Investors: Consider small speculative positions (2-3% allocation) while monitoring platform developments and market recovery signals; employ strict risk management protocols
✅ Institutional Investors: Conduct comprehensive due diligence on platform metrics, smart contract audits, and regulatory landscape; any position should be part of a diversified DeFi portfolio strategy
POLK Trading Participation Methods
- Spot Trading: Purchase POLK directly on Gate.com with various trading pairs for immediate ownership
- Dollar-Cost Averaging: Accumulate positions gradually over time to mitigate timing risk in volatile markets
- Portfolio Integration: Include POLK as part of a broader Polkadot ecosystem or DeFi-focused investment strategy
Cryptocurrency investment carries extremely high risks; this article does not constitute investment advice. Investors should make prudent decisions based on their own risk tolerance and are advised to consult professional financial advisors. Never invest more than you can afford to lose.
FAQ
What are the price predictions for POLK token in 2024 and 2025?
Based on market trends and technical developments, POLK token price is projected to range between 0.17-0.89 USD in 2025. 2024 predictions were not publicly disclosed. Actual prices depend on market conditions and ecosystem upgrades.
What is POLK's historical price trend? What are the main factors affecting its price?
POLK's price has been shaped by market sentiment, trading volume, and technological developments. Key factors include macroeconomic conditions such as interest rates, user adoption trends, and overall crypto market dynamics. These elements collectively influence POLK's price movements in the market.
What are the risks of investing in POLK tokens? How should I evaluate its investment value?
POLK faces market volatility and technical risks. Evaluate its value by analyzing market demand, project development, trading volume, and community adoption. Strong fundamentals suggest positive long-term potential.
What are the advantages and disadvantages of POLK compared to other similar cryptocurrencies?
POLK advantages: strong community support, backing from reputable investors, growth potential within Polkadot ecosystem. Disadvantages: faces competition from established cryptocurrencies, market saturation, regulatory uncertainties affecting expansion.
What is the fundamentals of POLK project? How is the team background and technical strength?
POLK project is managed by CStone Pharma with a strong team background in biotechnology and clinical development. The team possesses robust technical capabilities in pharmaceutical research, demonstrated through advanced pipeline development and successful clinical trial execution.
What are professional analysts' views on POLK's future prospects?
Professional analysts view POLK's future positively, driven by its expertise in legal services and regulatory compliance. SEC regulatory initiatives are expected to enhance its market position, with POLK playing a significant role in global standardization of compliance standards.
* The information is not intended to be and does not constitute financial advice or any other recommendation of any sort offered or endorsed by Gate.