This comprehensive analysis examines Router Protocol (ROUTE) token's price dynamics and investment potential through 2031. Currently trading at $0.001375 with a market cap of approximately $892,016, ROUTE serves as a critical chain abstraction infrastructure enabler. The article synthesizes historical price trends, supply mechanisms, and ecosystem development to project ROUTE could reach $0.00315 average by 2031 with potential highs of $0.00334. Key sections cover market sentiment assessment, holding distribution analysis revealing 46.98% concentration in top five addresses, technological developments, and detailed price forecasts across conservative, neutral, and optimistic scenarios. Practical investment methodologies include long-term accumulation strategies and active trading techniques, complemented by comprehensive risk management frameworks addressing volatility, liquidity constraints, and regulatory uncertainties. Suitable for investors seeking structured guidance on ROUTE exposure through Gate exchan
Introduction: ROUTE's Market Position and Investment Value
Router Protocol (ROUTE), as a chain abstraction protocol enabling developers to build intent-based products for seamless cross-chain transfers and messaging, has been advancing interoperability solutions in the blockchain ecosystem since its inception. As of 2026, ROUTE maintains a market capitalization of approximately $892,016, with a circulating supply of around 648.74 million tokens, and the price stabilizes around $0.001375. This asset, positioned as a "cross-chain infrastructure enabler," is playing an increasingly critical role in facilitating secure, decentralized, and permissionless multi-chain interactions.
This article will comprehensively analyze ROUTE's price trends from 2026 to 2031, combining historical patterns, market supply and demand dynamics, ecosystem development, and macroeconomic environment factors to provide investors with professional price forecasts and practical investment strategies.
I. ROUTE Price History Review and Market Status
ROUTE Historical Price Evolution
- 2024: Router Protocol launched trading activities with an initial offering price of $0.04. The token experienced significant volatility throughout the year, reaching a notable price level of $0.08108 in November 2024.
- 2025: The market entered a period of substantial adjustment, with price levels declining from previous highs as broader market conditions shifted.
- 2026: Price continued its downward trajectory, touching $0.0013 in early February 2026, representing a considerable contraction from previous peak levels.
ROUTE Current Market Status
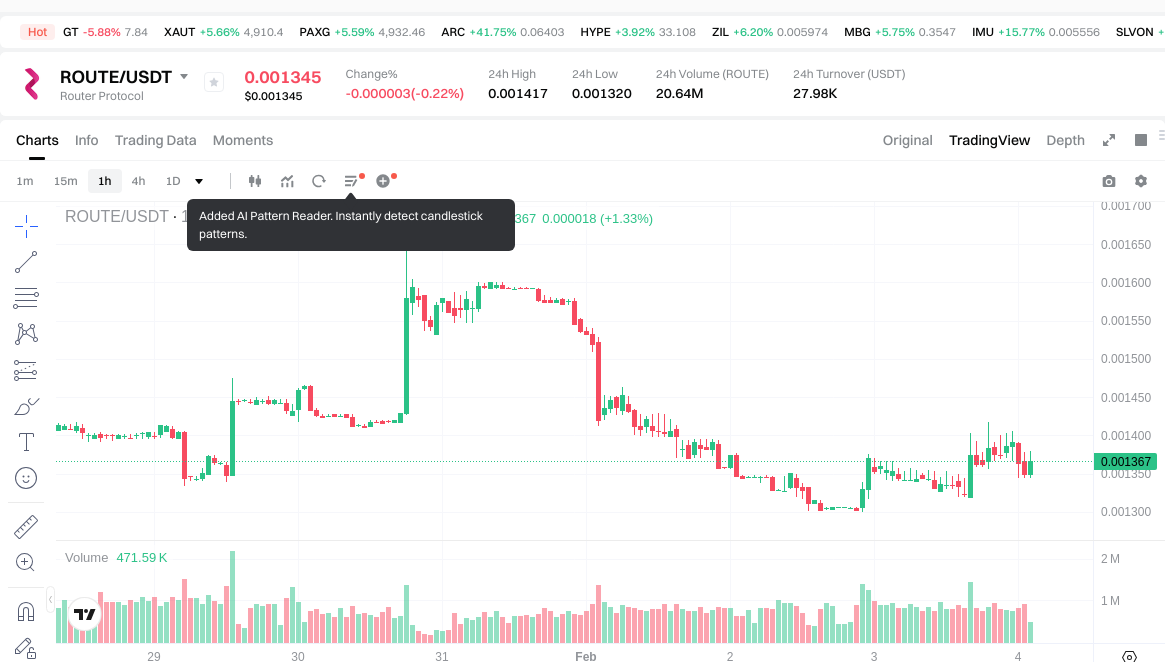
As of February 4, 2026, ROUTE is trading at $0.001375, reflecting market dynamics within the chain abstraction protocol sector. The token has demonstrated short-term price movements with a 24-hour change of -0.14%, indicating relative stability in the immediate trading period. However, broader timeframe analysis reveals more pronounced adjustments, with a 7-day decline of -3.63% and a 30-day decrease of -8.76%.
The circulating supply stands at 648,739,153.3008 ROUTE tokens, representing approximately 66.06% of the total supply of 982,072,351.3008 tokens. The current market capitalization is positioned at $892,016.34, while the fully diluted market cap reaches $1,350,349.48. Trading volume over the past 24 hours amounts to $28,014.74.
Router Protocol's market presence includes 4 exchange listings, with a holder base of 3,633 addresses. The token operates on multiple infrastructure layers, utilizing both Mainnet and ERC20 standards, with the primary contract deployed on the Ethereum network at address 0x60f67e1015b3f069dd4358a78c38f83fe3a667a9.
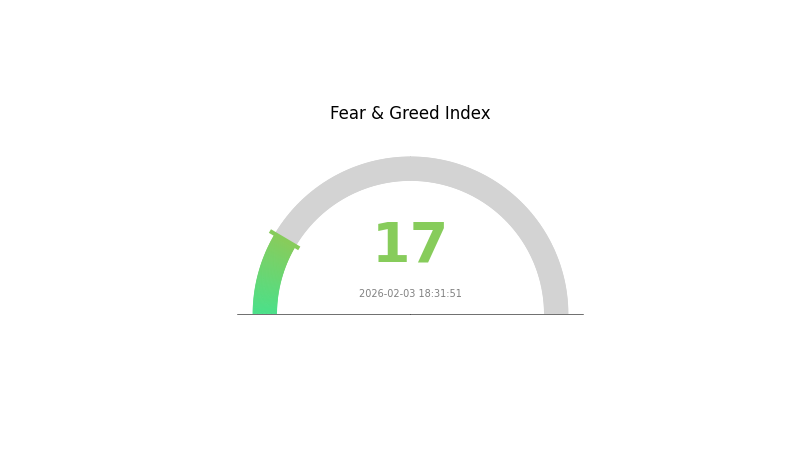
The broader market sentiment indicator shows a reading of 17, corresponding to conditions of heightened caution among participants. Within the 24-hour trading range, ROUTE has fluctuated between $0.00132 and $0.001417, establishing current technical boundaries for short-term price action.
Click to view current ROUTE market price
ROUTE Market Sentiment Indicator
2026-02-03 Fear and Greed Index: 17 (Extreme Fear)
Click to view current Fear & Greed Index
The crypto market is currently experiencing extreme fear, with the Fear and Greed Index dropping to 17. This indicates heightened market anxiety and pessimism among investors. During such periods, risk-averse traders typically reduce positions while opportunistic investors may view significant price declines as buying opportunities. Market volatility remains elevated, and sentiment data suggests cautious positioning. Investors should monitor key support levels and adjust their strategies according to personal risk tolerance. Extreme fear often precedes market reversals, making it crucial to stay informed through Gate.com's real-time market data and analysis tools.
ROUTE 持仓分布
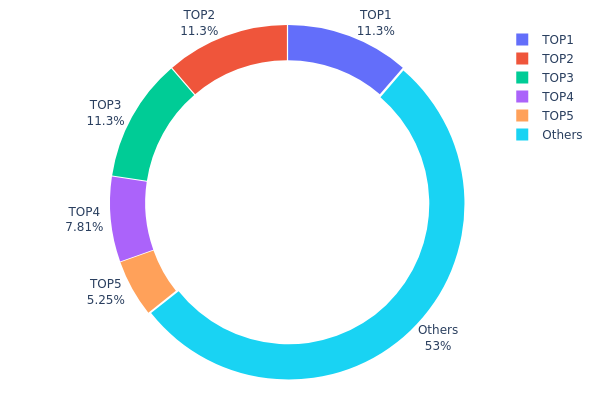
The address holding distribution chart visualizes the concentration of token holdings across different wallet addresses, serving as a critical indicator of decentralization and market structure stability. This metric reveals how tokens are distributed among holders, with implications for price volatility, market manipulation risks, and overall ecosystem health.
According to the current data, ROUTE exhibits a highly concentrated holding pattern. The top three addresses collectively control 33.93% of the total supply, with each holding exactly 111,111.07K tokens (11.31% each). This tri-polar concentration structure is further reinforced by the fourth and fifth largest holders, which account for 7.80% and 5.25% respectively. The top five addresses combined represent 46.98% of the circulating supply, while the remaining 53.02% is distributed among other holders. Such concentration levels indicate significant centralization risks, as coordinated actions by major holders could substantially impact market dynamics.
This distribution structure presents notable concerns for market stability and price discovery mechanisms. The near-identical holdings of the top three addresses suggest potential coordination or institutional control, which could lead to increased volatility during large-scale position adjustments. The relatively low percentage held by smaller addresses (53.02% across all others) indicates limited retail participation and potential vulnerability to whale manipulation. From a market structure perspective, this concentration pattern may result in reduced liquidity depth and heightened susceptibility to sudden price movements, particularly if major holders decide to execute simultaneous trades.
Click to view the current ROUTE holding distribution
| Top |
Address |
Holding Qty |
Holding (%) |
| 1 |
0xa96d...3e5ec4 |
111111.07K |
11.31% |
| 2 |
0x94dc...f1d1b5 |
111111.07K |
11.31% |
| 3 |
0xcc94...319e69 |
111111.07K |
11.31% |
| 4 |
0x58ed...a36a51 |
76652.88K |
7.80% |
| 5 |
0x27fd...618d46 |
51566.48K |
5.25% |
| - |
Others |
520519.80K |
53.02% |
II. Core Factors Influencing ROUTE's Future Price
Supply Mechanism
- Deflationary Model: ROUTE adopts a deflationary token economy, with circulating supply decreasing over time.
- Historical Pattern: During previous supply reduction phases, prices typically rose due to increased scarcity.
- Current Impact: The ongoing supply contraction is expected to continue supporting price appreciation through enhanced scarcity dynamics.
Institutional and Major Holder Dynamics
No specific institutional holding data or enterprise adoption information for ROUTE was available in the provided materials.
Macroeconomic Environment
No specific macroeconomic policy impacts, inflation hedging attributes, or geopolitical factors directly related to ROUTE were mentioned in the provided materials.
Technological Development and Ecosystem Building
- Router Protocol Upgrades: Router Protocol continues to enhance its cross-chain infrastructure, enabling efficient asset and information flow across multiple chains. Protocol upgrades significantly impact the ecosystem's functionality and user experience.
- Ecosystem Applications: The development and expansion of cross-chain applications built on Router Protocol contribute to increasing utility and demand for ROUTE tokens.
III. 2026-2031 ROUTE Price Prediction
2026 Outlook
- Conservative Prediction: $0.00091 - $0.00135
- Neutral Prediction: Around $0.00135
- Optimistic Prediction: Up to $0.00175 (requires favorable market conditions and increased adoption)
Based on the forecast data, ROUTE may experience a slight decline in 2026, with price change showing -1%. The predicted price range suggests that the token could fluctuate between $0.00091 at the lower end and $0.00175 at the upper end, with an average price stabilizing around $0.00135. This period may represent a consolidation phase as the market adjusts to new dynamics.
2027-2029 Mid-term Outlook
- Market Stage Expectation: Gradual recovery and growth phase with increasing momentum
- Price Range Prediction:
- 2027: $0.00115 - $0.00214 (average $0.00155, +12% change)
- 2028: $0.0012 - $0.00262 (average $0.00184, +34% change)
- 2029: $0.00125 - $0.00295 (average $0.00223, +62% change)
- Key Catalysts: The progressive price increases indicate potential positive developments in the ecosystem, enhanced utility adoption, and broader market recovery trends that could drive sustained growth momentum.
The mid-term outlook suggests a notable upward trajectory, with 2029 potentially marking a significant milestone as the price change accelerates to 62%, reflecting strengthening fundamentals and market sentiment.
2030-2031 Long-term Outlook
- Baseline Scenario: $0.00225 - $0.0037 (assuming continued ecosystem development and stable market conditions)
- Optimistic Scenario: $0.00259 - $0.00315 in 2031 (assuming accelerated adoption and favorable regulatory environment)
- Transformative Scenario: Potential to reach $0.00334 or higher (under exceptionally favorable conditions including major partnerships or technological breakthroughs)
- 2026-02-04: ROUTE faces a transitional period with near-term consolidation expected before entering a multi-year growth phase
The long-term projections indicate substantial growth potential, with 2030 showing an 88% change and 2031 demonstrating a remarkable 128% change. By 2031, the average predicted price could reach $0.00315, with the optimistic high potentially touching $0.00334. These forecasts assume sustained ecosystem expansion, increasing real-world utility, and favorable macroeconomic conditions for digital assets. However, investors should note that cryptocurrency markets remain highly volatile, and actual outcomes may vary significantly based on numerous factors including technological developments, regulatory changes, and overall market sentiment.
| Year |
Predicted High Price |
Predicted Average Price |
Predicted Low Price |
Price Change |
| 2026 |
0.00175 |
0.00135 |
0.00091 |
-1 |
| 2027 |
0.00214 |
0.00155 |
0.00115 |
12 |
| 2028 |
0.00262 |
0.00184 |
0.0012 |
34 |
| 2029 |
0.00295 |
0.00223 |
0.00125 |
62 |
| 2030 |
0.0037 |
0.00259 |
0.00225 |
88 |
| 2031 |
0.00334 |
0.00315 |
0.00205 |
128 |
IV. ROUTE Professional Investment Strategy and Risk Management
ROUTE Investment Methodology
(I) Long-term Holding Strategy
- Suitable for: Investors who believe in cross-chain infrastructure development and chain abstraction protocols
- Operational Recommendations:
- Consider accumulating positions during market corrections when ROUTE trades near support levels around $0.0013-$0.0014
- Monitor project development milestones and ecosystem expansion progress
- Utilize Gate Web3 Wallet for secure storage with multi-signature protection enabled
(II) Active Trading Strategy
- Technical Analysis Tools:
- Support and Resistance Levels: Current price of $0.001375 sits between 24H low of $0.00132 and 24H high of $0.001417, providing short-term trading ranges
- Volume Analysis: Track daily trading volume fluctuations (current 24H volume: $28,014) to identify potential trend reversals
- Swing Trading Points:
- Consider taking partial profits near resistance levels at $0.00142-$0.00145
- Set stop-loss orders 8-10% below entry points to manage downside risk
ROUTE Risk Management Framework
(I) Asset Allocation Principles
- Conservative Investors: 2-3% of crypto portfolio allocation
- Aggressive Investors: 5-8% of crypto portfolio allocation
- Professional Investors: May consider higher allocations based on comprehensive due diligence and risk models
(II) Risk Hedging Solutions
- Diversification Approach: Combine ROUTE holdings with established cross-chain protocol tokens to reduce concentration risk
- Position Sizing Strategy: Scale into positions gradually rather than deploying capital all at once
(III) Secure Storage Solutions
- Software Wallet Recommendation: Gate Web3 Wallet with hardware security module integration
- Hardware Wallet Solution: Consider transferring larger holdings to cold storage devices for enhanced security
- Security Precautions: Enable two-factor authentication, regularly update security protocols, never share private keys or seed phrases
V. ROUTE Potential Risks and Challenges
ROUTE Market Risks
- Extreme Volatility: ROUTE has declined 94.63% over the past year, demonstrating significant price instability that may continue
- Limited Liquidity: With only 4 exchange listings and relatively low 24H trading volume, large orders may experience substantial slippage
- Low Market Capitalization: Current market cap of approximately $892,016 indicates higher susceptibility to price manipulation and speculative pressures
ROUTE Regulatory Risks
- Cross-chain Protocol Scrutiny: Regulatory authorities may implement stricter oversight of cross-chain transfer mechanisms
- Compliance Requirements: Evolving regulatory frameworks for decentralized protocols could impact operational flexibility
- Jurisdictional Uncertainties: Different regulatory approaches across regions may affect protocol adoption and token accessibility
ROUTE Technical Risks
- Smart Contract Vulnerabilities: Cross-chain messaging and transfer protocols face complex security challenges that could expose users to exploits
- Interoperability Dependencies: Protocol functionality relies on multiple blockchain networks; failures in underlying chains could disrupt operations
- Competition Pressure: Established cross-chain solutions and emerging chain abstraction protocols may limit ROUTE's market share expansion
VI. Conclusion and Action Recommendations
ROUTE Investment Value Assessment
Router Protocol addresses critical infrastructure needs in multi-chain environments through its chain abstraction approach. The project's focus on intent-based cross-chain transfers and security borrowing mechanisms demonstrates technical innovation in a growing market segment. However, the token faces significant headwinds including a 94.63% decline over the past year, limited exchange availability, and a relatively small market capitalization of under $1 million. The circulating supply represents approximately 66.06% of maximum supply, suggesting moderate token distribution. While the long-term value proposition centers on increasing demand for seamless cross-chain interactions, short-term risks include continued price volatility, liquidity constraints, and competitive pressures from established protocols.
ROUTE Investment Recommendations
✅ Beginners: Start with minimal exposure (under 2% of crypto portfolio) and focus on understanding cross-chain technology fundamentals before increasing position sizes
✅ Experienced Investors: Consider ROUTE as a speculative position within a diversified cross-chain infrastructure allocation, maintaining strict risk management protocols
✅ Institutional Investors: Conduct comprehensive technical due diligence on Router Protocol's security architecture and ecosystem partnerships before considering meaningful allocations
ROUTE Trading Participation Methods
- Spot Trading: Access ROUTE trading pairs on Gate.com with competitive fees and adequate liquidity for retail-sized orders
- Gradual Accumulation: Implement dollar-cost averaging strategies to mitigate timing risk and reduce impact of short-term volatility
- Research-Based Approach: Monitor project development updates, partnership announcements, and ecosystem growth metrics before adjusting position sizes
Cryptocurrency investment carries extremely high risks, and this article does not constitute investment advice. Investors should make prudent decisions based on their own risk tolerance and are advised to consult professional financial advisors. Never invest more than you can afford to lose.
FAQ
What is the current price of ROUTE token, and what are its all-time high and all-time low prices?
ROUTE's current price varies with market conditions. The all-time high is $0.079892, representing a 98.05% decline from peak levels. Historical low data is not fully detailed.
What are the main factors affecting ROUTE price?
ROUTE price is primarily influenced by market demand, trading volume, network adoption, protocol updates, liquidity conditions, and overall crypto market sentiment. Technological developments and ecosystem growth also play significant roles in price movements.
What is the future price of ROUTE token? Are there professional institution price predictions?
ROUTE is predicted to reach approximately $-- by 2028 with an estimated growth rate of 10.25%. Multiple professional institutions provide price forecasts, though specific valuations vary based on market conditions and adoption metrics.
How to use technical analysis methods to predict ROUTE price trends?
Use moving averages and trend lines to analyze ROUTE price movements, identifying support and resistance levels. Technical analysis helps forecast price trends through volume analysis and momentum indicators.
How is the market liquidity and trading volume of ROUTE tokens, and what impact does this have on price prediction?
ROUTE's market liquidity and trading volume directly affect price stability and volatility. Higher liquidity and trading volume typically indicate more stable prices and tighter spreads. Strong trading activity supports more accurate price predictions and smoother market movements.
What is the fundamentals of ROUTE project and how does it help with long-term price prediction?
ROUTE's fundamentals reflect its financial health, technology innovation, and market adoption. Strong fundamentals like transaction volume, developer activity, and ecosystem growth support bullish long-term price trajectories and sustainable value appreciation.
* The information is not intended to be and does not constitute financial advice or any other recommendation of any sort offered or endorsed by Gate.