2026 SHFT Price Prediction: Expert Analysis and Market Forecast for the Upcoming Year


Introduction: SHFT's Market Position and Investment Value
Shyft Network (SHFT), positioned as a public blockchain protocol designed to aggregate and embed trust and verification into data stored across public and private ecosystems, has been developing its infrastructure since its launch in 2021. As of 2026, SHFT maintains a market capitalization of approximately $594,507, with a circulating supply of about 2.34 billion tokens, and the price hovering around $0.0002546. This asset, functioning as a foundational element in data contextualization and digital identity verification, is playing an increasingly important role in bridging isolated datasets and transforming raw data into meaningful information.
This article will comprehensively analyze SHFT's price movements from 2026 to 2031, combining historical patterns, market supply and demand dynamics, ecosystem development, and macroeconomic environment factors to provide investors with professional price forecasts and practical investment strategies.
I. SHFT Price History Review and Market Status
SHFT Historical Price Evolution Trajectory
- 2021: SHFT reached its all-time high of $6.34 on March 28, marking a significant milestone in its price history with a substantial increase from its initial offering price of $0.2
- 2025: The token experienced a notable decline, with prices reaching their historical low point of $0.0002186 on April 9
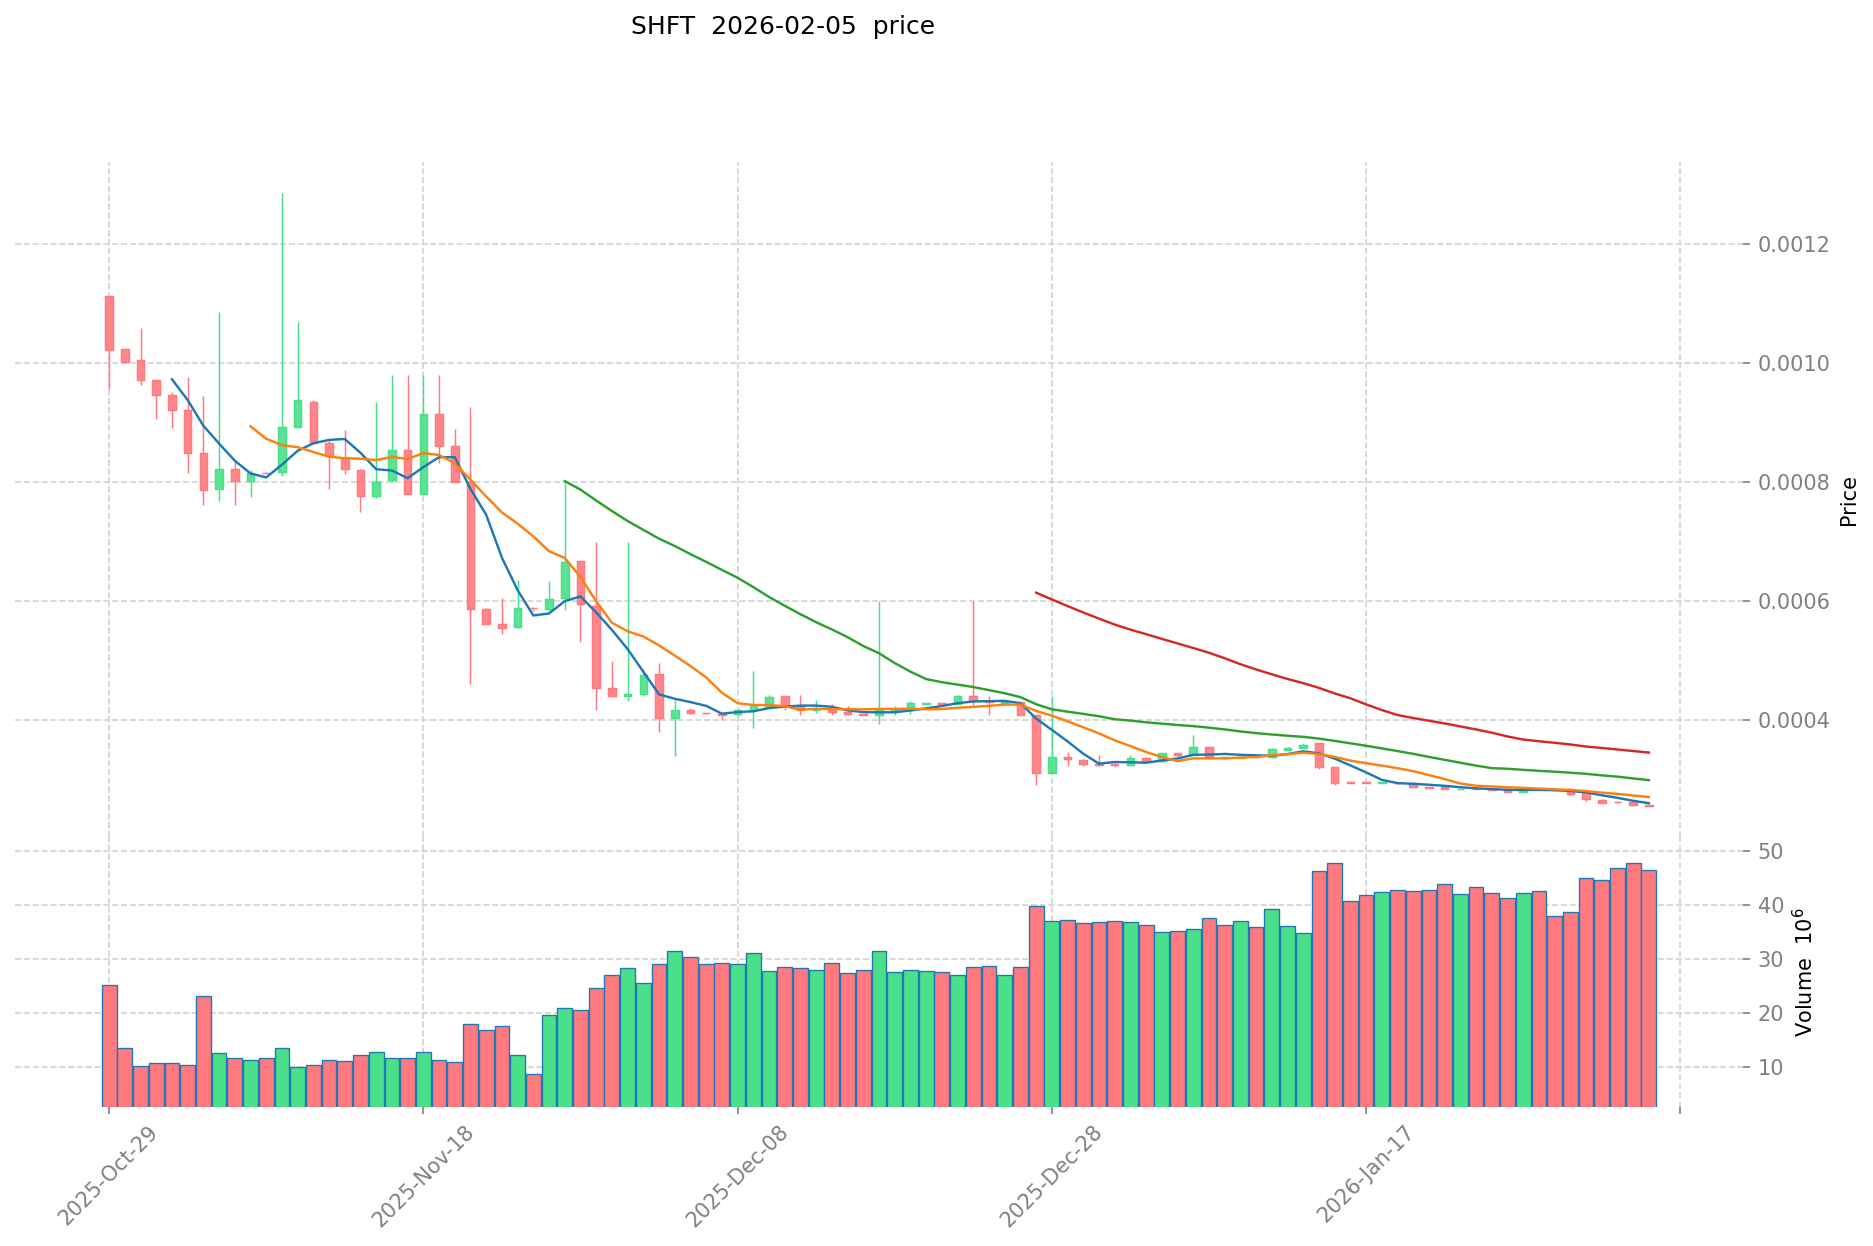
- Recent Period: Following the historical low in early 2025, the token has shown some recovery but remains significantly below previous highs, currently trading at $0.0002546
SHFT Current Market Status
As of February 5, 2026, SHFT is trading at $0.0002546, with a 24-hour trading volume of $12,537.62. The token has shown a slight positive movement of 0.03% over the past 24 hours, though it faces downward pressure in longer timeframes, declining 0.70% in the past hour, 9.49% over the past week, 25.56% over the past month, and 43.91% over the past year.
The current market capitalization stands at approximately $594,507, with a circulating supply of 2.34 billion SHFT tokens, representing 92.66% of the maximum supply of 2.52 billion tokens. The fully diluted market cap is valued at $641,592. The token's 24-hour price range fluctuated between $0.0002546 and $0.000261.
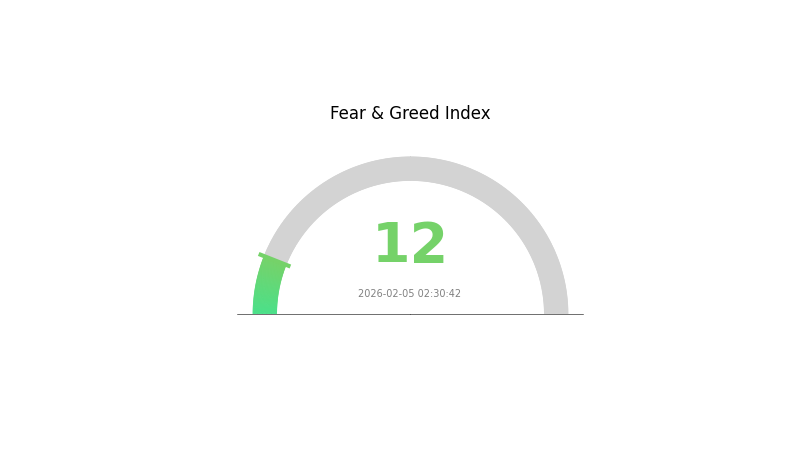
With a market dominance of 0.000024% and a ranking of 2,900 in the cryptocurrency market, SHFT maintains a relatively small market presence. The token is currently available for trading on Gate.com and holds approximately 2,185 token holders. According to current market sentiment indicators, the crypto fear and greed index stands at 12, indicating "Extreme Fear" conditions in the broader market.
Click to view current SHFT market price
SHFT Market Sentiment Indicator
2026-02-05 Fear and Greed Index: 12 (Extreme Fear)
Click to view current Fear & Greed Index
The cryptocurrency market is experiencing extreme fear, with the index dropping to 12. This indicates investors are highly pessimistic about market conditions. When fear levels reach such extremes, it often signals potential buying opportunities for long-term investors, as assets may be undervalued. However, caution is advised as market volatility remains high. Monitor key support levels and consider dollar-cost averaging strategies. On Gate.com, you can track real-time market sentiment and make informed trading decisions based on comprehensive data analysis.
SHFT Holdings Distribution
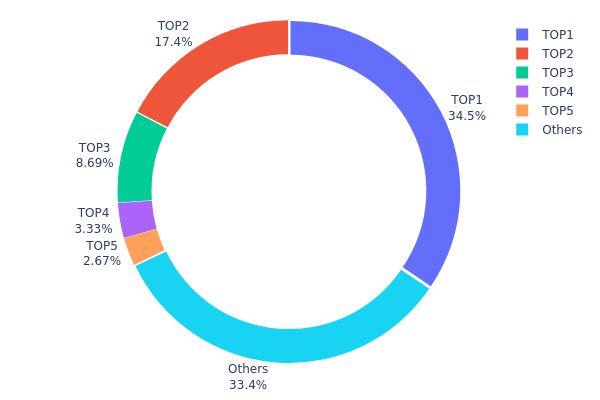
The holdings distribution chart reveals the ownership structure of SHFT tokens across different addresses on the blockchain, serving as a critical indicator of decentralization and potential market manipulation risks. By analyzing the concentration of tokens among top holders, investors can assess whether the token supply is broadly distributed or dominated by a small number of entities, which directly impacts price volatility and market stability.
According to the current data, SHFT exhibits a moderately high concentration pattern. The top holder controls approximately 34.51% of the total supply (461,056.76K tokens), while the second and third largest addresses hold 17.36% and 8.69% respectively. Collectively, the top five addresses account for 66.55% of the circulating supply, leaving only 33.45% distributed among remaining holders. This concentration level suggests that a relatively small group of entities possesses significant influence over SHFT's market dynamics. While not reaching extreme centralization seen in some projects, this distribution pattern indicates that coordinated selling pressure from major holders could trigger substantial price movements.
The current holdings structure presents both risks and opportunities for market participants. The concentration among top addresses increases susceptibility to price manipulation and creates vulnerability to sudden liquidity shocks if large holders decide to liquidate positions. However, the fact that roughly one-third of supply remains with smaller holders suggests some degree of community participation and organic adoption. From a market structure perspective, this distribution pattern implies that price discovery may be influenced more by whale behavior than by broader market sentiment, potentially leading to increased volatility during periods of major holder activity. Investors should monitor on-chain movements from these top addresses closely, as significant transfers could signal impending market shifts.
Click to view current SHFT Holdings Distribution
| Top | Address | Holding Qty | Holding (%) |
|---|---|---|---|
| 1 | 0xa41c...8e2e74 | 461056.76K | 34.51% |
| 2 | 0xdda1...0bfc71 | 231937.33K | 17.36% |
| 3 | 0x998a...283c0b | 116094.91K | 8.69% |
| 4 | 0x13d2...dfe19e | 44490.00K | 3.33% |
| 5 | 0x0d07...b492fe | 35658.41K | 2.66% |
| - | Others | 446469.28K | 33.45% |
II. Core Factors Influencing SHFT's Future Price
Supply Mechanism
- Market Sentiment and Adoption: SHFT's price dynamics are closely tied to market sentiment and adoption rates within the sustainable energy management sector. Historical data shows that the token experienced notable price volatility, with its historical low recorded at $0.0002186 on April 9, 2025, reflecting how external market conditions and investor confidence directly impact valuation.
- Historical Patterns: Price fluctuations have consistently demonstrated sensitivity to broader market trends, regulatory developments in the energy sector, and shifts in investor sentiment toward sustainable technology solutions.
- Current Impact: As the sustainable energy sector continues to evolve, SHFT's price trajectory remains vulnerable to changes in adoption momentum and overall market sentiment toward green energy initiatives.
Macro-Economic Environment
- Monetary Policy Influence: Global monetary policies, particularly interest rate decisions and liquidity conditions, play a significant role in shaping investor appetite for emerging tokens like SHFT. Economic uncertainty and policy shifts can create ripple effects across the cryptocurrency market.
- Geopolitical Factors: International developments and regulatory frameworks surrounding sustainable energy policies can influence SHFT's positioning and perceived value within the broader energy management ecosystem.
Technical Development and Ecosystem Building
- Sustainable Energy Management Integration: SHFT's value proposition centers on its application within sustainable energy management systems. The token's utility and adoption within this niche sector directly correlate with its long-term price potential.
- Ecosystem Applications: The development and expansion of practical applications leveraging SHFT within energy management platforms can enhance token utility and drive demand, though specific project details remain subject to market development.
III. 2026-2031 SHFT Price Prediction
2026 Outlook
- Conservative prediction: $0.00015 - $0.00025
- Neutral prediction: $0.00025 average price level
- Optimistic prediction: Up to $0.00037 (requires favorable market conditions and increased trading volume)
2027-2029 Mid-term Outlook
- Market stage expectation: SHFT may enter a gradual growth phase as the project develops and market recognition potentially improves
- Price range prediction:
- 2027: $0.00017 - $0.00045, with an average around $0.00031
- 2028: $0.00030 - $0.00044, with an average around $0.00038
- 2029: $0.00030 - $0.00047, with an average around $0.00041
- Key catalysts: Potential adoption growth, ecosystem development, and broader cryptocurrency market trends could serve as main drivers
2030-2031 Long-term Outlook
- Baseline scenario: $0.00028 - $0.00057 (assuming steady project development and stable market conditions)
- Optimistic scenario: $0.00046 - $0.00072 (assuming enhanced utility adoption and favorable regulatory environment)
- Transformative scenario: Potential to reach $0.00072 by 2031 (under extremely favorable conditions including significant ecosystem expansion)
- February 5, 2026: SHFT trading within the predicted range of $0.00015 - $0.00037 (current baseline establishment phase)
| Year | Predicted High Price | Predicted Average Price | Predicted Low Price | Price Change |
|---|---|---|---|---|
| 2026 | 0.00037 | 0.00025 | 0.00015 | 0 |
| 2027 | 0.00045 | 0.00031 | 0.00017 | 23 |
| 2028 | 0.00044 | 0.00038 | 0.0003 | 50 |
| 2029 | 0.00047 | 0.00041 | 0.0003 | 60 |
| 2030 | 0.00057 | 0.00044 | 0.00028 | 71 |
| 2031 | 0.00072 | 0.00051 | 0.00046 | 98 |
IV. SHFT Professional Investment Strategy and Risk Management
SHFT Investment Methodology
(1) Long-term Holding Strategy
- Target Investors: Investors focused on blockchain data verification and digital identity infrastructure
- Operational Recommendations:
- Monitor the development progress of Shyft Network's data bridging capabilities and ecosystem adoption
- Evaluate the growth in network usage and SHFT token utility for security and operational fees
- Storage Solution: Utilize Gate Web3 Wallet for secure SHFT token storage with multi-signature protection
(2) Active Trading Strategy
- Technical Analysis Tools:
- Volume Analysis: Monitor the 24-hour trading volume of $12,537.62 to identify liquidity patterns and potential breakout signals
- Support and Resistance Levels: Track price movements within the 24-hour range ($0.0002546 - $0.000261) to establish entry and exit points
- Swing Trading Key Points:
- Consider the token's high volatility with 7-day decline of 9.49% and 30-day decline of 25.56% for short-term trading opportunities
- Set stop-loss orders due to significant price fluctuations and relatively low market capitalization of $594,506
SHFT Risk Management Framework
(1) Asset Allocation Principles
- Conservative Investors: 0.5-1% of crypto portfolio
- Aggressive Investors: 2-3% of crypto portfolio
- Professional Investors: 3-5% with active monitoring and hedging strategies
(2) Risk Hedging Solutions
- Position Sizing: Limit SHFT exposure given its ranking of #2,900 and market dominance of 0.000024%
- Diversification: Balance SHFT holdings with more established blockchain infrastructure tokens
(3) Secure Storage Solutions
- Web3 Wallet Recommendation: Gate Web3 Wallet supporting ERC-20 tokens (Contract Address: 0xb17c88bda07d28b3838e0c1de6a30eafbcf52d85)
- Multi-Signature Solution: Implement multi-sig wallets for holdings exceeding $1,000
- Security Precautions: Verify contract addresses through official sources (https://etherscan.io/token/0xb17c88bda07d28b3838e0c1de6a30eafbcf52d85) and never share private keys
V. SHFT Potential Risks and Challenges
SHFT Market Risks
- High Volatility: SHFT experienced a 43.91% decline over one year and currently trades at $0.0002546, indicating substantial price instability
- Limited Liquidity: With daily trading volume of approximately $12,537 and circulation on only one exchange, liquidity constraints may impact order execution
- Market Cap Concerns: Total market capitalization of $594,506 represents minimal market presence with dominance of 0.000024%
SHFT Regulatory Risks
- Data Privacy Compliance: As a data verification protocol, Shyft Network may face evolving regulatory requirements regarding data handling and cross-border information transfer
- Identity Verification Standards: Potential regulatory challenges related to digital identity frameworks and KYC/AML compliance across jurisdictions
- Token Classification Uncertainty: Regulatory treatment of SHFT tokens used for network fees and data marketplace payments remains subject to interpretation
SHFT Technical Risks
- Adoption Challenges: The protocol's success depends on widespread adoption by individuals and enterprises for data context addition
- Interoperability Complexity: Technical challenges in bridging isolated datasets across public, private, licensed, and unlicensed networks
- Competition: Established blockchain platforms and identity solutions may limit Shyft Network's market penetration
VI. Conclusion and Action Recommendations
SHFT Investment Value Assessment
Shyft Network presents a specialized value proposition in blockchain-based data verification and digital identity infrastructure. With a circulating supply of 2.34 billion SHFT tokens (92.66% of max supply) and a market cap to fully diluted valuation ratio of 92.66%, the tokenomics show near-complete circulation. However, the token's performance reflects significant challenges: trading near its all-time low of $0.0002186 (reached in April 2025) and experiencing consistent declines across multiple timeframes. The limited exchange availability and low trading volume indicate restricted market access and liquidity constraints. Long-term value depends on successful ecosystem development, increased adoption of the network's data bridging capabilities, and growing demand for SHFT tokens within the platform's security and payment mechanisms.
SHFT Investment Recommendations
✅ Beginners: Avoid allocation until demonstrable network adoption and improved liquidity metrics emerge; prioritize learning about blockchain data verification concepts before considering investment
✅ Experienced Investors: Limit exposure to micro-cap allocation (under 1% of portfolio) with strict risk management; monitor project development milestones and holder growth (currently 2,185 holders) for adoption signals
✅ Institutional Investors: Conduct comprehensive due diligence on technology implementation and partnership developments; consider strategic positioning only with clear risk parameters and hedging mechanisms
SHFT Trading Participation Methods
- Spot Trading: Execute SHFT trades on Gate.com with careful attention to order book depth and slippage given limited liquidity
- Dollar-Cost Averaging: Implement systematic small purchases to mitigate timing risk if taking a long-term position in the project
- Portfolio Diversification: Combine SHFT with established data infrastructure and identity verification projects to balance risk-reward profiles
Cryptocurrency investment carries extreme risks, and this article does not constitute investment advice. Investors should make prudent decisions based on their risk tolerance and are advised to consult professional financial advisors. Never invest more than you can afford to lose.
FAQ
What is the historical price trend of SHFT tokens?
SHFT tokens have fluctuated between a low of 0.025 and a high of 0.065, currently trading around 0.040. The token has experienced a 36.364% decline from its peak, with an average trading price of 0.045.
What are the main factors affecting SHFT price?
SHFT price is primarily driven by supply mechanisms, scarcity, technological development, ecosystem growth, market demand, institutional adoption, and macroeconomic conditions. Trading volume and network utility also play significant roles in price movements.
How to conduct long-term price prediction for SHFT?
SHFT's long-term price prediction suggests potential growth based on market trends and analysis. Estimates indicate possible values around $0.0002932 in the near term, with projections potentially reaching $0.0003923 by 2031. Monitor trading volume, market sentiment, and technical indicators for informed forecasting.
What advantages does SHFT have compared to other similar tokens?
SHFT offers significant cost and scalability advantages through batch minting and interchangeability design, enabling more efficient and economical transactions with higher trading volume capacity.
What are the risk factors and market volatility of SHFT?
SHFT faces market volatility from regulatory changes, economic conditions, and investor sentiment fluctuations. The token's price can experience significant swings due to market dynamics and operational risks. Investors should monitor these factors carefully when considering SHFT positions.
Share
Content
Introduction: SHFT's Market Position and Investment Value
I. SHFT Price History Review and Market Status
II. Core Factors Influencing SHFT's Future Price
III. 2026-2031 SHFT Price Prediction
IV. SHFT Professional Investment Strategy and Risk Management
V. SHFT Potential Risks and Challenges
VI. Conclusion and Action Recommendations
FAQ
How to Buy Cryptocurrency


Trending Cryptocurrencies


Bitcoin Fear and Greed Index: Market Sentiment Analysis for 2025

Newbie Must Read: How to Formulate Investment Strategies When Nasdaq Turns Positive in 2025

Bitcoin Market Cap in 2025: Analysis and Trends for Investors
How to Mine Ethereum in 2025: A Complete Guide for Beginners

Best Crypto Wallets 2025: How to Choose and Secure Your Digital Assets
TapSwap Listing Date: What Investors Need to Know in 2025

7 Steps to Take When Cryptocurrency Markets Crash

Stablecoins: Definition and Mechanism of Operation
Cryptocurrency Tax – How to File PIT-38 for Cryptocurrencies

Layer-1 vs Layer-2: What Sets Them Apart?

Smart Contracts: Definition and How They Work