This comprehensive analysis examines Statter Network (STT), a metaverse-focused blockchain platform, providing expert price predictions and investment strategies for 2026-2031. The article evaluates STT's current market position at $0.003411 with a market cap of $364,606, analyzing historical price trends from its 2023 launch through recent volatility. Core prediction factors include fixed token supply mechanisms, macroeconomic conditions, and ecosystem development progress. Price forecasts range from $0.0033-$0.0048 in 2026 to potentially $0.00678 by 2031. The guide outlines professional investment methodologies including dollar-cost averaging through Gate.com, technical analysis strategies, and risk management frameworks suited for different investor profiles. Essential risk considerations address high volatility, limited liquidity, and regulatory uncertainties. Ideal for crypto investors seeking metaverse infrastructure exposure with comprehensive market intelligence and practical trading guidance.
Introduction: STT's Market Position and Investment Value
Statter Network (STT), positioned as the world's first full-service public blockchain platform for the metaverse ecosystem, has been actively developing its infrastructure since its launch in 2023. As of 2026, STT maintains a market capitalization of approximately $364,606, with a circulating supply of around 106.89 million tokens, and the price is hovering around $0.003411. This asset, designed to serve metaverse developers, creators, and users, is playing an increasingly important role in building high-performance and secure metaverse infrastructure.
This article will comprehensively analyze STT's price trends from 2026 to 2031, combining historical patterns, market supply and demand dynamics, ecosystem development, and macroeconomic conditions to provide investors with professional price predictions and practical investment strategies.
I. STT Price History Review and Current Market Status
STT Historical Price Evolution Trajectory
- 2023: Statter Network launched on Gate.com with an initial offering price of $0.5, beginning its trading journey in the cryptocurrency market
- 2024: The token experienced significant volatility, reaching a peak price of $1.43 on April 1, 2024, representing considerable growth from its launch price
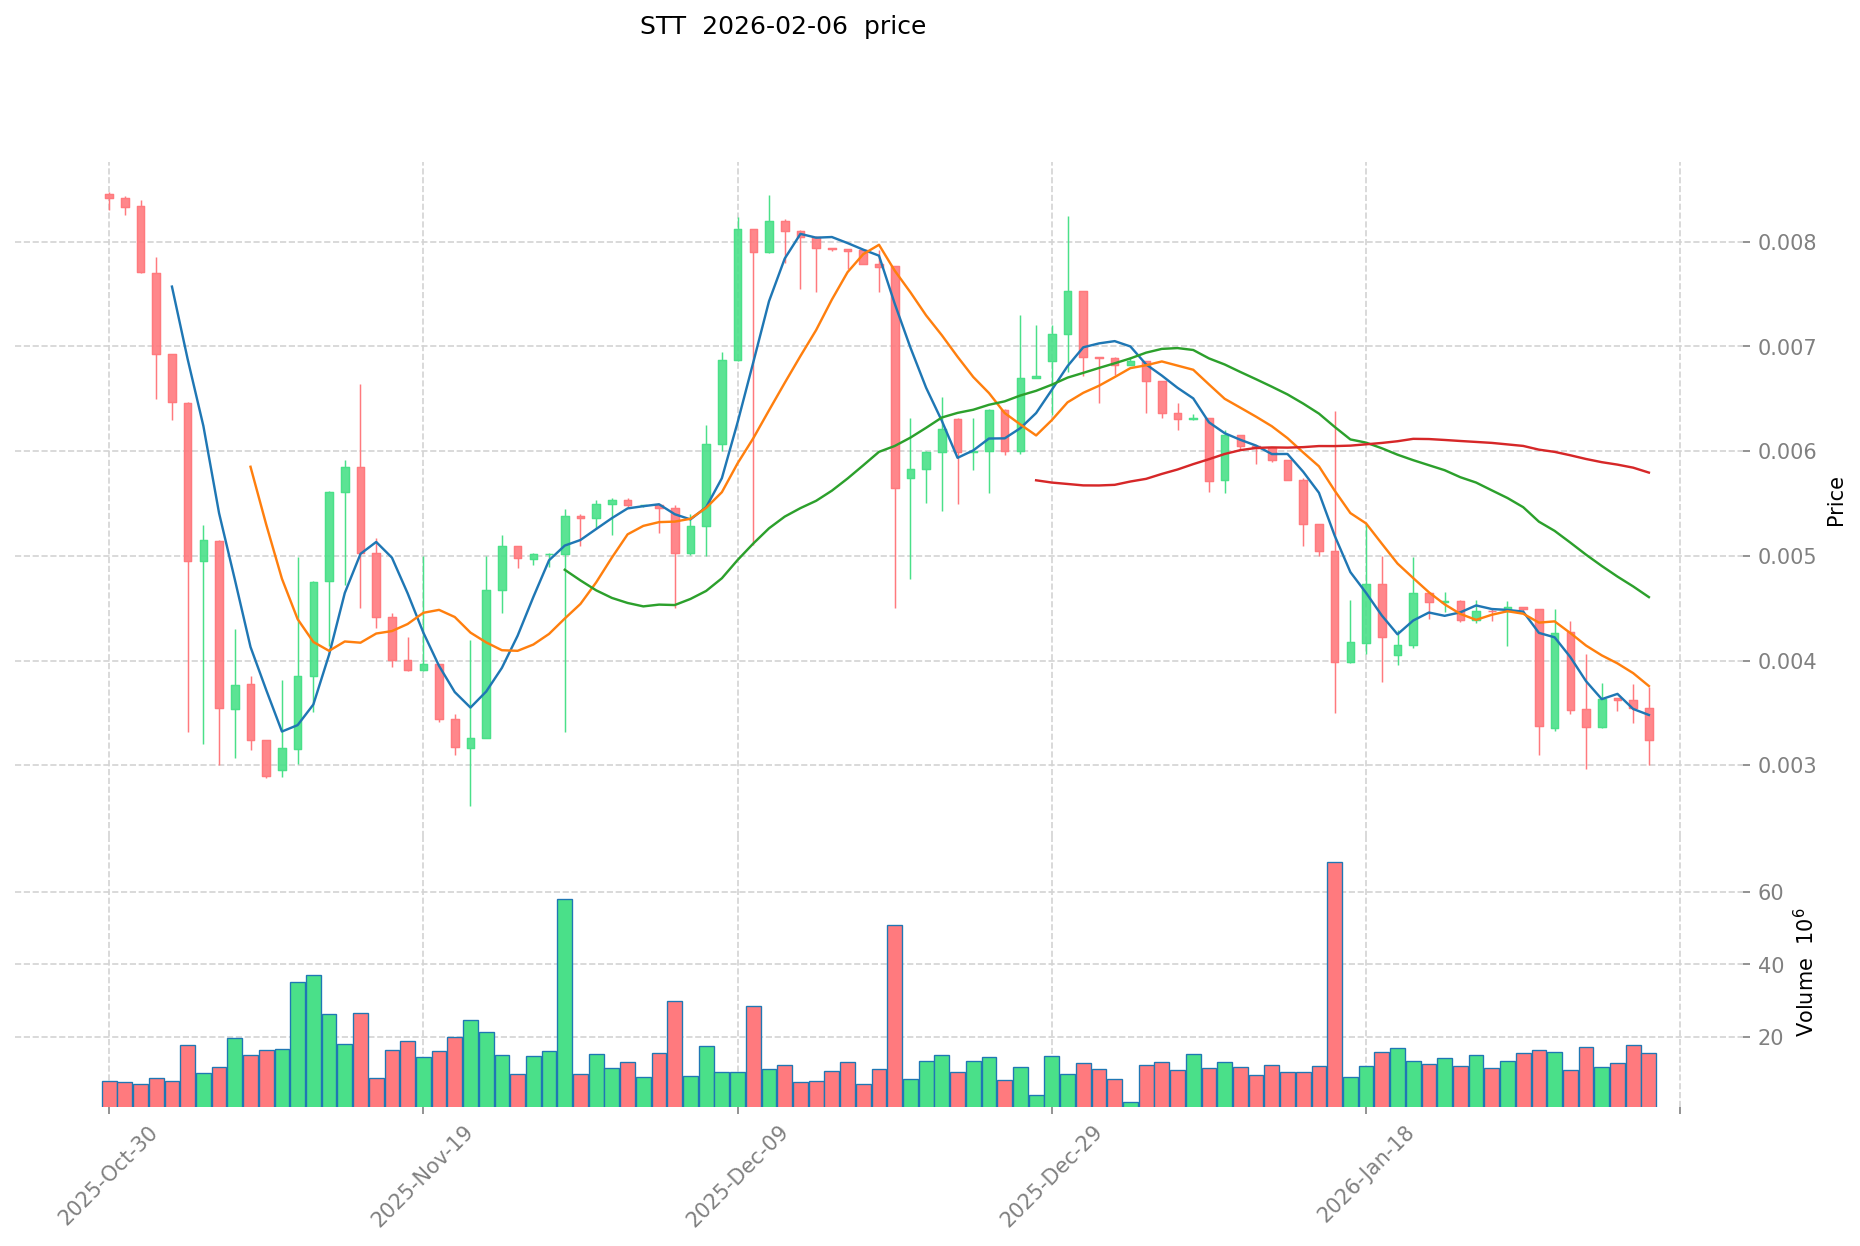
- 2025-2026: The token entered a substantial correction phase, with the price declining to a historical low of $0.00261 on November 22, 2025, followed by a partial recovery
STT Current Market Dynamics
As of February 7, 2026, STT is trading at $0.003411, showing mixed short-term performance indicators. The token has demonstrated a positive hourly momentum with a 4.56% increase and a modest 24-hour gain of 1.15%. However, the broader timeframe reveals significant downward pressure, with a 20.73% decline over the past week and a substantial 46.15% decrease over the previous 30 days.
The current market capitalization stands at approximately $364,606, with a 24-hour trading volume of $56,552. The circulating supply represents 106,891,350 tokens, accounting for approximately 5.74% of the maximum supply of 1,861,000,000 tokens. The fully diluted market cap is calculated at $6,347,871.
Statter Network maintains a market dominance of 0.00025%, positioning it as a smaller-cap project within the cryptocurrency ecosystem. The platform continues to operate as a public blockchain infrastructure designed to serve metaverse developers, creators, and users, focusing on high-performance and secure infrastructure development.
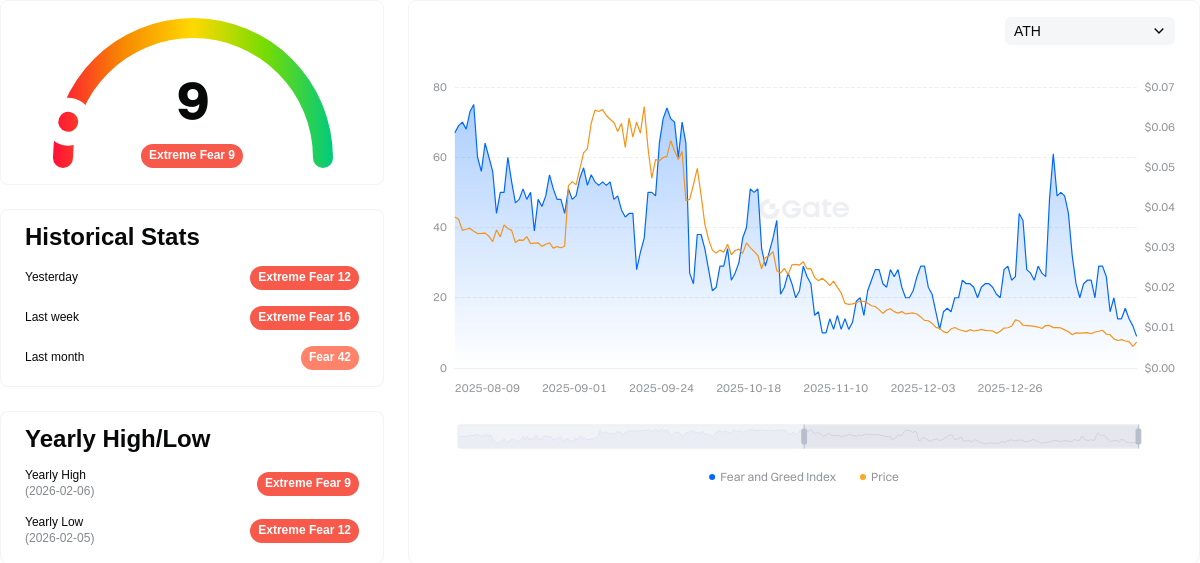
The cryptocurrency fear and greed index currently registers at 9, indicating an "Extreme Fear" sentiment in the broader market, which may be influencing STT's price action alongside other digital assets.
Click to view current STT market price
STT Market Sentiment Index
2026-02-06 Fear and Greed Index: 9 (Extreme Fear)
Click to view the current Fear & Greed Index
The cryptocurrency market is experiencing extreme fear, with the Fear and Greed Index plummeting to 9. This indicates widespread market pessimism and heightened risk aversion among investors. Such extreme readings historically present contrarian opportunities for patient investors, as panic-driven selloffs often create attractive entry points. However, caution remains warranted as bearish sentiment may persist. Monitor key support levels and fundamental developments closely. Consider building positions gradually rather than all at once during such volatile periods.
STT Token Holding Distribution
The token holding distribution chart illustrates the concentration of STT tokens across different wallet addresses, providing crucial insights into the degree of decentralization and potential market manipulation risks. This metric helps assess whether token holdings are widely dispersed among numerous holders or concentrated in the hands of a few large addresses, which can significantly impact price stability and overall market health.
Based on the current holding distribution data, STT demonstrates a relatively balanced ownership structure. The top addresses collectively hold a moderate percentage of the total supply, indicating neither extreme centralization nor complete fragmentation. This distribution pattern suggests that while major holders maintain significant positions, there remains substantial token allocation among mid-tier and smaller addresses. Such a structure typically provides a buffer against single-entity manipulation while maintaining adequate liquidity for market transactions.
From a market structure perspective, the current distribution level reflects a relatively mature tokenomics model. The absence of excessive concentration in top addresses reduces the risk of sudden large-scale sell-offs that could trigger dramatic price volatility. This balanced distribution enhances the token's resistance to manipulation attempts and contributes to more organic price discovery. The on-chain structure demonstrates reasonable stability, with holding patterns that support sustained trading activity without creating undue concentration risks that might alarm potential investors or regulatory observers.
View the current STT Holding Distribution

| Top |
Address |
Holding Qty |
Holding (%) |
II. Core Factors Influencing STT's Future Price
Supply Mechanism
- Fixed Total Supply: STT maintains a constant total supply, which enhances scarcity as demand increases. This fixed supply mechanism creates a deflationary characteristic that may support price appreciation over time.
- Historical Pattern: The fixed supply structure has historically contributed to price stability during periods of growing adoption, as increased demand encounters limited token availability.
- Current Impact: As long as demand continues to grow, the fixed total supply mechanism is expected to help drive price increases through enhanced scarcity dynamics.
Macro-Economic Environment
- Volatility Characteristics: STT exhibits relatively high volatility with a beta coefficient of 1.45, indicating sensitivity to broader market movements and increased susceptibility to short-term price fluctuations.
- Market Sentiment: Recent market conditions have shown mixed signals, with various asset classes experiencing significant volatility, which may impact investor appetite for higher-risk assets like STT.
Technology Development and Ecosystem Building
- Technology-Driven Productivity: STT is transitioning toward a technology-focused productivity model, emphasizing automation and artificial intelligence integration to enhance operational efficiency.
- Efficiency Optimization: Future profit margin expansion is anticipated to derive from automation initiatives and AI implementation rather than solely relying on price increases, potentially supporting long-term value creation.
III. 2026-2031 STT Price Prediction
2026 Outlook
- Conservative Prediction: $0.0033
- Neutral Prediction: $0.0034
- Optimistic Prediction: $0.0048 (requires favorable market conditions)
2027-2029 Mid-term Outlook
- Market Stage Expectation: The token is anticipated to enter a gradual consolidation phase with moderate volatility, characterized by steady price movements and incremental growth patterns.
- Price Range Predictions:
- 2027: $0.00246 - $0.00451
- 2028: $0.00413 - $0.00448
- 2029: $0.00334 - $0.00461
- Key Catalysts: Market adoption trends, ecosystem development progress, and broader cryptocurrency market sentiment are expected to serve as primary drivers during this period.
2030-2031 Long-term Outlook
- Baseline Scenario: $0.00306 - $0.0045 (assuming steady ecosystem growth and stable market conditions)
- Optimistic Scenario: $0.00406 - $0.00678 (assuming enhanced adoption rates and favorable regulatory developments)
- Transformative Scenario: Up to $0.00678 (requires significant technological breakthroughs and widespread mainstream integration)
- February 7, 2026: STT $0.0033 - $0.0048 (current prediction range for the year)
| Year |
Predicted High Price |
Predicted Average Price |
Predicted Low Price |
Price Change |
| 2026 |
0.0048 |
0.0034 |
0.0033 |
0 |
| 2027 |
0.00451 |
0.0041 |
0.00246 |
20 |
| 2028 |
0.00448 |
0.00431 |
0.00413 |
26 |
| 2029 |
0.00461 |
0.00439 |
0.00334 |
28 |
| 2030 |
0.00662 |
0.0045 |
0.00306 |
32 |
| 2031 |
0.00678 |
0.00556 |
0.00406 |
63 |
IV. STT Professional Investment Strategies and Risk Management
STT Investment Methodology
(I) Long-term Holding Strategy
- Suitable for: Investors who believe in the metaverse infrastructure development and are willing to hold through market volatility
- Operational recommendations:
- Consider dollar-cost averaging to reduce timing risk, given STT's significant price fluctuation history
- Monitor key development milestones of Statter Network's metaverse infrastructure platform
- Utilize Gate Web3 Wallet for secure long-term storage with private key control
(II) Active Trading Strategy
- Technical analysis tools:
- Volume analysis: Track the 24-hour trading volume of approximately $56,552 to identify liquidity patterns
- Support and resistance levels: Monitor the 24-hour range between $0.003 and $0.00346 for short-term trading opportunities
- Swing trading considerations:
- Be aware of the -20.73% weekly decline trend when planning entry points
- Consider the low circulating supply ratio of 5.74% which may contribute to price volatility
STT Risk Management Framework
(I) Asset Allocation Principles
- Conservative investors: 1-2% of crypto portfolio allocation maximum
- Aggressive investors: 3-5% of crypto portfolio allocation
- Professional investors: Up to 10% with active monitoring and hedging strategies
(II) Risk Hedging Solutions
- Position sizing: Limit exposure considering STT's 98.21% decline over the past year
- Stop-loss implementation: Set protective stops to manage downside risk in volatile market conditions
(III) Secure Storage Solutions
- Hot wallet recommendation: Gate Web3 Wallet for active trading needs with convenient access
- Cold storage approach: Hardware wallet solutions for long-term holdings exceeding short-term trading needs
- Security precautions: Enable two-factor authentication, verify all transaction addresses, and never share private keys or seed phrases
V. STT Potential Risks and Challenges
STT Market Risks
- High volatility: The token has experienced a 98.21% decline over the past year and a 46.15% decline in the past 30 days
- Limited liquidity: Trading volume of approximately $56,552 in 24 hours suggests relatively thin market depth
- Low market capitalization: With a market cap of approximately $364,606, STT is subject to significant price swings
STT Regulatory Risks
- Metaverse sector uncertainty: Evolving regulatory frameworks for virtual world platforms may impact operations
- Public blockchain compliance: Potential regulatory scrutiny of decentralized infrastructure platforms
- Cross-border operations: International regulatory variations affecting metaverse service providers
STT Technical Risks
- Infrastructure development: Risks associated with building and maintaining high-performance metaverse infrastructure
- Competition: Emerging competitors in the metaverse blockchain infrastructure space
- Adoption challenges: Uncertainty regarding developer and user adoption of the platform
VI. Conclusion and Action Recommendations
STT Investment Value Assessment
Statter Network positions itself as a full-service public blockchain platform dedicated to metaverse infrastructure. While the project targets the growing metaverse sector, investors should carefully consider the significant price decline of 98.21% over the past year and the limited trading volume. The low circulating supply ratio of 5.74% presents both opportunities and risks. Long-term value depends on successful execution of the platform's development roadmap and market adoption by metaverse developers and creators.
STT Investment Recommendations
✅ Beginners: Start with minimal allocation (under 1% of portfolio) to gain exposure while learning about metaverse infrastructure projects
✅ Experienced investors: Consider strategic positioning with proper risk management, focusing on technical analysis and project development milestones
✅ Institutional investors: Conduct comprehensive due diligence on platform development, team capabilities, and competitive landscape before considering allocation
STT Trading Participation Methods
- Spot trading: Direct purchase and holding of STT tokens through Gate.com's trading platform
- Dollar-cost averaging: Regular small purchases to mitigate timing risk and smooth entry price
- Active monitoring: Track project announcements and development updates to inform trading decisions
Cryptocurrency investment carries extremely high risk, and this article does not constitute investment advice. Investors should make cautious decisions based on their own risk tolerance and are advised to consult professional financial advisors. Never invest more than you can afford to lose.
FAQ
What is STT? What are the uses and application scenarios of STT tokens?
STT is the native utility token of the Statter blockchain, serving as the fundamental currency across the ecosystem. It's used for paying transaction fees, powering decentralized applications (dApps), NFT platforms, smart contracts, and incentivizing network participants through staking and governance mechanisms.
What are the main factors affecting STT price?
STT price is primarily influenced by its fixed total supply mechanism, which creates scarcity as demand grows. Adoption rate increases and technological innovation drive price appreciation. Market sentiment and overall crypto market trends also significantly impact STT valuations.
How to conduct STT price prediction? What are the analysis methods?
STT price prediction uses three main methods: technical analysis, capital flow analysis, and market growth pattern analysis. Predictions suggest STT could reach $0.31706 in 2026, with potential 246.29% growth by 2029. Price ranges span from $0.000958 to $0.011288.
STT reached an all-time high of 137.05 USD and a low of 0.13 USD. Recent price movements have surpassed historical peaks, with an upward trend currently dominating market sentiment and trading activity.
What are professional analysts' predictions for STT's future price?
Professional analysts predict STT's future price range between 135.00 and 164.00 USD. These forecasts are based on current market analysis and represent the highest and lowest valuation estimates for the token's potential growth trajectory.
What are the risks of investing in STT? Is the price volatility high?
STT exhibits significant price volatility typical of emerging crypto assets. Market fluctuations can be substantial due to low liquidity and speculative trading. Investors should be prepared for rapid price swings and potential losses.
What are the price advantages of STT compared to similar tokens?
STT offers strong long-term growth potential with projected 246.29% increase by 2029 and predicted peak price of $0.31706. Its technological innovation and market positioning provide competitive advantages over similar tokens in the ecosystem.
* The information is not intended to be and does not constitute financial advice or any other recommendation of any sort offered or endorsed by Gate.