This comprehensive analysis examines TCT (TokenClub) price dynamics from 2026-2031. Currently trading at $0.0005029 with a $291,086 market cap, TCT demonstrates extreme fear sentiment (index: 6) amid concentrated ownership (50.38% held by top address). The article provides detailed price forecasts across conservative, neutral, and optimistic scenarios, ranging from $0.00029 to $0.00109 by 2031. Key drivers include ecosystem development, institutional adoption, macroeconomic trends, and technological advancement. Investment strategies address long-term holding, active trading, and risk management frameworks suitable for various investor profiles. Risk factors encompassing liquidity constraints, regulatory uncertainty, and smart contract vulnerabilities require careful consideration before investing in this micro-cap altcoin available on Gate.
Introduction: TCT's Market Position and Investment Value
TokenClub (TCT), positioned as a tokenized digital currency investment service community, has been serving investors since its launch in 2018. As of 2026, TCT maintains a market capitalization of approximately $291,086, with a circulating supply of around 578.82 million tokens, and its price hovers at $0.0005029. This asset, designed as a functional token within the TokenClub ecosystem, plays a role in value transfer, community incentives, and investment services.
This article will comprehensively analyze TCT's price trends from 2026 to 2031, combining historical patterns, market supply and demand dynamics, ecosystem development, and macroeconomic conditions to provide investors with professional price forecasts and practical investment strategies.
I. TCT Price History Review and Current Market Status
TCT Historical Price Evolution Trajectory
- 2018: TokenClub (TCT) was published on January 11, 2018, marking its official entry into the cryptocurrency market
- 2021: On May 9, 2021, TCT reached a price milestone of $0.110162, representing a significant peak in its trading history
- 2024: The market experienced considerable adjustment, with the price declining to $0.00023584 on September 16, 2024
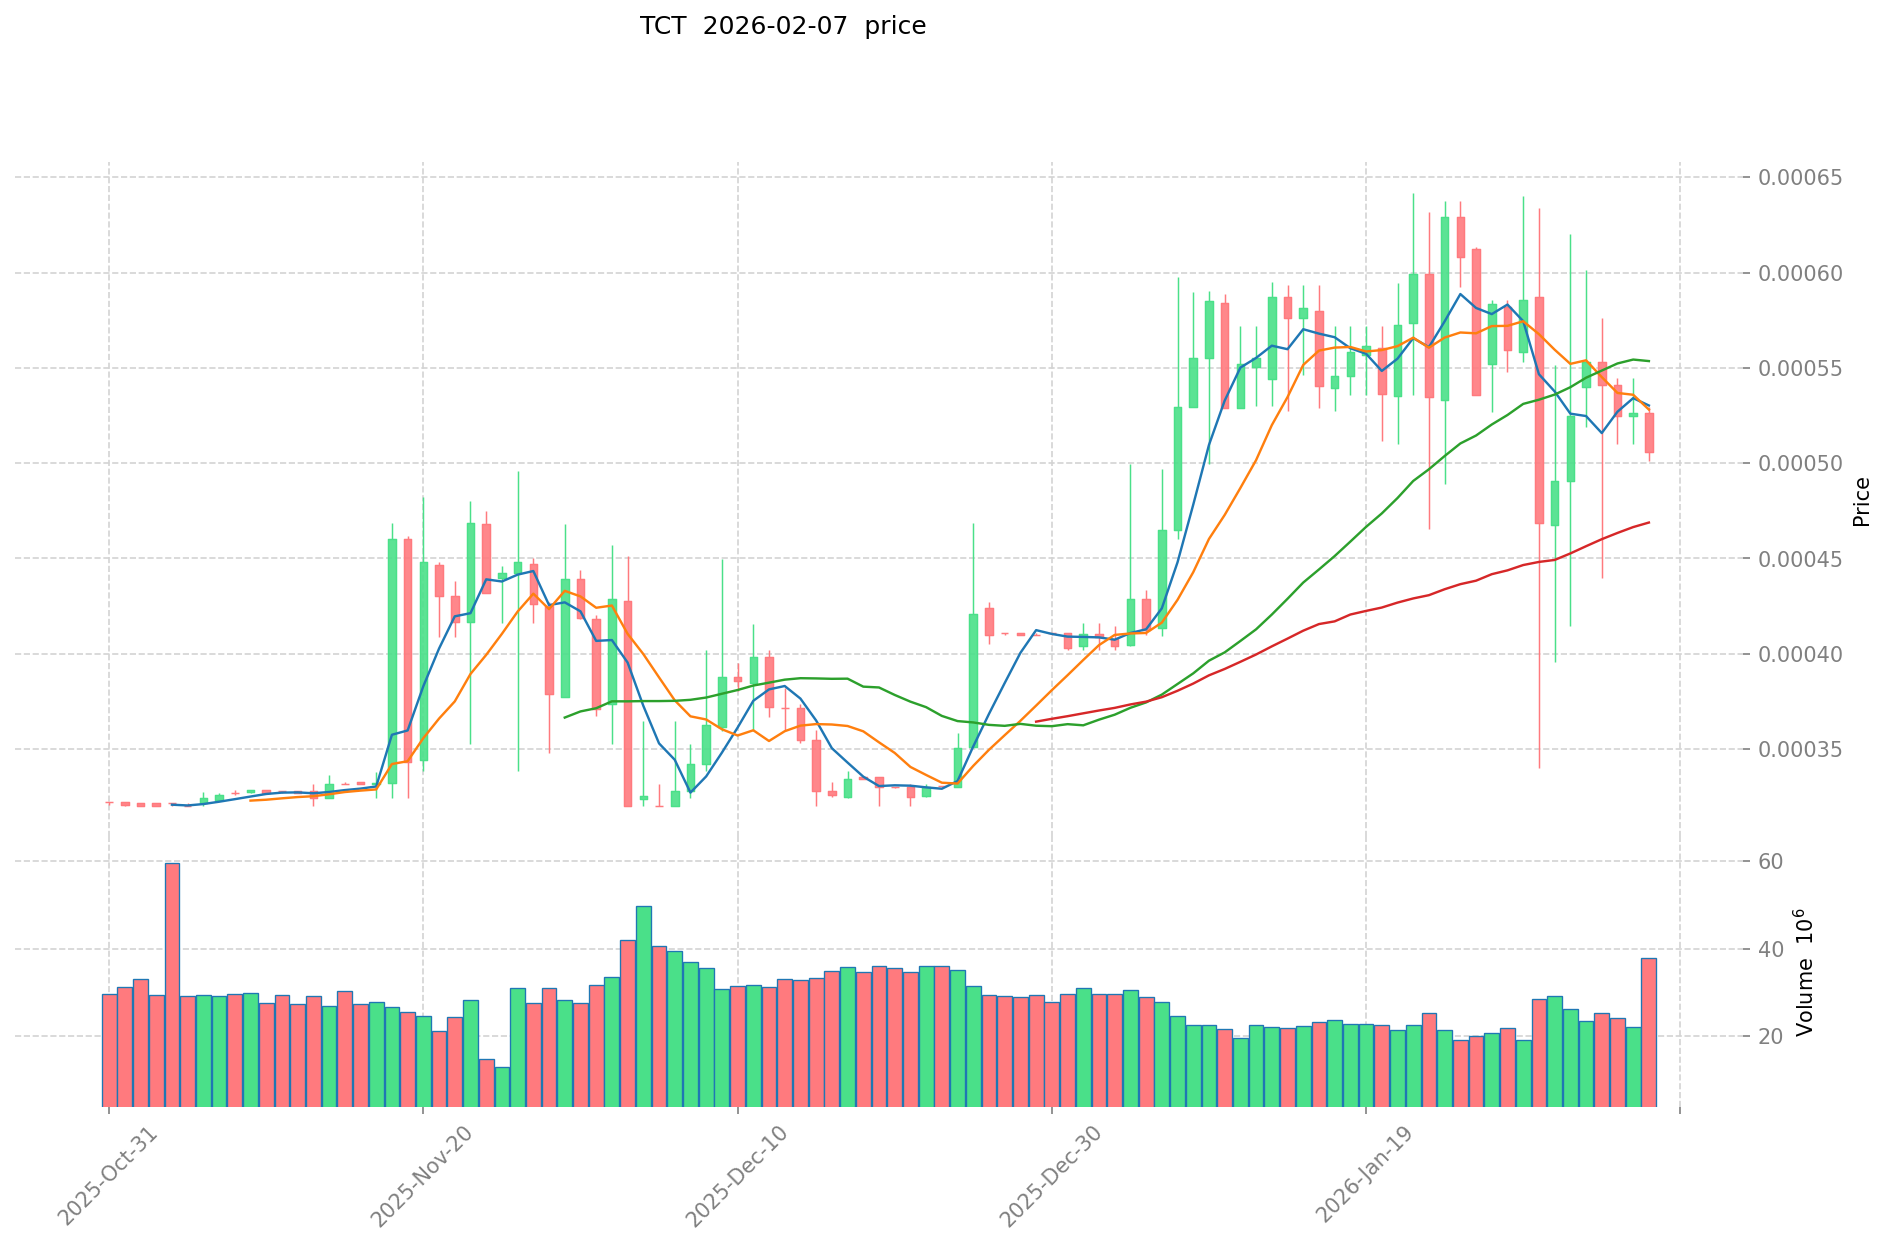
TCT Current Market Situation
As of February 7, 2026, TCT is trading at $0.0005029, showing a decline of 1.43% over the past 24 hours. The 24-hour trading range has been between $0.0005013 and $0.0005102, with a total trading volume of $21,027.02.
From a short-term perspective, TCT has experienced a slight decrease of 0.24% in the past hour. However, the 7-day performance shows a recovery trend with a gain of 5.28%. The 30-day trend indicates a decline of 12.2%, while the 1-year performance demonstrates a notable increase of 67.58%.
The current market capitalization stands at approximately $291,086.54, with a circulating supply of 578,815,946 TCT tokens, representing 57.88% of the total supply of 1 billion tokens. The fully diluted market cap is calculated at $502,900. TCT's market dominance is recorded at 0.000020%, and the token is currently held by 24,414 addresses.
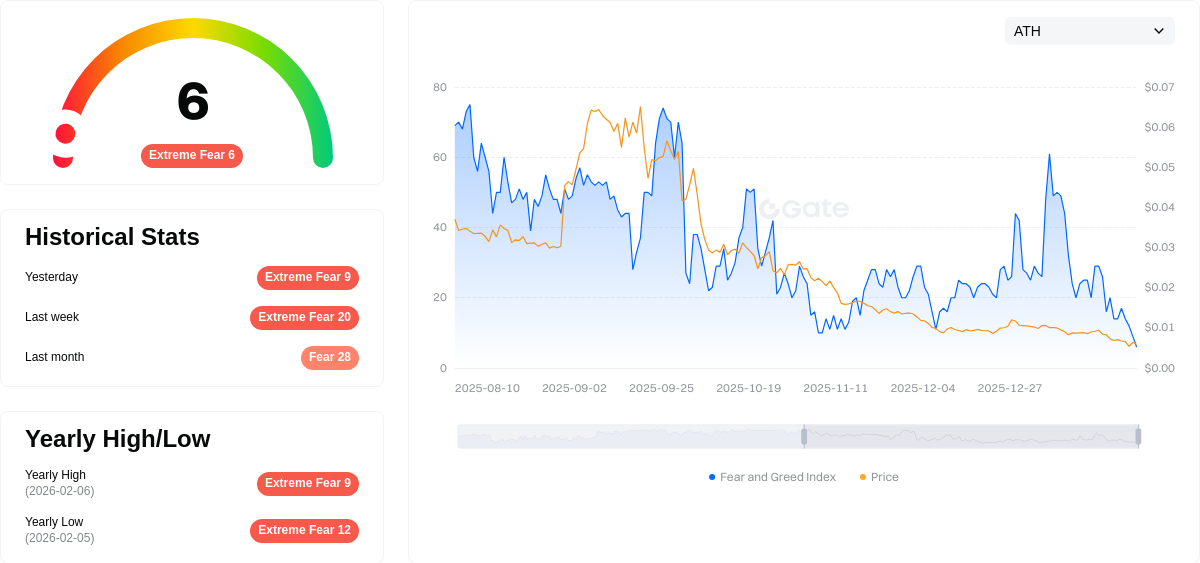
The current market sentiment index is at 6, indicating an "Extreme Fear" level in the cryptocurrency market, which may influence investor behavior and trading patterns.
Click to view the current TCT market price
TCT Market Sentiment Indicator
2026-02-07 Fear and Greed Index: 6 (Extreme Fear)
Click to view the current Fear & Greed Index
The cryptocurrency market is currently experiencing extreme fear, with the Fear and Greed Index plummeting to just 6 points. This extraordinarily low reading signals severe market pessimism and heightened investor anxiety. Such extreme fear conditions typically indicate capitulation-level sentiment, where panic selling dominates and risk appetite reaches historical lows. Traders should exercise caution during such volatile periods, as extreme emotions often precede significant market reversals. Consider your risk tolerance carefully before making any trading decisions in these highly uncertain market conditions.
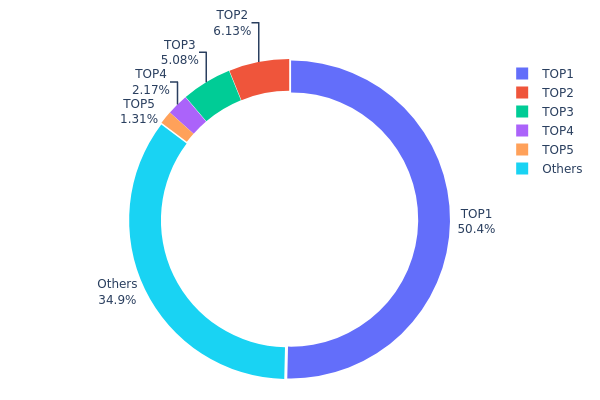
TCT Holding Distribution
The holding distribution chart reveals the concentration of token ownership across different wallet addresses, serving as a crucial indicator of market structure and decentralization level. As of February 7, 2026, TCT exhibits a highly concentrated ownership pattern, with the top address controlling 503,825.76K tokens, representing 50.38% of the total supply. The top five addresses collectively hold approximately 65.07% of the total circulation, indicating significant centralization risk in the current market structure.
This level of concentration presents notable implications for price stability and market dynamics. The dominant position of the largest holder creates substantial selling pressure potential, as any significant liquidation from this address could trigger sharp price movements. The second through fifth largest holders maintain more moderate positions ranging from 1.31% to 6.13%, providing some buffer against single-entity market manipulation. However, the combined influence of major holders remains considerable, potentially affecting liquidity depth and price discovery mechanisms.
The "Others" category accounts for 34.93% of total supply distributed among remaining addresses, suggesting a relatively limited retail participation base. This distribution pattern indicates that TCT currently operates with lower decentralization compared to more mature crypto assets, where token ownership typically demonstrates broader dispersion. Market participants should recognize that this concentration structure may result in heightened volatility during periods of major holder activity, while also potentially limiting the token's resilience against coordinated market actions.
Click to view current TCT Holding Distribution
| Top |
Address |
Holding Qty |
Holding (%) |
| 1 |
0x0d07...b492fe |
503825.76K |
50.38% |
| 2 |
0x47ac...a6d503 |
61300.00K |
6.13% |
| 3 |
0x91d4...c8debe |
50849.27K |
5.08% |
| 4 |
0x8ab9...4274fc |
21739.53K |
2.17% |
| 5 |
0xe67a...6d6e19 |
13119.79K |
1.31% |
| - |
Others |
349165.65K |
34.93% |
II. Core Factors Influencing TCT Future Price Trends
Supply Mechanism
-
Market Demand and Supply Balance: TCT pricing is primarily influenced by the balance between market demand and available supply. According to historical data from healthcare diagnostic companies, when B-ultrasound equipment usage increases significantly, it typically drives higher profitability for related testing services, which can positively impact TCT service pricing power.
-
Historical Patterns: Over the 2015-2022 period, companies in the medical diagnostics sector experienced revenue growth ranging from 30% to over 100% year-over-year during expansion phases, suggesting strong demand elasticity for diagnostic services including TCT.
-
Current Impact: Recent market conditions indicate that supply chain optimization and operational efficiency improvements remain key drivers. Companies have been implementing "inspection + product" integrated business models and strengthening supply chain management, which may help stabilize pricing structures.
Institutional and Major Stakeholder Dynamics
-
Institutional Holdings: Major healthcare diagnostic companies have been actively investing in laboratory infrastructure and expanding their service networks. Strategic investments in core business areas, including pathology and testing platforms, demonstrate institutional confidence in the sector's growth potential.
-
Enterprise Adoption: Leading medical institutions and hospitals continue to expand their adoption of comprehensive diagnostic services. The integration of TCT testing into routine health examination packages has become increasingly common, supporting steady demand.
-
Policy Environment: Regulatory policies supporting healthcare infrastructure development and quality improvement initiatives have created a favorable environment for diagnostic service providers. However, specific taxation policies and healthcare reforms may introduce periodic adjustments to operational costs.
Macroeconomic Environment
-
Economic Cycle Impact: The diagnostic services sector has demonstrated resilience during economic fluctuations, as healthcare demand tends to be relatively inelastic. However, economic downturns can affect discretionary health examinations and routine screenings.
-
Healthcare Spending Trends: As disposable incomes rise and health awareness increases, consumer willingness to invest in preventive healthcare services, including TCT screening, has shown an upward trend.
-
Regional Market Factors: Geographic expansion into underserved markets and optimization of service network coverage present opportunities for volume growth, which may influence pricing strategies across different regions.
Technological Development and Ecosystem Building
-
Automation and Efficiency Enhancement: Investment in laboratory information systems and automated testing platforms has improved operational efficiency. Companies have been deploying advanced equipment and standardized processes to reduce per-unit testing costs while maintaining quality standards.
-
Digital Integration: The integration of IT infrastructure and data management systems enables better resource allocation and customer service optimization. This technological foundation supports scalability and may contribute to more competitive pricing structures.
-
Quality and Service Differentiation: Continued focus on technical expertise, quality control, and comprehensive service offerings helps maintain competitive positioning. Companies investing in talent development and laboratory capabilities may be better positioned to sustain pricing power in the market.
III. 2026-2031 TCT Price Forecast
2026 Outlook
- Conservative estimate: $0.00029
- Neutral estimate: $0.0005
- Optimistic estimate: $0.00072 (requiring favorable market conditions and increased adoption)
Based on the provided data, TCT is expected to trade within a relatively stable range throughout 2026, with the average price hovering around $0.0005. The token shows limited volatility in its initial forecast period, suggesting a phase of market consolidation and gradual ecosystem development.
2027-2029 Mid-term Outlook
- Market phase expectation: Gradual growth trajectory with incremental value appreciation
- Price range forecast:
- 2027: $0.00036 - $0.00077 (average $0.00061, representing approximately 21% growth)
- 2028: $0.0006 - $0.00086 (average $0.00069, marking 37% cumulative growth)
- 2029: $0.00067 - $0.00086 (average $0.00078, achieving 54% total appreciation)
- Key catalysts: Progressive ecosystem maturation, potential expansion of use cases, and broader market recovery trends may contribute to this upward momentum
The mid-term period demonstrates a consistent upward trend, with price floors steadily rising from $0.00036 in 2027 to $0.00067 in 2029, indicating strengthening support levels and growing market confidence.
2030-2031 Long-term Outlook
- Baseline scenario: $0.00044 - $0.00085 (average $0.00082, representing 62% growth from 2026 baseline)
- Optimistic scenario: $0.00075 - $0.00109 (average $0.00083, achieving 65% cumulative appreciation by 2031)
- Transformative scenario: Price ceiling potentially reaching $0.00109 in 2031 under exceptionally favorable conditions including substantial ecosystem expansion and widespread adoption
The long-term forecast suggests TCT may experience moderate but sustained growth through 2031, with the potential to achieve over 60% appreciation from current levels. However, investors should note the widening price range in 2030, indicating potential volatility or market uncertainty during that period. The stabilization and upward trajectory resuming in 2031 suggests potential recovery and renewed growth momentum.
| Year |
Predicted High Price |
Predicted Average Price |
Predicted Low Price |
Price Change |
| 2026 |
0.00072 |
0.0005 |
0.00029 |
0 |
| 2027 |
0.00077 |
0.00061 |
0.00036 |
21 |
| 2028 |
0.00086 |
0.00069 |
0.0006 |
37 |
| 2029 |
0.00086 |
0.00078 |
0.00067 |
54 |
| 2030 |
0.00085 |
0.00082 |
0.00044 |
62 |
| 2031 |
0.00109 |
0.00083 |
0.00075 |
65 |
IV. TCT Professional Investment Strategies and Risk Management
TCT Investment Methodology
(1) Long-term Holding Strategy
- Target Investors: Investors seeking exposure to blockchain-based investment community platforms with moderate risk tolerance
- Operational Recommendations:
- Consider accumulating positions during market corrections when price approaches support levels around $0.0005
- Monitor the project's community engagement metrics and platform development progress as indicators of long-term viability
- Implement a dollar-cost averaging approach to mitigate entry timing risk given the token's price volatility
- Storage Solution: Utilize Gate Web3 Wallet for secure storage with multi-signature functionality, or consider hardware wallet solutions for larger holdings
(2) Active Trading Strategy
- Technical Analysis Tools:
- Moving Averages: Monitor 50-day and 200-day moving averages to identify trend direction and potential reversal points given TCT's historical price fluctuations
- Volume Analysis: Track 24-hour trading volume patterns as TCT's current volume of approximately $21,027 indicates relatively limited liquidity
- Swing Trading Considerations:
- Establish clear entry and exit points based on recent price ranges between $0.0005013 and $0.0005102
- Set stop-loss orders at 5-8% below entry price to protect against sudden downside movements
- Consider profit-taking strategies when price approaches resistance levels near recent 7-day highs
TCT Risk Management Framework
(1) Asset Allocation Principles
- Conservative Investors: Allocate no more than 0.5-1% of crypto portfolio to TCT given its lower market cap and limited exchange presence
- Aggressive Investors: May consider 2-3% allocation as part of a diversified altcoin portfolio strategy
- Professional Investors: Position sizing should account for liquidity constraints and market depth limitations
(2) Risk Hedging Solutions
- Portfolio Diversification: Balance TCT exposure with more established cryptocurrencies and stablecoins to reduce concentration risk
- Position Sizing: Limit individual position size based on 24-hour trading volume to ensure exit liquidity
- Regular Rebalancing: Review and adjust positions quarterly or when TCT's portfolio weight deviates significantly from target allocation
(3) Secure Storage Solutions
- Hot Wallet Recommendation: Gate Web3 Wallet offers convenient access for active traders with enhanced security features
- Cold Storage Solution: For long-term holdings, consider transferring tokens to hardware wallets supporting ERC-20 tokens
- Security Precautions: Enable two-factor authentication, maintain backup recovery phrases in secure offline locations, and regularly verify contract address (0x4824A7b64E3966B0133f4f4FFB1b9D6bEb75FFF7) before transactions
V. TCT Potential Risks and Challenges
TCT Market Risks
- Liquidity Risk: With daily trading volume around $21,027 and presence on limited exchanges, TCT faces significant liquidity constraints that may impact execution prices for larger orders
- Price Volatility: Historical price range from $0.00023584 to $0.110162 demonstrates extreme volatility that could result in substantial portfolio value fluctuations
- Market Capitalization Risk: Current market cap of approximately $291,087 places TCT in the micro-cap category, which typically experiences higher volatility and delisting risks
TCT Regulatory Risks
- Investment Advisory Compliance: As a platform offering investment-related services, TokenClub may face evolving regulatory scrutiny regarding advisory services in various jurisdictions
- Token Classification Uncertainty: Changes in regulatory frameworks concerning utility tokens could impact TCT's operational model and market accessibility
- Cross-border Service Restrictions: Potential limitations on providing investment community services across different regulatory environments may affect platform growth
TCT Technical Risks
- Smart Contract Risk: As an ERC-20 token, TCT inherits risks associated with the Ethereum blockchain and its underlying smart contract code
- Platform Dependency: Token utility is closely tied to TokenClub platform adoption and continued operation
- Technology Obsolescence: The investment community model faces competition from emerging decentralized finance platforms and newer blockchain investment tools
VI. Conclusion and Action Recommendations
TCT Investment Value Assessment
TokenClub (TCT) presents a specialized investment opportunity within the blockchain-based investment community sector. With a current price of $0.0005029 and a circulating supply of approximately 579 million tokens, TCT's market positioning reflects its niche focus on tokenized investment services. The token's 67.58% year-over-year gain demonstrates potential for returns, though recent 30-day performance showing a 12.2% decline suggests near-term volatility. The platform's value proposition centers on connecting investors through a tokenized ecosystem, though adoption metrics and platform activity will be critical determinants of long-term success. Investors should weigh the innovative community model against liquidity limitations and competitive pressures from broader DeFi platforms.
TCT Investment Recommendations
✅ Beginners: Limit exposure to less than 1% of total crypto portfolio due to liquidity constraints and platform-specific risks. Focus on understanding the TokenClub ecosystem before committing significant capital, and start with small test transactions to familiarize yourself with the token mechanics.
✅ Experienced Investors: Consider TCT as a satellite position within an altcoin portfolio with maximum 2-3% allocation. Monitor platform development updates and community growth metrics as indicators of potential value appreciation. Implement strict stop-loss protocols given the token's volatility profile.
✅ Institutional Investors: Conduct thorough due diligence on TokenClub's operational metrics, user acquisition trends, and competitive positioning before considering position initiation. Factor in liquidity constraints for position sizing and potential exit strategies.
TCT Trading Participation Methods
- Spot Trading: Execute buy and sell orders on Gate.com with attention to order book depth and potential slippage for larger positions
- Dollar-Cost Averaging: Implement systematic purchase plans to build positions gradually while mitigating timing risk in volatile market conditions
- Limit Orders: Use limit orders rather than market orders to optimize execution prices and avoid unfavorable fills in low-liquidity conditions
Cryptocurrency investment carries extreme risks, and this article does not constitute investment advice. Investors should make prudent decisions based on their own risk tolerance and are advised to consult professional financial advisors. Never invest more than you can afford to lose.
FAQ
What is TCT? What are its uses and value?
TCT is a utility token in the Web3 ecosystem designed for decentralized applications and governance. Its value derives from network utility, transaction demand, and ecosystem growth potential. TCT enables protocol participation, staking rewards, and access to exclusive platform features.
What are the main factors affecting TCT price?
TCT price is influenced by market demand, token utility, ecosystem development, regulatory environment, and overall crypto market sentiment. Strong adoption and partnerships typically drive positive price movement.
How to predict TCT price? What are the analysis methods?
TCT price prediction uses technical and fundamental analysis. Common methods include moving averages, RSI indicators, trading volume analysis, market sentiment, and on-chain metrics to forecast price trends.
What is TCT's historical price trend? What stage is it currently in?
TCT has experienced remarkable growth, with a 1287.03% increase over the past 30 days and 1042.09% growth over the last 6 months. Currently, TCT is in a significant uptrend phase, with a 4.19% increase in the last 24 hours as of February 7, 2026.
What are the risks of investing in TCT? How should I assess these risks?
TCT investment carries market volatility and potential capital loss risks. Assess risks by evaluating your financial capacity, investment horizon, and risk tolerance. Consider your portfolio diversification and consult financial advisors for personalized guidance.
What is the difference between TCT and other mainstream cryptocurrencies such as BTC and ETH?
TCT is primarily designed for asset transfer, while BTC and ETH are complete blockchain networks supporting multiple applications. BTC handles only bitcoin transactions, whereas ETH enables diverse applications and smart contracts on its platform.
* The information is not intended to be and does not constitute financial advice or any other recommendation of any sort offered or endorsed by Gate.