2026 TMAI Price Prediction: Expert Analysis and Market Forecast for the Next Bull Run

Introduction: TMAI's Market Position and Investment Value
Token Metrics AI (TMAI), as an innovative AI-powered cryptocurrency designed to empower the crypto community with advanced trading tools and insights, has been making its mark since its launch in December 2024. As of February 2026, TMAI maintains a market capitalization of approximately $518,976, with a circulating supply of around 8.096 billion tokens, and the price hovering near $0.0000641. This asset, characterized as an "AI-driven trading intelligence token," is playing an increasingly important role in automated trading strategy execution across both centralized and decentralized exchanges.
This article will comprehensively analyze TMAI's price trajectory from 2026 through 2031, combining historical patterns, market supply-demand dynamics, ecosystem development, and macroeconomic conditions to provide investors with professional price forecasts and practical investment strategies.
I. TMAI Price History Review and Market Status
TMAI Historical Price Evolution Trajectory
- December 2024: Token launch with an initial price of $0.004, reaching an all-time high of $0.017747 on December 17, 2024
- February 2026: Price experienced significant decline, touching an all-time low of $0.00006099 on February 4, 2026
TMAI Current Market Situation
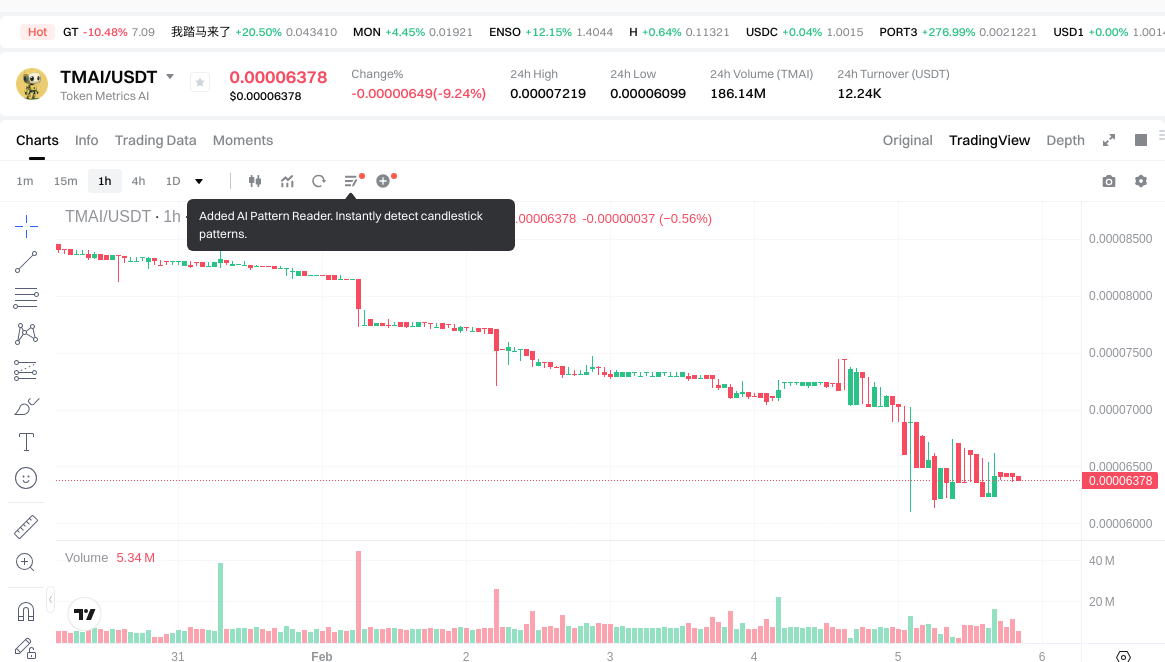
As of February 5, 2026, TMAI is trading at $0.0000641, representing a decline of 8.8% over the past 24 hours. The token has shown negative price momentum across multiple timeframes, with a 0.4% decrease in the last hour, 25.89% decline over the past 7 days, and 47.47% drop over the past 30 days. The annual performance indicates a substantial decline of 97.61% from its price level one year ago.
The 24-hour trading range spans from a low of $0.00006099 to a high of $0.00007228, with a total trading volume of $12,215.44. The current market capitalization stands at approximately $518,976, with a fully diluted market cap of $641,000. The token maintains a circulating supply of 8,096,355,748 TMAI, representing 80.96% of the maximum supply of 10 billion tokens.
TMAI holds 75,812 token holders and is available for trading on 2 exchanges. The market cap to fully diluted valuation ratio stands at 80.96%, indicating a relatively high proportion of tokens already in circulation. The current market conditions reflect an "Extreme Fear" sentiment with a volatility index of 12.
Click to view the current TMAI market price
TMAI Market Sentiment Index
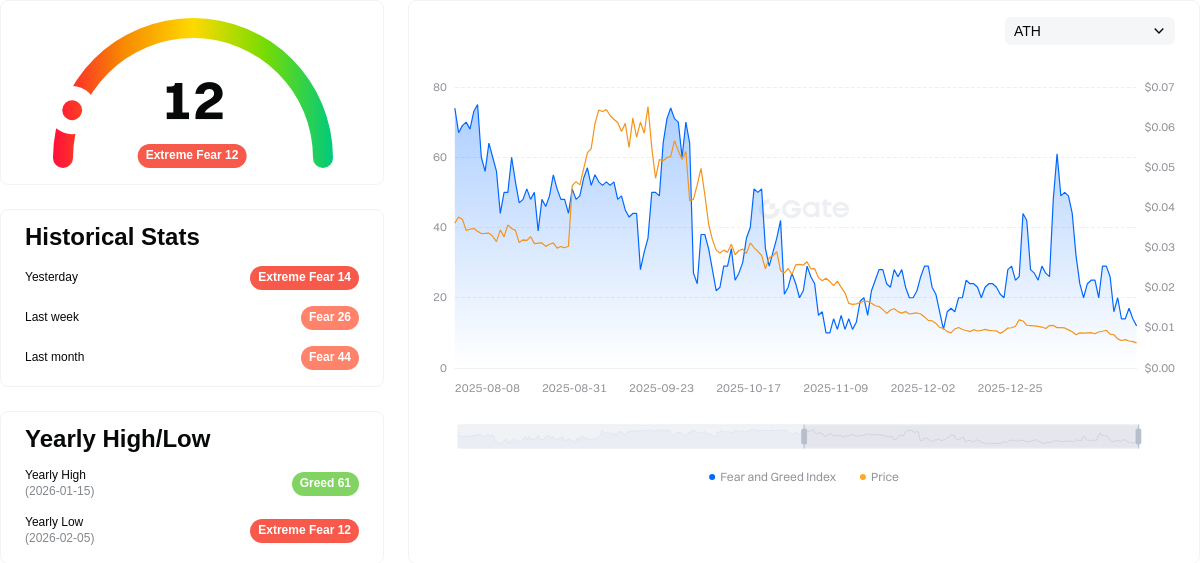
02-05-2026 Fear and Greed Index: 12(Extreme Fear)
Click to view current Fear & Greed Index
The cryptocurrency market is currently experiencing extreme fear, with the Fear and Greed Index dropping to 12. This historically low reading suggests significant market pessimism and widespread investor anxiety. Such extreme fear conditions often present contrarian opportunities for long-term investors, as panic selling typically creates undervalued entry points. However, traders should remain cautious and conduct thorough due diligence before making investment decisions. Monitor market developments closely on Gate.com for real-time data and trading opportunities during this volatile period.
TMAI Token Holding Distribution
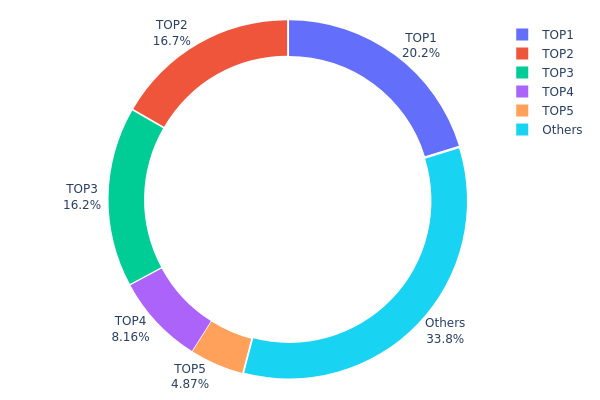
The token holding distribution chart reflects the allocation of TMAI tokens across different wallet addresses, serving as a critical indicator of decentralization level and on-chain structural stability. By analyzing the concentration of holdings among top addresses, we can assess potential risks related to market manipulation and price volatility patterns.
According to current data, TMAI exhibits a moderately concentrated holding structure. The top holder controls approximately 20.23% of the total supply (2,023,603.11K tokens), while the second and third largest addresses hold 16.65% and 16.23% respectively. Notably, the top three addresses collectively account for 53.11% of total circulation, indicating significant concentration risk. However, the "Others" category represents 33.88% of holdings, suggesting a relatively diverse base of smaller participants. This distribution pattern places TMAI in a moderate concentration zone—not as decentralized as ideal, but not reaching extreme centralization levels seen in some early-stage projects.
This concentration structure has multiple implications for market dynamics. The substantial holdings by top addresses create potential volatility triggers, as large-scale transactions from these wallets could significantly impact market prices. Additionally, coordinated actions among major holders could theoretically influence price movements, though this remains speculative without evidence of actual coordination. The current distribution reflects a market structure transitioning from early development toward broader adoption, where founding teams, early investors, or strategic partners still maintain considerable influence over token supply and market sentiment.
Click to view current TMAI Token Holding Distribution
| Top | Address | Holding Qty | Holding (%) |
|---|---|---|---|
| 1 | 0x0529...c553b7 | 2023603.11K | 20.23% |
| 2 | 0xbbee...300464 | 1665823.08K | 16.65% |
| 3 | 0x1494...c4e5d7 | 1623668.17K | 16.23% |
| 4 | 0x0d07...b492fe | 815666.35K | 8.15% |
| 5 | 0x5383...d012f8 | 486771.72K | 4.86% |
| - | Others | 3384467.57K | 33.88% |
II. Core Factors Affecting TMAI's Future Price
Supply Mechanism
- Smart Trading Concept: TMAI operates based on artificial intelligence technology designed to enhance trading efficiency. The platform utilizes advanced data analytics to provide proprietary signals that guide users in trading decisions.
- Historical Pattern: Trading signals derived from extensive historical data and market trend analysis help users identify potential investment opportunities, which may influence demand dynamics over time.
- Current Impact: As TMAI continues to develop its AI-driven signal system, increased adoption could strengthen demand, potentially supporting price appreciation.
Institutional and Major Holder Dynamics
- Institutional Holdings: Specific institutional holding data for TMAI is not available in the provided materials.
- Enterprise Adoption: Information regarding known enterprises adopting TMAI is not available in the provided materials.
- National Policies: Regulatory environment considerations remain important, though specific national-level policies directly targeting TMAI are not detailed in the available sources.
Macroeconomic Environment
- Monetary Policy Impact: Broader cryptocurrency market trends and overall market sentiment affect TMAI's price trajectory, though specific central bank policy expectations are not outlined in the materials.
- Inflation Hedge Attributes: The relationship between TMAI and inflation dynamics is not specifically addressed in the available information.
- Geopolitical Factors: International circumstances can influence cryptocurrency markets broadly, though direct geopolitical impacts on TMAI are not documented in the provided sources.
Technological Development and Ecosystem Building
- AI-Driven Trading Signals: TMAI leverages sophisticated data analysis techniques to generate trading signals based on historical data and market trends, helping users make informed investment decisions.
- Smart Trading Technology: The platform's core philosophy centers on intelligent trading powered by artificial intelligence, aiming to improve overall trading efficiency for users.
- Ecosystem Applications: While TMAI focuses on providing trading signals and analytical tools, specific details about major DApps or ecosystem projects are not available in the provided materials.
III. 2026-2031 TMAI Price Prediction
2026 Outlook
- Conservative Prediction: $0.00005
- Neutral Prediction: $0.00006
- Optimistic Prediction: $0.00007 (requires favorable market conditions)
2027-2029 Outlook
- Market Stage Expectation: The market may enter a gradual growth phase with increasing adoption and ecosystem development
- Price Range Prediction:
- 2027: $0.00004 - $0.00009
- 2028: $0.00007 - $0.00012
- 2029: $0.00009 - $0.00012
- Key Catalysts: Enhanced platform utility, broader market acceptance, and potential technological integrations
2030-2031 Long-term Outlook
- Baseline Scenario: $0.00006 - $0.00013 (assuming steady market growth and sustained project development)
- Optimistic Scenario: $0.00011 - $0.00017 (assuming accelerated adoption and favorable regulatory environment)
- Transformative Scenario: Potential breakthrough above $0.00017 (requires exceptional market conditions and widespread ecosystem expansion)
- February 5, 2026: TMAI maintains early-stage valuation levels as the project continues development
| Year | Predicted High Price | Predicted Average Price | Predicted Low Price | Price Change |
|---|---|---|---|---|
| 2026 | 0.00007 | 0.00006 | 0.00005 | 0 |
| 2027 | 0.00009 | 0.00007 | 0.00004 | 2 |
| 2028 | 0.00012 | 0.00008 | 0.00007 | 25 |
| 2029 | 0.00012 | 0.0001 | 0.00009 | 55 |
| 2030 | 0.00013 | 0.00011 | 0.00006 | 71 |
| 2031 | 0.00017 | 0.00012 | 0.00007 | 83 |
IV. TMAI Professional Investment Strategies and Risk Management
TMAI Investment Methodology
(1) Long-Term Holding Strategy
- Suitable for: Investors seeking exposure to AI-powered trading tools and those who believe in the long-term potential of algorithmic trading solutions in the crypto ecosystem
- Operational Recommendations:
- Consider dollar-cost averaging to mitigate volatility risk, given TMAI's significant price fluctuations (down 97.61% year-over-year)
- Monitor the development and adoption of Token Metrics AI's trading bots and analytical tools as key indicators of fundamental value
- Utilize Gate Web3 Wallet for secure storage with self-custody capabilities
(2) Active Trading Strategy
- Technical Analysis Tools:
- Volume Analysis: With 24-hour trading volume of approximately $12,215, traders should monitor volume spikes that may indicate institutional or whale activity
- Price Action Analysis: Track support levels near the recent low of $0.00006099 and resistance near $0.00007228
- Swing Trading Key Points:
- Given the high volatility (down 8.8% in 24 hours and 25.89% over 7 days), set tight stop-loss orders
- Consider the circulating supply of approximately 8.1 billion tokens (80.96% of max supply) when assessing potential price movements
TMAI Risk Management Framework
(1) Asset Allocation Principles
- Conservative Investors: 0.5-1% of crypto portfolio allocation
- Aggressive Investors: 2-3% of crypto portfolio allocation
- Professional Investors: 3-5% of crypto portfolio allocation with active monitoring
(2) Risk Hedging Solutions
- Portfolio Diversification: Combine TMAI holdings with more established cryptocurrencies to balance risk exposure
- Position Sizing: Limit individual position size based on the token's high volatility and relatively low market capitalization of approximately $519,000
(3) Secure Storage Solutions
- Hot Wallet Option: Gate Web3 Wallet for convenient access and trading flexibility
- Cold Storage Approach: Transfer long-term holdings to hardware wallets for enhanced security
- Security Considerations: Given TMAI's deployment on BASE network, ensure wallet compatibility and always verify contract address (0xca4569949699d56e1834efe9f58747ca0f151b01) before transactions
V. TMAI Potential Risks and Challenges
TMAI Market Risks
- Extreme Volatility: The token has experienced a 97.61% decline over one year, indicating substantial downside risk potential
- Liquidity Constraints: With a relatively small market cap of approximately $519,000 and daily volume around $12,215, large trades may face slippage
- Market Ranking: Ranked at approximately #3008, indicating limited mainstream adoption and potential difficulty in finding exit liquidity
TMAI Regulatory Risks
- AI Trading Tool Classification: Regulatory uncertainty surrounding AI-powered automated trading bots may impact the project's operational framework
- Token Utility Compliance: The provision of algorithmic trading services through token holdings may face scrutiny in various jurisdictions
- Exchange Availability: Currently listed on only 2 exchanges, which may limit accessibility and increase regulatory concentration risk
TMAI Technical Risks
- Smart Contract Security: As a BASE network token, any vulnerabilities in the contract (0xca4569949699d56e1834efe9f58747ca0f151b01) could compromise user funds
- Bot Performance Dependency: The token's value proposition relies heavily on the effectiveness of the proprietary AI trading algorithms
- Integration Complexity: Compatibility claims with both centralized and decentralized exchanges require robust technical infrastructure that may face operational challenges
VI. Conclusion and Action Recommendations
TMAI Investment Value Assessment
Token Metrics AI presents an innovative value proposition by combining AI-powered trading tools with token-based access. The project targets a growing market for algorithmic trading solutions in crypto. However, significant concerns exist regarding the token's performance (down 97.61% year-over-year), limited liquidity (approximately $12,215 daily volume), and small market presence (ranked around #3008). The high circulating supply ratio (80.96%) suggests limited token scarcity benefits. While the concept of AI-driven trading automation has merit, the token faces substantial challenges in demonstrating sustainable value and market acceptance.
TMAI Investment Recommendations
✅ Beginners: Exercise extreme caution. Consider allocating no more than 0.5-1% of your crypto portfolio, and only invest funds you can afford to lose completely. Focus on understanding the project's fundamentals before committing capital.
✅ Experienced Investors: If interested in AI trading tool exposure, limit allocation to 1-3% of crypto portfolio. Closely monitor trading bot performance metrics and user adoption trends. Implement strict stop-loss protocols given the high volatility.
✅ Institutional Investors: Conduct thorough due diligence on the proprietary AI algorithms and business model sustainability. Consider the limited liquidity environment when sizing positions. Evaluate competitive positioning against established trading solution providers.
TMAI Trading Participation Methods
- Spot Trading: Purchase TMAI on Gate.com with various trading pairs, suitable for investors seeking direct token exposure
- Portfolio Integration: Include TMAI as a small allocation within a diversified crypto portfolio focused on AI and trading technology sectors
- Utility Access: Acquire tokens to gain access to Token Metrics AI's trading bots and analytical tools, evaluating the platform's value independently of price speculation
Cryptocurrency investment carries extreme risk, and this article does not constitute investment advice. Investors should make cautious decisions based on their own risk tolerance and are advised to consult professional financial advisors. Never invest more than you can afford to lose.
FAQ
What is TMAI? What are its uses and characteristics?
TMAI is a cryptocurrency project leveraging artificial intelligence to provide automated trading strategies and efficient asset management solutions for traders. Its core characteristics include intelligent technology, automation capabilities, and enhanced trading efficiency.
TMAI的当前价格是多少,历史价格走势如何?
TMAI current price is $0.00008259, down 0.45% in the last 24 hours. Historically, TMAI has shown volatile movements typical of emerging tokens, with gradual appreciation trend expected as adoption increases.
Will TMAI price rise or fall in the future? What factors will affect the price?
TMAI price direction remains uncertain, driven by supply-demand dynamics, market sentiment, regulatory developments, institutional adoption, and macroeconomic trends. Both upside and downside movements are possible depending on these combined factors.
What are the risks of investing in TMAI? How should investment value be assessed?
TMAI investment carries market volatility and technology risks. Assess value by monitoring market demand, technology development, trading volume, and ecosystem growth. Consider your risk tolerance before investing.
What are the differences and advantages of TMAI compared to other AI-related tokens?
TMAI stands out with AI-powered trading bots compatible with both centralized and decentralized exchanges, automated strategy execution using proprietary signals, and comprehensive investment analysis. Its data-driven approach and specialized focus on trading intelligence differentiate it from other AI tokens in the market.
How to buy and trade TMAI tokens? Which exchanges support trading?
You can purchase TMAI tokens through major cryptocurrency exchanges and decentralized platforms. Visit crypto exchange platforms, connect your wallet, and trade TMAI directly. Check official TMAI channels for current supported trading venues and liquidity information.
Share
Content
Introduction: TMAI's Market Position and Investment Value
I. TMAI Price History Review and Market Status
II. Core Factors Affecting TMAI's Future Price
III. 2026-2031 TMAI Price Prediction
IV. TMAI Professional Investment Strategies and Risk Management
V. TMAI Potential Risks and Challenges
VI. Conclusion and Action Recommendations
FAQ
How to Buy Cryptocurrency


Trending Cryptocurrencies


Survey Note: Detailed Analysis of the Best AI in 2025

What Is the Best AI Crypto in 2025?

What is the Best AI Now?
Why ChatGPT is Likely the Best AI Now?

How Does Solidus Ai Tech's Market Cap Compare to Other AI Cryptocurrencies?

MomoAI: AI-Powered Social Gaming Revolution on Solana

What is Jupiter Coin: Investment Analysis and Future Outlook

The 10 Best Play-to-Earn NFT Games for Earning Rewards

7 Ideas for Beginners To Create Digital Art

Squid Game – The Most Shocking Rug Pull in History. What Exactly Is a Rug Pull?
The link between Elon Musk's "America Party" and the world of cryptocurrencies