This comprehensive analysis examines TONC (TON Community) price dynamics and investment outlook from 2026 to 2031. Currently trading at $0.005258 with a market capitalization of $1.41 million, TONC represents a high-risk asset within the blockchain ecosystem. The article combines historical price review, market sentiment analysis, and supply dynamics to provide professional forecasts ranging from $0.00452 to $0.0061 in 2026, with potential growth to $0.00959 by 2031. Key sections cover ecosystem development factors, technical analysis frameworks, risk management strategies, and actionable investment methodologies through Gate trading platforms. The analysis addresses critical risks including extreme market volatility (59.68% annual decline), concentrated token holdings (66.77% held by top 5 addresses), and regulatory uncertainties, while offering tailored recommendations for different investor profiles from beginners to institutional participants seeking exposure to emerging blockchain assets.
Introduction: TONC's Market Position and Investment Value
TONCommunity (TONC), as a decentralized global blockchain network launched on TONOS, has been developing since its inception in 2020. As of 2026, TONC maintains a market capitalization of approximately $1.41 million, with a circulating supply of around 268.12 million tokens, and the price hovering around $0.005258. This asset, operating within the decentralized blockchain ecosystem, is playing a role in the broader cryptocurrency landscape.
This article will comprehensively analyze TONC's price trends from 2026 to 2031, combining historical patterns, market supply and demand dynamics, ecosystem development, and macroeconomic environment factors to provide investors with professional price forecasts and practical investment strategies.
I. TONC Price History Review and Market Status
TONC Historical Price Evolution Trajectory
- 2020: FreeTON network launched on TONOS on May 7, price reached peak level at $0.104949 on September 3
- 2021: Market correction phase, price declined to $0.00331783 on August 10
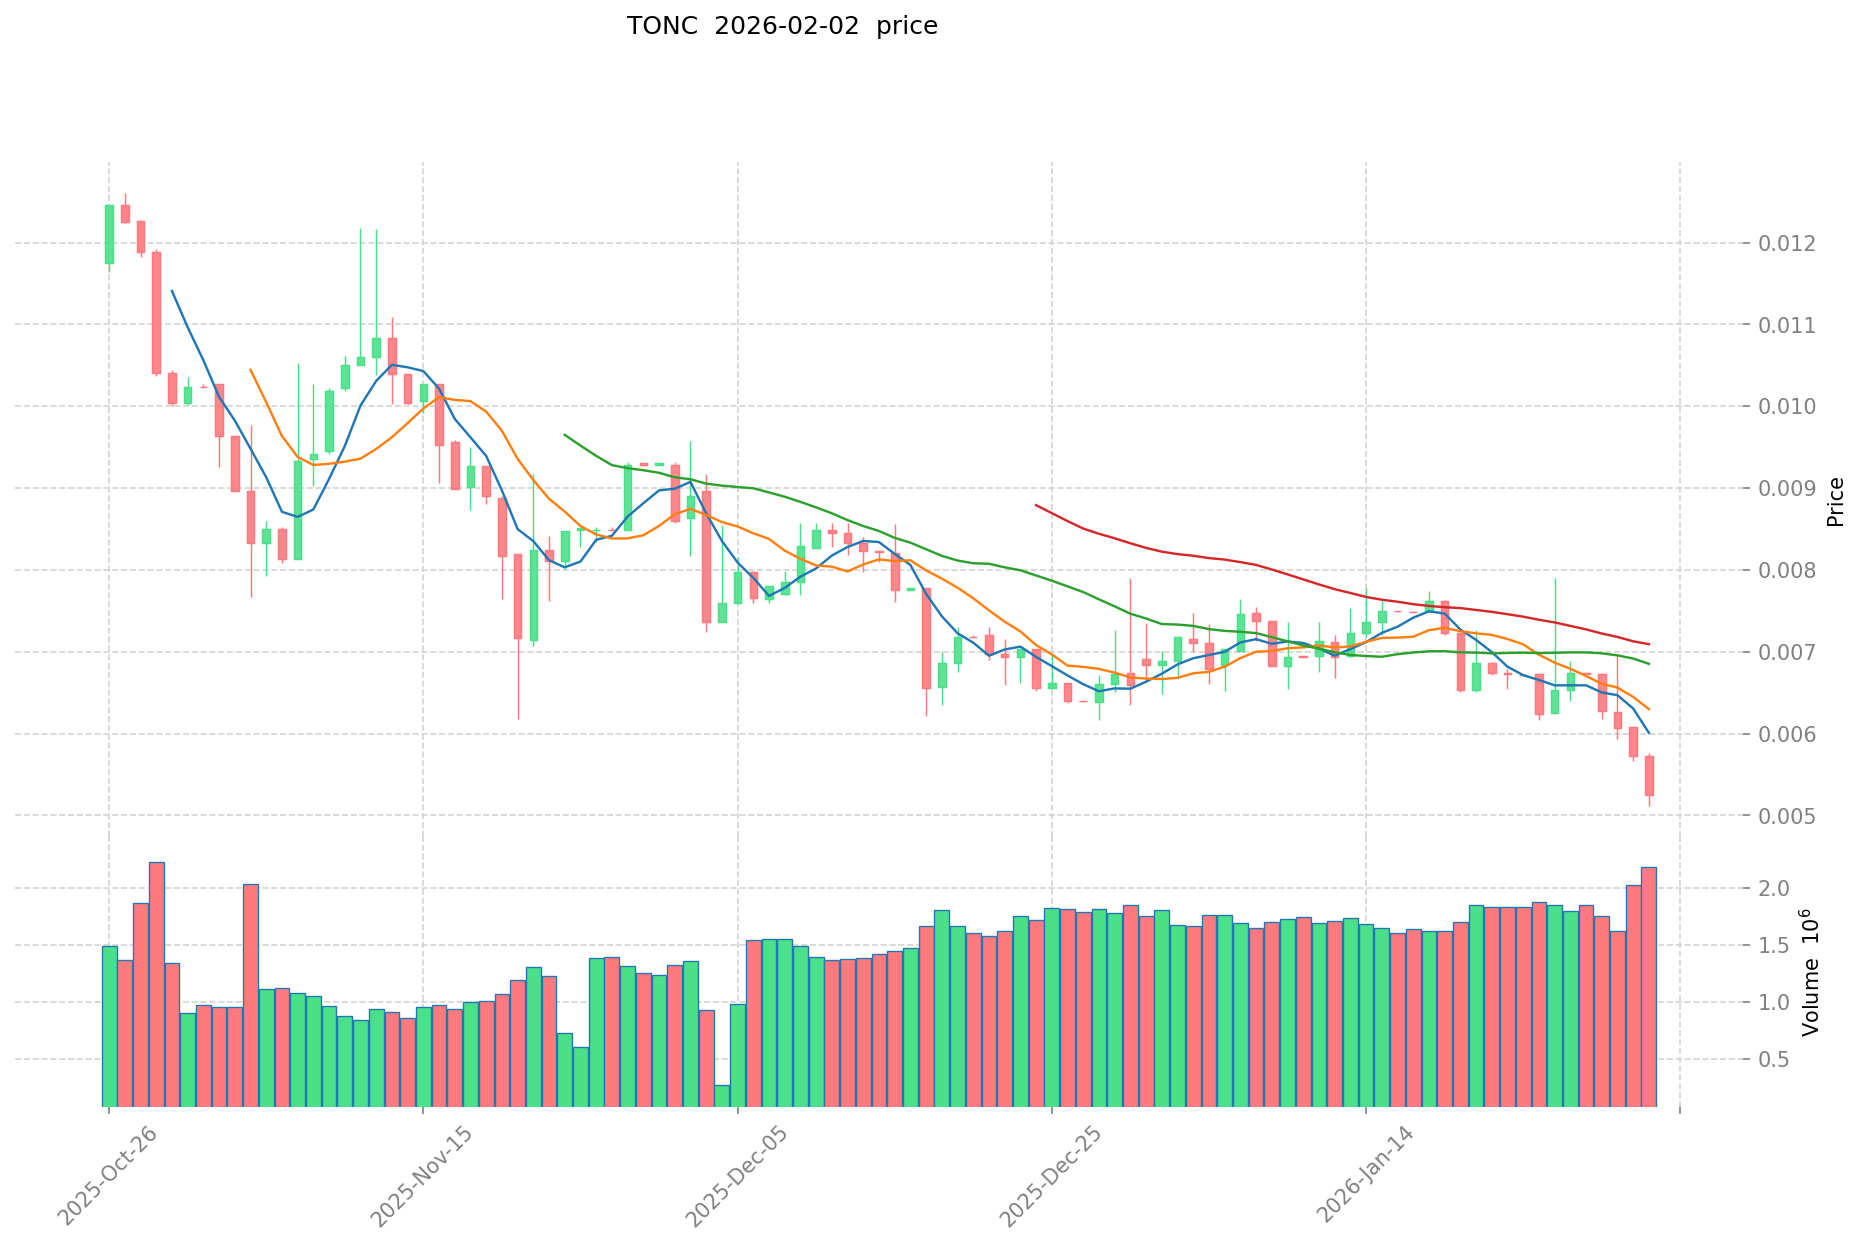
- 2024-2026: Extended downward trend, price decreased from higher levels to current trading range around $0.005258
TONC Current Market Situation
As of February 2, 2026, TONC is trading at $0.005258, representing a 2.76% increase over the past hour. The token has experienced notable volatility across different timeframes, with a 6.47% decline in the last 24 hours and a 20.26% decrease over the past week. The 30-day performance shows a 25.86% reduction, while the annual perspective reveals a 59.68% decline.
The 24-hour trading range has been between $0.005 and $0.005648, with trading volume reaching $12,465.38. The current market capitalization stands at approximately $1.41 million, with 268.12 million TONC tokens in circulation out of a total supply of 400 million tokens. This represents a circulating supply ratio of approximately 5.31%. The fully diluted market cap is calculated at $2.10 million.
TONC maintains a market dominance of 0.000077% and is held by 4,981 addresses. The token is deployed on the Ethereum blockchain with contract address 0x6a6c2ada3ce053561c2fbc3ee211f23d9b8c520a. The current price represents a significant distance from both the all-time high recorded in September 2020 and the all-time low observed in August 2021.
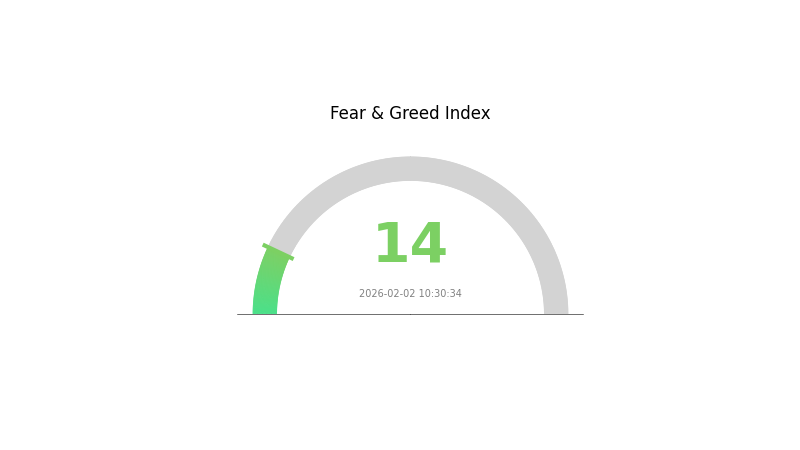
The Gate.com Crypto Fear and Greed Index currently stands at 14, indicating an "Extreme Fear" sentiment in the broader cryptocurrency market, which may influence TONC's short-term price movements.
Click to view current TONC market price
TONC Market Sentiment Indicator
2026-02-02 Fear and Greed Index: 14 (Extreme Fear)
Click to view the current Fear & Greed Index
The cryptocurrency market is currently experiencing extreme fear, with the Fear and Greed Index at 14, indicating significant market pessimism and risk aversion among investors. This exceptionally low reading suggests heightened market anxiety and potential panic selling. When the index reaches extreme fear levels, it often presents contrarian trading opportunities for experienced investors who believe the market has overshot downside. However, caution is warranted as further volatility may persist before sentiment stabilizes.
TONC Holdings Distribution
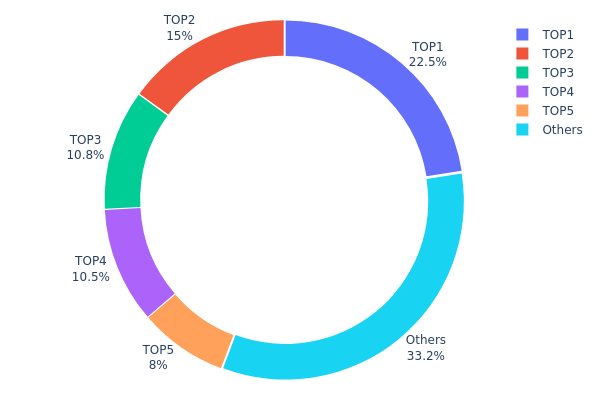
The holdings distribution chart illustrates the concentration of token supply across different wallet addresses, serving as a critical indicator of decentralization and market structure stability. For TONC, the on-chain data reveals a relatively concentrated distribution pattern that warrants careful examination.
Currently, the top 5 addresses collectively hold approximately 266,187.55K TONC tokens, representing 66.77% of the total circulating supply. The largest holder controls 89,999.60K tokens (22.49%), followed by the second-largest with 60,000.00K tokens (15.00%), and the third through fifth addresses holding 10.82%, 10.46%, and 8.00% respectively. This concentration structure indicates that over two-thirds of the token supply remains in the hands of a limited number of major stakeholders, while the remaining 33.23% is distributed among other market participants.
Such a concentration level presents both structural advantages and potential risks. On one hand, major holders may include project treasury, strategic partners, or long-term institutional investors, which can provide price stability during market turbulence. On the other hand, this distribution pattern significantly increases the market's vulnerability to large-scale sell pressure. Should any of the top holders decide to liquidate their positions, the resulting supply shock could trigger substantial price volatility, particularly given that the top two addresses alone control 37.49% of the circulating supply. This concentration also raises concerns about potential market manipulation and poses challenges to achieving genuine decentralization, as decision-making power and market influence remain consolidated within a relatively small group of participants.
Click to view current TONC Holdings Distribution
| Top |
Address |
Holding Qty |
Holding (%) |
| 1 |
0x9eee...89d51c |
89999.60K |
22.49% |
| 2 |
0xc4a8...e62008 |
60000.00K |
15.00% |
| 3 |
0x42b3...b12a52 |
43308.91K |
10.82% |
| 4 |
0x45fc...47faba |
41879.04K |
10.46% |
| 5 |
0x88bd...4e1c2c |
32000.00K |
8.00% |
| - |
Others |
132812.45K |
33.23% |
II. Core Factors Influencing TONC's Future Price
Market Sentiment
Market sentiment plays a crucial role in driving TONC price movements. Investor psychology and overall market conditions directly influence price volatility. Positive or negative news can significantly sway TONC's trajectory, creating momentum shifts that impact short-term and medium-term price action.
Network Utility and Ecosystem Development
Toncoin's utility within the TON ecosystem represents a fundamental price driver. As the ecosystem expands and more applications integrate TONC, demand for the token increases organically. The network's ability to provide value through decentralized applications and services directly correlates with price appreciation potential.
Market Risks and Competitive Landscape
TONC faces several market risks that warrant consideration:
- High Volatility: TONC exhibits significant price fluctuations characteristic of emerging blockchain assets
- Competitive Pressure: Other blockchain platforms may capture market share and attention from investors and developers
- Liquidity Risks: Trading volume constraints can affect price stability and execution quality
Supply Dynamics
The circulating supply remains considerably lower than maximum supply, creating potential inflation and dilution risks. Continued token releases may limit upward price movement, making supply monitoring essential for investment decisions. The release schedule and vesting periods of locked tokens represent important factors in medium-term price forecasting.
Both favorable and adverse news events can substantially influence TONC market behavior. Developments related to partnerships, technical upgrades, regulatory clarity, or ecosystem expansion typically generate positive price responses, while security concerns or competitive setbacks may trigger negative reactions.
Technical Analysis Considerations
Technical factors including support and resistance levels, trading volume patterns, and momentum indicators provide additional insight into potential price movements. Market participants often rely on chart patterns and technical signals to inform entry and exit decisions, creating self-reinforcing price trends during periods of strong directional movement.
III. 2026-2031 TONC Price Prediction
2026 Outlook
- Conservative Prediction: $0.00452 - $0.00526
- Neutral Prediction: Around $0.00526
- Optimistic Prediction: Up to $0.0061 (requires sustained market momentum and positive ecosystem developments)
2027-2029 Outlook
- Market Stage Expectation: Gradual recovery and consolidation phase with moderate growth potential
- Price Range Predictions:
- 2027: $0.00295 - $0.00602, with an estimated 8% increase from 2026 baseline
- 2028: $0.00345 - $0.00825, showing an 11% growth trajectory
- 2029: $0.00648 - $0.00916, representing a potential 34% appreciation
- Key Catalysts: Ecosystem expansion, increased adoption within TON network, strategic partnerships, and broader market recovery
2030-2031 Long-term Outlook
- Baseline Scenario: $0.00494 - $0.00948 (assuming steady ecosystem growth and stable market conditions)
- Optimistic Scenario: $0.00853 - $0.00959 (requires strong network adoption, successful protocol upgrades, and favorable regulatory environment)
- Transformative Scenario: Potential to reach upper bounds of $0.00959 by 2031 (contingent on breakthrough adoption, major institutional integration, and sustained bull market conditions)
- 2026-02-02: TONC trading within initial consolidation range as market participants assess long-term value proposition
| Year |
Predicted High Price |
Predicted Average Price |
Predicted Low Price |
Price Change |
| 2026 |
0.0061 |
0.00526 |
0.00452 |
0 |
| 2027 |
0.00602 |
0.00568 |
0.00295 |
8 |
| 2028 |
0.00825 |
0.00585 |
0.00345 |
11 |
| 2029 |
0.00916 |
0.00705 |
0.00648 |
34 |
| 2030 |
0.00948 |
0.00811 |
0.00494 |
54 |
| 2031 |
0.00959 |
0.00879 |
0.00853 |
67 |
IV. TONC Professional Investment Strategy and Risk Management
TONC Investment Methodology
(I) Long-term Holding Strategy
- Target Investors: Blockchain technology believers and investors optimistic about the FreeTON ecosystem's long-term development
- Operational Recommendations:
- Establish positions in batches during market corrections to reduce average cost
- Set clear investment horizons (12-24 months) and periodically review portfolio performance
- Utilize Gate Web3 Wallet for secure storage, implementing multi-signature security measures
(II) Active Trading Strategy
- Technical Analysis Tools:
- Moving Averages: Monitor the 7-day and 30-day moving averages to identify trend reversals; current data shows TONC declining 20.26% over 7 days and 25.86% over 30 days, suggesting a downward trend
- Volume Analysis: Observe the correlation between 24-hour trading volume ($12,465.38) and price movements to validate breakout authenticity
- Swing Trading Key Points:
- Entry consideration near the 24-hour low ($0.005), with stop-loss set below recent support levels
- Take profit in stages near the 24-hour high ($0.005648), avoiding excessive greed
TONC Risk Management Framework
(I) Asset Allocation Principles
- Conservative Investors: 1-3% of total crypto portfolio
- Aggressive Investors: 5-10% of total crypto portfolio
- Professional Investors: 10-15% of total crypto portfolio, with dynamic adjustment based on market conditions
(II) Risk Hedging Solutions
- Diversified Portfolio: Combine TONC with stablecoins and mainstream crypto assets to reduce single-asset risk
- Position Management: Establish tiered position exit mechanisms, progressively reducing holdings when prices decline 15%, 25%, and 35%
(III) Secure Storage Solutions
- Hot Wallet Recommendation: Gate Web3 Wallet, supporting ETH chain assets with convenient trading functionality
- Cold Storage Solution: For large holdings, consider hardware wallets with offline private key storage
- Security Precautions: Regularly backup wallet mnemonics, avoid connecting to unknown websites, and enable two-factor authentication
V. TONC Potential Risks and Challenges
TONC Market Risks
- High Volatility: TONC experienced a 59.68% decline over the past year, demonstrating significant price fluctuations that may result in substantial short-term losses
- Low Liquidity: With 24-hour trading volume of only $12,465.38 and market cap dominance of 0.000077%, low liquidity may lead to increased slippage during large transactions
- Distance from Historical High: Current price ($0.005258) is 94.99% below the all-time high ($0.104949 on September 3, 2020), indicating prolonged bearish sentiment
TONC Regulatory Risks
- Uncertainty in Crypto Regulations: Global regulatory policies for crypto assets remain unclear, with potential negative impacts from policy tightening
- Compliance Pressure: FreeTON network projects may face compliance review requirements in different jurisdictions, potentially affecting token circulation
- Exchange Delisting Risk: Currently listed on only 1 exchange, with potential liquidity crisis if delisting occurs
TONC Technical Risks
- Smart Contract Vulnerabilities: The ETH chain contract address (0x6a6c2ada3ce053561c2fbc3ee211f23d9b8c520a) may contain undiscovered security vulnerabilities
- Network Upgrade Risks: Blockchain network upgrades may cause temporary service interruptions or compatibility issues
- Circulating Supply Uncertainty: With circulating supply at only 5.31% of maximum supply (268.12M/5.05B), future large-scale token releases could create selling pressure
VI. Conclusion and Action Recommendations
TONC Investment Value Assessment
TONC, as the native token of the FreeTON decentralized blockchain network, possesses certain ecosystem value. However, the current market performance shows challenges: the token has declined nearly 60% year-over-year with low trading volume, low market cap ranking (2286), and extremely low circulating supply ratio (5.31%). While long-term potential depends on FreeTON ecosystem development, short-term risks include high volatility, low liquidity, and unclear token release schedules. Investors should carefully assess risk tolerance and avoid heavy concentration.
TONC Investment Recommendations
✅ Beginners: Not recommended for initial crypto investment; suggest gaining experience with mainstream assets before considering micro-cap tokens
✅ Experienced Investors: May allocate 1-3% of portfolio for speculative positions, implementing strict stop-losses (15-20% below purchase price)
✅ Institutional Investors: Conduct thorough due diligence on FreeTON ecosystem fundamentals and technical architecture; consider entry only with professional risk management systems
TONC Trading Participation Methods
- Spot Trading: Purchase TONC through Gate.com spot market, suitable for medium to long-term holding strategies
- Grid Trading: Utilize Gate.com's automated trading tools to establish grid strategies within volatility ranges, capturing swing profits
- Portfolio Allocation: Combine TONC with other blockchain ecosystem tokens to build diversified portfolios and reduce individual project risks
Cryptocurrency investment carries extremely high risks, and this article does not constitute investment advice. Investors should make cautious decisions based on their own risk tolerance and are advised to consult professional financial advisors. Never invest more than you can afford to lose.
FAQ
What is TON coin? What are its main uses and characteristics?
TON coin is the native token of the TON blockchain developed by Telegram. It serves as a utility token for transaction fees, network operations, and smart contract execution. Key features include high-speed transaction processing, low fees, and seamless integration with Telegram's ecosystem for payments and decentralized applications.
What is the TON coin price prediction for 2024-2025? What factors will influence the price?
TON price predicted between 6.58-10.90 USD by end of 2025. Key factors include market demand, blockchain technology development, regulatory environment, and ecosystem adoption growth.
What are the risks of investing in TON coins? How should I evaluate investment risks?
TON investment carries market volatility and regulatory risks. Evaluate by analyzing market trends, trading volume data, and monitoring regulatory changes. Diversify your portfolio and only invest what you can afford to lose.
What are the advantages and disadvantages of TON coin compared to mainstream cryptocurrencies such as Bitcoin and Ethereum?
TON offers lower transaction fees and faster processing than Bitcoin and Ethereum, making it ideal for micropayments. However, it has lower market maturity and higher regulatory risks compared to established cryptocurrencies.
From a technical perspective, what stage is TON coin currently in? Where are the support and resistance levels?
TON is forming a descending wedge pattern, indicating potential trend reversal. The support level is positioned below the current price, while the resistance level stands at $3.5. A breakout above this resistance could trigger significant upside momentum.
What are TON's circulation supply, total supply, and market cap ranking?
TON's market cap is $22.28 billion, ranking 9th. Circulating supply is 3,474,564,734 TON, with total supply of 5,106,856,086 TON. Fully diluted market cap is approximately $32.7 billion.
* The information is not intended to be and does not constitute financial advice or any other recommendation of any sort offered or endorsed by Gate.