This article provides professional analysis of VMT (Vemate) token pricing and market dynamics through 2031. VMT, a specialized utility token for VEVE collectibles data analysis, is currently trading at $0.001957 with a market cap of $293,550 and faces extreme fear sentiment. The analysis examines VMT's historical performance, covering its peak at $0.069133 in October 2022 and current market position across 1,593 token holders. Price predictions indicate conservative range of $0.0016-$0.0025 for 2026, with potential growth to $0.0031-$0.0045 by 2031 under favorable conditions. Key factors influencing VMT pricing include supply mechanisms, institutional adoption, macroeconomic conditions, and technology advancement. The article offers comprehensive investment strategies for different investor profiles on Gate, detailing dollar-cost averaging approaches, risk management frameworks including asset allocation principles, and secure storage solutions. Critical risks encompassing liquidity constraints, regulatory un
Introduction: VMT's Market Position and Investment Value
Vemate (VMT), positioned as a specialized data collection and analysis platform for VEVE collectibles, has been serving the digital collectibles market since its inception. As of 2026, VMT maintains a market capitalization of approximately $293,550, with a circulating supply of 150 million tokens and a current price hovering around $0.001957. This asset, recognized as a utility token within the VEVE ecosystem, continues to play a role in providing market data, price alerts, and analytical tools for collectors and traders.
This article will comprehensively analyze VMT's price trends from 2026 to 2031, combining historical patterns, market supply-demand dynamics, ecosystem developments, and macroeconomic conditions to provide investors with professional price forecasts and practical investment strategies.
I. VMT Price History Review and Market Status
VMT Historical Price Evolution
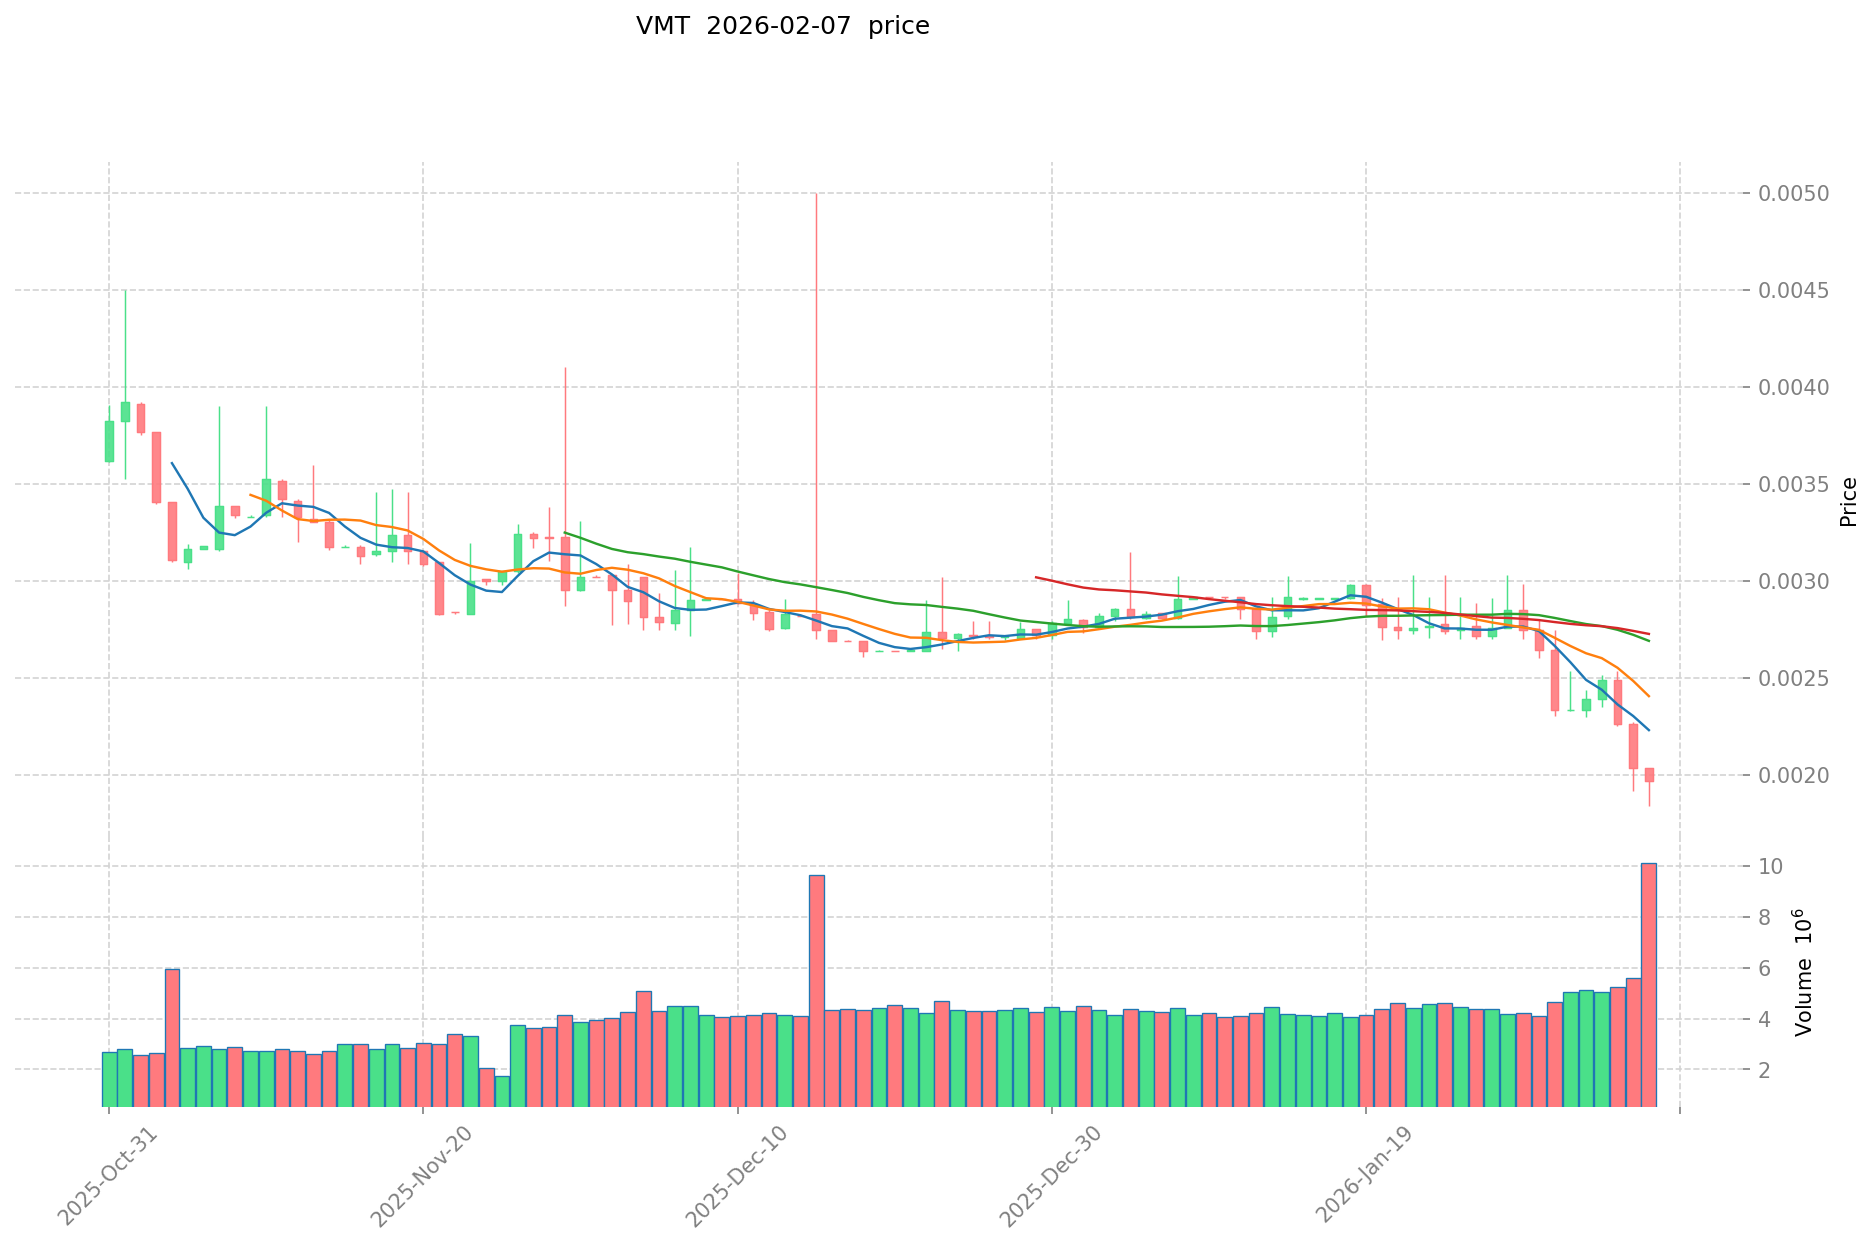
Vemate (VMT) has experienced notable price movements since its inception. The token reached its peak valuation on October 25, 2022, recording a price of 0.069133 USD. Following this milestone, the token entered a prolonged correction phase. On February 6, 2026, VMT marked its lowest recorded price at 0.00183459 USD, representing a decline from its historical peak.
VMT Current Market Landscape
As of February 7, 2026, VMT is trading at 0.001957 USD. The token demonstrates mixed short-term performance, with a 24-hour gain of 3.92 percent and an hourly decrease of 0.059 percent. Over extended timeframes, the asset reflects broader market pressures, showing a 7-day decline of 25.94 percent, a 30-day decrease of 32.54 percent, and a year-over-year reduction of 36.059 percent.
The 24-hour trading range spans from 0.001887 USD to 0.002071 USD, with total trading volume reaching 21,600.50 USD. VMT maintains a market capitalization of 293,550 USD with a circulating supply of 150,000,000 tokens, representing 100 percent of its maximum supply. The token's market share stands at 0.000012 percent, and its fully diluted market cap equals its current market capitalization at 293,550 USD. The token holder base comprises 1,593 addresses.
Click to view the current VMT market price
VMT Market Sentiment Index
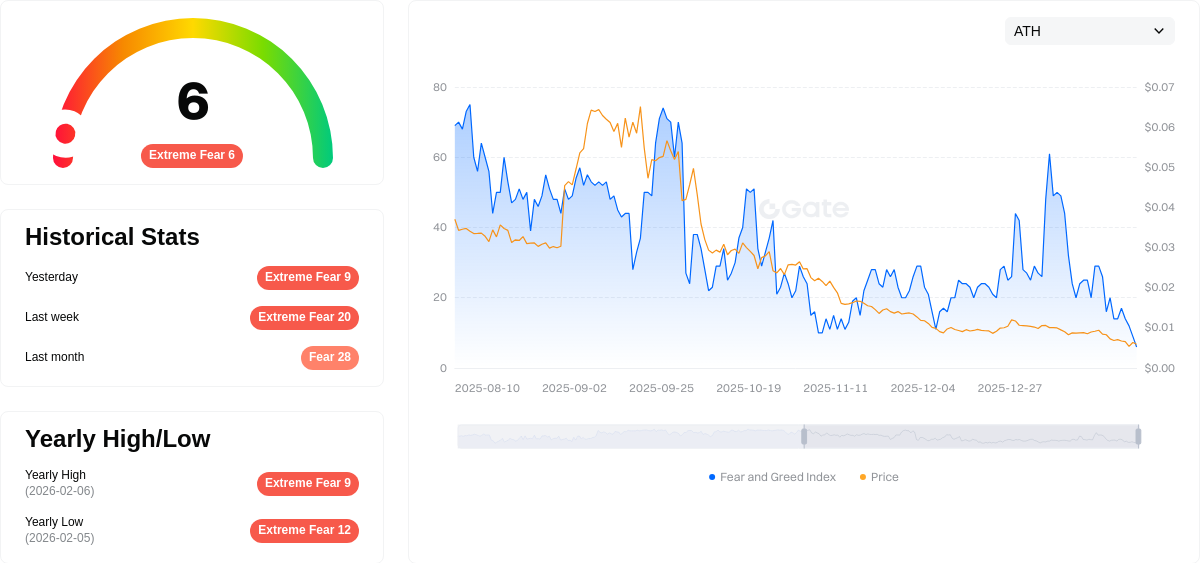
2026-02-07 Fear and Greed Index: 6 (Extreme Fear)
Click to view the current Fear & Greed Index
The crypto market is experiencing extreme fear with an index reading of just 6. This historically low level suggests maximum market pessimism, where investors are deeply risk-averse and bearish sentiment dominates. During such periods, panic selling often accelerates as traders rush to exit positions. However, extreme fear can paradoxically create contrarian opportunities for long-term investors, as prices may be severely depressed. Market volatility tends to spike dramatically under these conditions, making it crucial to exercise caution and avoid emotional decision-making while monitoring support levels closely.
VMT Holding Distribution
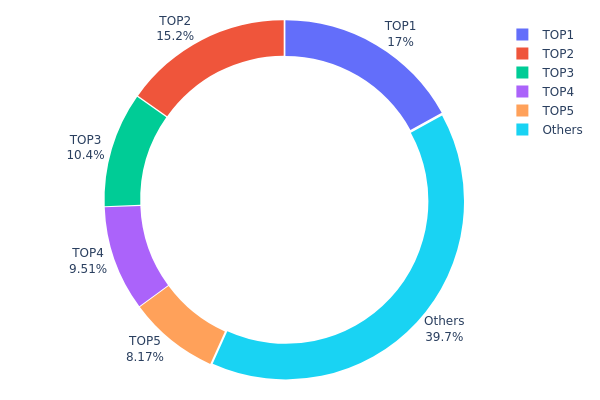
The holding distribution chart illustrates the allocation of VMT tokens across different wallet addresses, providing insights into the concentration of token ownership within the ecosystem. This metric is crucial for assessing the degree of decentralization and potential market manipulation risks associated with the asset.
Based on the current data, VMT exhibits a moderately high concentration pattern. The top five addresses collectively hold approximately 60.27% of the total token supply, with the largest holder controlling 17.02% (25,532.86K VMT), followed by the second-largest at 15.22% (22,833.69K VMT), and the third at 10.37% (15,559.85K VMT). Notably, the dead address (0x0000...00dead) ranks fourth with 9.50% (14,263.03K VMT), representing tokens that have been permanently removed from circulation through burning mechanisms. The remaining 39.73% is distributed among other addresses, indicating some level of broader participation.
This concentration level presents a dual-edged scenario for market dynamics. On one hand, the significant holdings by top addresses could introduce heightened volatility risks, as large-scale sell-offs by major holders may trigger substantial price fluctuations. The combined influence of the top three active addresses (excluding the burn address) controlling approximately 42.61% of circulating supply suggests these entities possess considerable market power. On the other hand, the presence of a substantial burn address and the nearly 40% distribution among other holders demonstrates some commitment to token economics management and community engagement, which partially mitigates centralization concerns.
Click to view current VMT Holding Distribution
| Top |
Address |
Holding Qty |
Holding (%) |
| 1 |
0x6593...841b0d |
25532.86K |
17.02% |
| 2 |
0x1537...96447a |
22833.69K |
15.22% |
| 3 |
0x7420...b518dd |
15559.85K |
10.37% |
| 4 |
0x0000...00dead |
14263.03K |
9.50% |
| 5 |
0xab16...92f37e |
12250.00K |
8.16% |
| - |
Others |
59560.56K |
39.73% |
II. Core Factors Influencing VMT's Future Price
Supply Mechanisms
- Market Demand Dynamics: VMT's future pricing is closely tied to evolving transportation patterns and urban mobility requirements. Changes in vehicle miles traveled reflect broader shifts in commuting behaviors, remote work adoption, and urban planning initiatives.
- Historical Patterns: Historical data shows VMT levels correlate with fuel consumption patterns and transportation infrastructure development. Past fluctuations in energy costs and transportation policies have demonstrated measurable impacts on overall market dynamics.
- Current Influences: Population growth and changing transportation needs are expected to shape future demand patterns. Urbanization trends and demographic shifts continue to influence mobility requirements across different regions.
Institutional and Market Participant Dynamics
- Industry Adoption: Transportation sector stakeholders, including logistics companies and urban planning authorities, increasingly factor VMT metrics into operational strategies and infrastructure investment decisions.
- Policy Framework: Government initiatives related to sustainable transportation, carbon reduction targets, and smart city development programs influence market expectations and long-term valuation perspectives.
- Private Sector Engagement: Fleet management companies and mobility service providers integrate VMT considerations into their operational planning and service optimization strategies.
Macroeconomic Environment
- Fuel Price Volatility: Energy cost fluctuations directly affect transportation economics and VMT-related market dynamics. Historical correlations between fuel pricing and travel patterns suggest continued sensitivity to energy market conditions.
- Economic Growth Patterns: Regional economic development, employment trends, and consumer spending power influence transportation demand and associated metrics.
- Infrastructure Investment: Public and private sector commitments to transportation infrastructure modernization affect long-term market fundamentals and adoption trajectories.
Technology Development and Ecosystem Building
- Autonomous Driving Technology: Advances in self-driving vehicle systems may reshape transportation cost structures and usage patterns. Industry forecasts suggest potential reductions in operational expenses as automation technology matures.
- Urban Planning Integration: Smart city initiatives incorporating real-time traffic management, route optimization, and integrated mobility platforms influence how VMT metrics are utilized and valued.
- Mobility Innovation: Emerging transportation models, including shared mobility services and electric vehicle adoption, contribute to evolving market dynamics and metric relevance in contemporary urban environments.
III. 2026-2031 VMT Price Prediction
2026 Outlook
- Conservative prediction: $0.0016 - $0.0020
- Neutral prediction: $0.0019 - $0.0021
- Optimistic prediction: $0.0023 - $0.0025 (contingent on favorable market conditions and increased adoption)
2027-2029 Outlook
- Market stage expectation: The token is anticipated to enter a gradual growth phase, with potential expansion driven by ecosystem developments and broader market recovery trends.
- Price range prediction:
- 2027: $0.0017 - $0.0031
- 2028: $0.0019 - $0.0031
- 2029: $0.0026 - $0.0034
- Key catalysts: Enhanced utility integration, potential partnership announcements, and overall improvement in crypto market sentiment could serve as primary drivers for price appreciation.
2030-2031 Long-term Outlook
- Baseline scenario: $0.0024 - $0.0031 (assuming steady ecosystem growth and stable market conditions)
- Optimistic scenario: $0.0031 - $0.0043 (predicated on significant platform expansion and increased user engagement)
- Transformative scenario: $0.0037 - $0.0045 (contingent on breakthrough developments, major exchange listings on platforms like Gate.com, and substantial mainstream adoption)
- February 7, 2026: VMT trading within $0.0016 - $0.0025 range (early-stage price discovery phase)
| Year |
Predicted High Price |
Predicted Average Price |
Predicted Low Price |
Price Change |
| 2026 |
0.00252 |
0.00196 |
0.0016 |
0 |
| 2027 |
0.00305 |
0.00224 |
0.00173 |
14 |
| 2028 |
0.00309 |
0.00264 |
0.00193 |
35 |
| 2029 |
0.00336 |
0.00287 |
0.00264 |
46 |
| 2030 |
0.00433 |
0.00311 |
0.00243 |
59 |
| 2031 |
0.0045 |
0.00372 |
0.00305 |
90 |
IV. VMT Professional Investment Strategies and Risk Management
VMT Investment Methodology
(1) Long-term Holding Strategy
- Suitable for: Investors who believe in the long-term value of NFT collectibles data analytics and are comfortable with market volatility
- Operational Recommendations:
- Consider dollar-cost averaging to build positions gradually, which may help reduce the impact of short-term price fluctuations
- Monitor Vemate's user growth and product development progress as indicators of potential long-term value
- Storage Solution: Consider using Gate Web3 Wallet for secure token storage with built-in security features
(2) Active Trading Strategy
- Technical Analysis Tools:
- Volume Analysis: Monitor the relatively low 24-hour trading volume ($21,600) which may indicate liquidity constraints during position exits
- Price Range Monitoring: Track the 24-hour range ($0.001887 - $0.002071) to identify potential entry and exit points
- Band Trading Considerations:
- The token has shown notable volatility with a 7-day decline of 25.94%, suggesting potential opportunities for short-term traders
- Be mindful that VMT is listed on only one exchange, which may limit trading flexibility
VMT Risk Management Framework
(1) Asset Allocation Principles
- Conservative Investors: Consider allocating no more than 1-2% of crypto portfolio
- Aggressive Investors: May consider 3-5% allocation while maintaining diversification
- Professional Investors: Could allocate 5-8% with appropriate hedging strategies
(2) Risk Hedging Approaches
- Portfolio Diversification: Balance VMT holdings with more established cryptocurrencies to mitigate project-specific risks
- Position Sizing: Implement strict position limits given the token's lower liquidity and single exchange listing
(3) Secure Storage Solutions
- Digital Wallet Recommendation: Gate Web3 Wallet offers convenient access and security features for BSC-based tokens
- Multi-signature Solution: For larger holdings, consider implementing multi-signature wallet solutions
- Security Precautions: Always verify contract address (0xE615C5e7219f9801C3b75bc76E45a4dab3c38e51 on BSC), enable two-factor authentication, and never share private keys
V. VMT Potential Risks and Challenges
VMT Market Risks
- Liquidity Constraints: With a market cap of $293,550 and trading on only one exchange, VMT faces significant liquidity limitations that may impact price stability
- Price Volatility: The token has experienced substantial declines across multiple timeframes (7D: -25.94%, 30D: -32.54%, 1Y: -36.06%), indicating considerable market volatility
- Market Cap Concerns: The relatively small market capitalization places VMT in the higher-risk category among crypto assets
VMT Regulatory Risks
- NFT Market Regulation: As Vemate serves the NFT collectibles market, potential regulatory changes affecting NFT platforms could impact token utility
- Cross-border Compliance: Data collection and analytics services may face varying regulatory requirements across different jurisdictions
- Token Classification Uncertainty: Evolving regulatory frameworks may affect how VMT tokens are classified and their permissible use cases
VMT Technical Risks
- Smart Contract Vulnerabilities: As a BSC-based token, VMT relies on smart contract security; any vulnerabilities could pose risks to token holders
- Platform Dependency: Vemate's value is closely tied to the VEVE collectibles ecosystem, creating concentration risk
- Limited Exchange Support: Being listed on only one exchange creates operational risk and may limit token accessibility for some investors
VI. Conclusion and Action Recommendations
VMT Investment Value Assessment
Vemate (VMT) presents a specialized investment opportunity in the NFT data analytics niche, offering utility through premium features for VEVE collectibles tracking. However, the token faces significant challenges including limited liquidity, substantial recent price declines, and concentration risk from its single exchange listing and dependency on the VEVE ecosystem. While the 1,593 token holders indicate some community interest, the current market conditions suggest a higher-risk profile suitable primarily for investors with specific interest in NFT analytics tools and high risk tolerance.
VMT Investment Recommendations
✅ Beginners: Exercise extreme caution; if considering investment, limit exposure to a minimal portion of portfolio (under 1%) and thoroughly research the VEVE ecosystem and Vemate's utility before investing
✅ Experienced Investors: May consider small strategic positions (1-3% of crypto portfolio) with clear risk management protocols and stop-loss strategies, while monitoring platform development and user adoption metrics
✅ Institutional Investors: Conduct comprehensive due diligence on Vemate's business model, technical infrastructure, and competitive positioning within the NFT analytics space before considering any allocation
VMT Trading Participation Methods
- Spot Trading: Purchase VMT tokens through supported exchange platforms, ensuring verification of the official BSC contract address
- Gradual Accumulation: Consider implementing a dollar-cost averaging strategy to mitigate timing risk given the token's volatility
- Risk-Proportionate Approach: Begin with smaller positions to assess platform utility and market dynamics before considering larger allocations
Cryptocurrency investment carries extremely high risks, and this article does not constitute investment advice. Investors should make prudent decisions based on their own risk tolerance and are advised to consult professional financial advisors. Never invest more than you can afford to lose.
FAQ
VMT tokens have experienced significant price volatility since launch, with early supporters facing substantial losses. Overall, the token's performance has been weak, with most tokens showing poor results following their initial listing.
What factors affect VMT price movements?
VMT price is influenced by market demand, trading volume, project developments, community sentiment, macroeconomic trends, and cryptocurrency market cycles. These factors collectively drive price fluctuations.
How to conduct VMT price prediction? What are the analysis methods?
VMT price prediction uses technical analysis of historical price movements and trading volume trends. Key methods include support/resistance levels, moving averages, and momentum indicators. Fundamental analysis of project developments and market sentiment also influences price forecasting.
What are the risks and limitations of VMT price prediction?
VMT price prediction faces market competition and technological change risks. Predictions rely on complex market analysis and may be inaccurate. Policy changes and market volatility also impact prediction reliability and outcomes.
How does VMT's price volatility compare to other mainstream cryptocurrencies?
VMT exhibits moderate volatility, generally lower than Bitcoin and Ethereum but higher than stablecoins. Its price fluctuations are primarily driven by market demand and technological developments.
Where can I check the real-time price of VMT?
You can check VMT's real-time price on major cryptocurrency exchanges including Kraken, Binance, and OKX. These platforms provide live price updates and trading volume data for VMT tokens.
* The information is not intended to be and does not constitute financial advice or any other recommendation of any sort offered or endorsed by Gate.