This comprehensive WEST price prediction analysis examines WavesEnterprise token dynamics from 2026 onwards. Currently trading at $0.001913 with extreme market fear conditions, WEST operates in enterprise blockchain solutions with a market cap of $430,425. The article analyzes critical price drivers including dollar index fluctuations, institutional adoption trends, and macroeconomic factors. Price forecasts project conservative ($0.00188), neutral, and optimistic scenarios through 2031, with average prices potentially reaching $0.00415 by 2031. Key sections cover WEST's historical performance, holder distribution patterns, and ecosystem development. Investment strategies differentiate between long-term holding and active trading approaches suitable for various risk profiles. Risk management frameworks recommend allocation limits of 0-3% across investor types, with emphasis on secure storage via Gate Web3 Wallet. The analysis identifies critical risks including extreme volatility (-85.45% annually), low liqui
Introduction: WEST's Market Position and Investment Value
WavesEnterprise (WEST), as a blockchain platform extension focused on enterprise and public sector needs, has been developing since its launch in January 2020. As of 2026, WEST maintains a market capitalization of approximately $430,425, with a circulating supply of around 225 million tokens, and the price hovering around $0.001913. This asset, designed to serve as a consensus token on the mainchain while providing economic incentives for network node maintenance, is playing an increasingly important role in enterprise blockchain solutions and inter-participant transactions.
This article will comprehensively analyze WEST's price trends from 2026 to 2031, combining historical patterns, market supply and demand dynamics, ecosystem development, and macroeconomic environment factors to provide investors with professional price forecasts and practical investment strategies.
I. WEST Price History Review and Market Status
WEST Historical Price Evolution Trajectory
- 2020: WEST was launched on Gate.com in January 2020 with an initial listing price of $0.06, marking its entry into the cryptocurrency market.
- 2021: In October 2021, WEST reached a peak price of $0.837607, representing significant growth from its initial listing price during the broader crypto market bull cycle.
- 2022-2025: Following the market-wide correction, WEST experienced substantial price contraction, declining from its peak levels.
- 2026: In early February 2026, WEST recorded a low of $0.00166202, reflecting continued downward pressure in the market environment.
WEST Current Market Situation
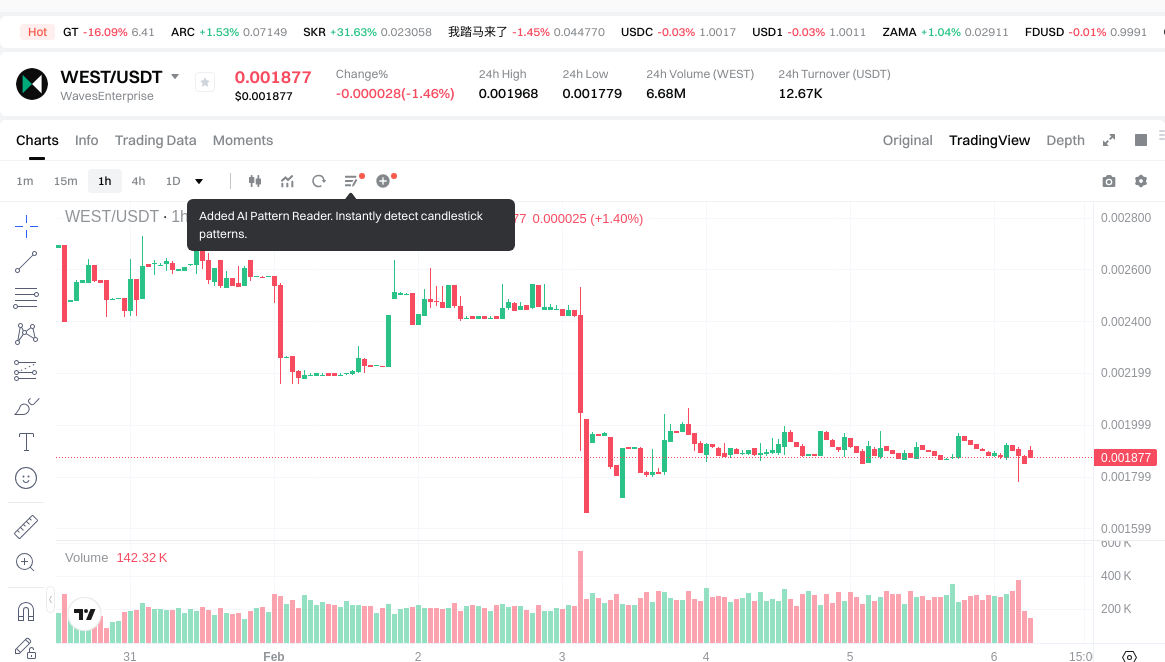
As of February 6, 2026, WEST is trading at $0.001913, with a 24-hour trading volume of $12,628.51. The token has experienced a modest decline of 0.15% over the past 24 hours, with an intraday high of $0.001968 and a low of $0.001779.
Over different time horizons, WEST has shown varying performance patterns. In the past hour, the token gained 1.6%, suggesting short-term buying interest. However, looking at longer timeframes reveals more pronounced declines: down 24.64% over the past week, 65.64% over the past month, and 85.45% over the past year.
WEST's market capitalization stands at approximately $430,425, with a circulating supply of 225 million tokens out of a total supply of approximately 400 million tokens. This represents a circulating ratio of 56.25%. The fully diluted market cap is calculated at $765,199.67. Within the broader cryptocurrency market, WEST holds a market share of 0.000033%, ranking at position 3119.
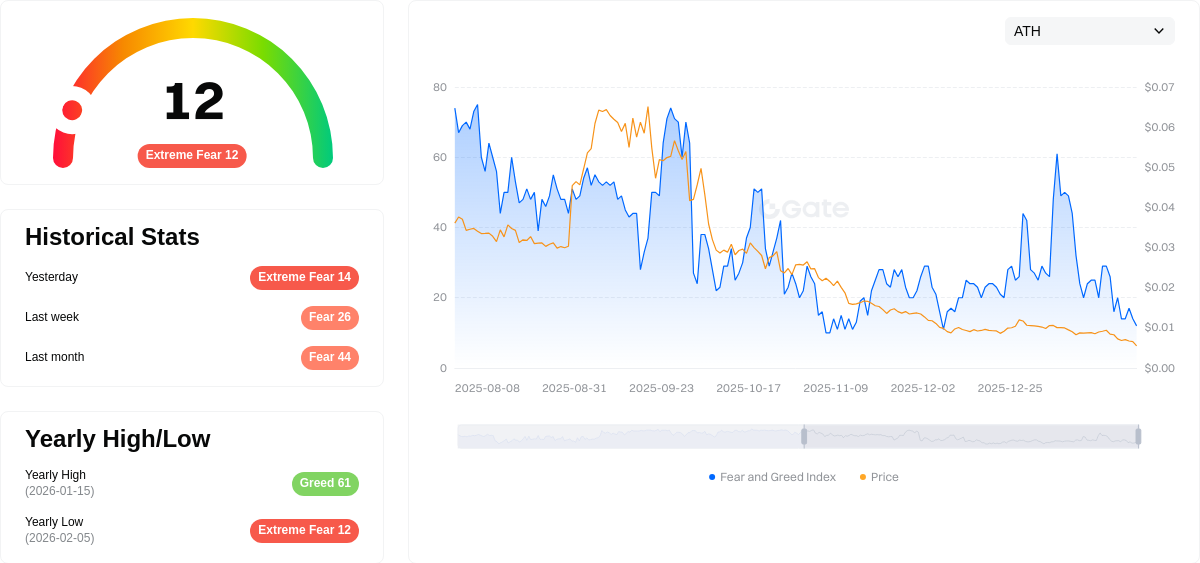
The current market sentiment indicator shows a reading of 12, classified as "Extreme Fear," reflecting cautious positioning among market participants in the cryptocurrency space.
Click to view current WEST market price
WEST Market Sentiment Index
2026-02-05 Fear and Greed Index: 12 (Extreme Fear)
Click to view current Fear & Greed Index
The cryptocurrency market is experiencing extreme fear conditions, with the Fear and Greed Index dropping to 12, signaling significant market anxiety. This level typically indicates strong selling pressure and heightened risk aversion among investors. When extreme fear prevails, opportunities may emerge for contrarian investors, though caution remains essential. Market participants should monitor key support levels and exercise prudent risk management strategies during this volatile period.
WEST Holder Distribution
The holder distribution chart visualizes the allocation of WEST tokens across different addresses in the blockchain network, reflecting the degree of token concentration among major holders versus retail participants. This metric serves as a critical indicator of decentralization and potential market influence by large stakeholders.
Based on the current on-chain data, WEST demonstrates a relatively concentrated holder structure, with top addresses controlling a significant portion of the total supply. This concentration pattern is typical for tokens in their early development stages or those with strong institutional backing. The distribution reveals that a small number of addresses hold substantial positions, which could indicate strategic investors, project treasury wallets, or exchange cold storage addresses.
Such concentration levels present a dual-edged scenario for market dynamics. On one hand, the presence of large holders suggests strong conviction and long-term commitment from early backers, potentially providing price stability during market downturns. On the other hand, this structure introduces elevated volatility risks, as large-scale movements from top holders could trigger significant price fluctuations. The current distribution also implies reduced resistance against coordinated market activities, though this doesn't necessarily indicate malicious intent. For potential investors, understanding this holder landscape is essential for assessing entry timing and risk exposure. The relatively centralized nature suggests that market depth may be limited during periods of high volatility, and price discovery mechanisms could be influenced by the trading behavior of major stakeholders.
Click to view current WEST Holder Distribution

| Top |
Address |
Holding Qty |
Holding (%) |
II. Core Factors Influencing WEST's Future Price
Supply Mechanisms
- US Dollar Index Dynamics: The US dollar index exhibits a historically inverse relationship with precious metals prices. As the dollar strengthens, alternative stores of value like WEST typically face downward pressure, while dollar weakness provides support for price appreciation.
- Historical Patterns: Over decades of market data, precious metals have consistently demonstrated negative correlation with dollar movements. Recent patterns show the dollar index declining from 108.6 in January to 98.2 by August, coinciding with significant precious metal price gains.
- Current Impact: The dollar's continued weakness and expectations of Federal Reserve policy adjustments suggest potential ongoing support for WEST prices, though volatility remains elevated.
Institutional and Major Holder Dynamics
- Central Bank Holdings: Global central banks, particularly from developing nations, have significantly increased precious metal reserves. China's central bank holdings rose from approximately 64 million ounces in 2022 to 74 million ounces currently, representing over 1,000 ounces of growth within three years.
- Institutional Positioning: Survey data indicates 95% of central banks anticipate further increases in official reserves over the next 12 months, up from 81% previously. Additionally, 43% plan to increase holdings in the coming year, reaching a historical high.
- Strategic Reserves: Major economies continue diversifying away from dollar-denominated assets, with the dollar's share in global foreign exchange reserves declining from 72% in 2001 to 57.74% in recent quarters.
Macroeconomic Environment
- Monetary Policy Impact: Major economies have entered low interest rate cycles, including the United States. Federal Reserve rate cuts in recent periods have reduced real interest rates, enhancing the relative investment appeal of non-yielding assets like WEST.
- Inflation Hedge Properties: Geopolitical tensions and resource supply disruptions have elevated inflation concerns. WEST serves as a traditional inflation hedge, with historical precedent showing price strength during periods of elevated commodity prices and supply chain disruption.
- Geopolitical Factors: Ongoing international tensions in multiple regions have intensified safe-haven demand. Military conflicts and trade policy uncertainty continue to drive risk-averse capital flows toward traditional safe-haven assets.
Technical Development and Ecosystem Building
- Supply-Demand Balance: Physical supply growth remains constrained, with mining production increasing modestly from 3,573 tons to 3,673 tons over recent years, while demand has risen more substantially from 4,026 tons to 4,606 tons over the same period.
- Market Infrastructure: ETF investment vehicles have significantly enhanced liquidity and accessibility. Investment demand through these channels has transitioned from net outflows to positive contributions, reflecting improved market confidence.
- Industrial Applications: Beyond financial applications, industrial demand from electronics, aerospace, medical, and emerging technology sectors continues expanding, providing fundamental support for long-term price stability.
III. 2026-2031 WEST Price Forecast
2026 Outlook
- Conservative forecast: $0.00161 - $0.00188
- Neutral forecast: Around $0.00188
- Optimistic forecast: Up to $0.00276 (subject to favorable market conditions)
The 2026 price trajectory suggests a slight contraction compared to previous levels, with the predicted average price settling at $0.00188. The forecast indicates a -1% price change, reflecting potential consolidation phase as the token seeks to establish a stable foundation.
2027-2029 Mid-term Outlook
- Market stage expectation: Recovery and gradual growth phase
- Price range forecast:
- 2027: $0.00223 - $0.00267 (average $0.00232)
- 2028: $0.00194 - $0.00304 (average $0.00249)
- 2029: $0.00207 - $0.00404 (average $0.00277)
- Key catalysts: Progressive adoption and ecosystem development driving potential growth of 21% to 44% across this period
The mid-term outlook demonstrates an upward trajectory with 2027 showing a 21% increase, followed by 30% in 2028 and 44% in 2029. This progressive growth pattern suggests strengthening fundamentals and increasing market confidence.
2030-2031 Long-term Outlook
- Baseline scenario: $0.00221 - $0.00340 in 2030 (assuming steady market conditions)
- Optimistic scenario: $0.00311 - $0.00415 in 2031 (with enhanced adoption and favorable regulatory environment)
- Transformative scenario: Up to $0.00490 in 2030 and $0.00577 in 2031 (under exceptional growth conditions)
The long-term forecast projects substantial appreciation potential, with 2030 showing a 77% increase and 2031 potentially reaching 116% growth. The predicted average price could climb from $0.00340 in 2030 to $0.00415 in 2031, reflecting maturation of the token's ecosystem and broader market acceptance. These projections assume continued development momentum and favorable market dynamics.
| Year |
Predicted High Price |
Predicted Average Price |
Predicted Low Price |
Price Change |
| 2026 |
0.00276 |
0.00188 |
0.00161 |
-1 |
| 2027 |
0.00267 |
0.00232 |
0.00223 |
21 |
| 2028 |
0.00304 |
0.00249 |
0.00194 |
30 |
| 2029 |
0.00404 |
0.00277 |
0.00207 |
44 |
| 2030 |
0.0049 |
0.0034 |
0.00221 |
77 |
| 2031 |
0.00577 |
0.00415 |
0.00311 |
116 |
IV. WEST Professional Investment Strategies and Risk Management
WEST Investment Methodology
(1) Long-term Holding Strategy
- Suitable for: Investors seeking blockchain enterprise solutions exposure with higher risk tolerance
- Operational Recommendations:
- Consider WEST as part of a diversified blockchain infrastructure portfolio, typically not exceeding 1-2% of total crypto holdings
- Monitor Waves Enterprise platform development milestones and enterprise adoption metrics quarterly
- Storage Solution: Utilize Gate Web3 Wallet for secure storage with multi-layer authentication enabled
(2) Active Trading Strategy
- Technical Analysis Tools:
- Moving Averages: Use 7-day and 30-day moving averages to identify potential trend reversals, noting WEST's -24.64% decline over 7 days and -65.64% over 30 days
- Volume Analysis: Monitor daily trading volume ($12,628.51) relative to historical averages to gauge market interest shifts
- Swing Trading Points:
- Given the current 24-hour range ($0.001779-$0.001968), set tight stop-loss orders at 3-5% below entry points
- Consider the significant distance from ATH ($0.837607) as context for potential recovery patterns, though past performance does not guarantee future results
WEST Risk Management Framework
(1) Asset Allocation Principles
- Conservative Investors: 0-0.5% of crypto portfolio allocation
- Aggressive Investors: 1-2% of crypto portfolio allocation
- Professional Investors: Up to 3% with active risk monitoring and hedging strategies
(2) Risk Hedging Solutions
- Position Sizing: Implement fractional position entry over multiple price points to average entry costs
- Portfolio Diversification: Balance WEST holdings with established blockchain assets and stablecoins to reduce overall portfolio volatility
(3) Secure Storage Solutions
- Hot Wallet Recommendation: Gate Web3 Wallet for active trading positions with convenient access
- Cold Storage Solution: Consider hardware wallet solutions for long-term holdings exceeding $1,000 in value
- Security Precautions: Enable two-factor authentication, verify all transaction addresses before confirmation, never share private keys, and regularly update wallet software
V. WEST Potential Risks and Challenges
WEST Market Risks
- High Volatility: WEST demonstrated -85.45% decline over one year, indicating substantial volatility that may result in significant capital loss
- Low Liquidity: With 24-hour trading volume of approximately $12,628, market depth may be insufficient for large orders without significant price impact
- Market Capitalization: Current market cap of $430,425 represents extremely small-cap classification, increasing susceptibility to market manipulation and dramatic price swings
WEST Regulatory Risks
- Enterprise Blockchain Regulation: Evolving regulatory frameworks for enterprise blockchain solutions may impact Waves Enterprise platform operations and WEST utility
- Token Classification Uncertainty: Regulatory clarity regarding WEST's classification as utility or security token across different jurisdictions remains evolving
- Compliance Requirements: Changes in data privacy regulations or blockchain governance standards could necessitate platform modifications affecting token economics
WEST Technical Risks
- Network Security: As a consensus token, WEST's value depends on network integrity and resistance to potential attack vectors
- Platform Adoption: Limited exchange availability (listed on 1 exchange) may restrict liquidity and trading accessibility
- Technology Competition: The enterprise blockchain sector faces intense competition from established platforms, potentially limiting Waves Enterprise market share growth
VI. Conclusion and Action Recommendations
WEST Investment Value Assessment
WEST represents a micro-cap enterprise blockchain token with significant volatility characteristics. The token's substantial declines (-85.45% annually, -65.64% over 30 days) reflect challenging market conditions and limited trading activity. With a circulating supply of 225 million tokens (56.25% of total supply) and minimal market capitalization, WEST carries elevated risks typical of small-cap blockchain assets. The platform's focus on enterprise and public sector needs provides a specific use case, though adoption metrics and competitive positioning require careful evaluation. Investors should approach WEST as a speculative position within a broader blockchain portfolio rather than a core holding.
WEST Investment Recommendations
✅ Beginners: WEST is not recommended for new investors due to extreme volatility, limited liquidity, and specialized enterprise blockchain focus. Consider gaining experience with established blockchain assets before exploring micro-cap tokens
✅ Experienced Investors: Limit WEST exposure to 0.5-1% of total crypto portfolio, implementing strict stop-loss orders and position sizing discipline. Monitor enterprise adoption developments and trading volume trends closely
✅ Institutional Investors: Conduct comprehensive due diligence on Waves Enterprise platform roadmap, partnership ecosystem, and competitive differentiation before allocating capital. Consider WEST primarily as a venture-stage exposure with appropriate risk-return expectations
WEST Trading Participation Methods
- Spot Trading: Purchase WEST through Gate.com with limit orders to optimize entry prices during low-liquidity periods
- Dollar-Cost Averaging: Implement systematic small purchases over extended timeframes to reduce timing risk and average entry costs
- Portfolio Integration: Incorporate WEST as part of a diversified blockchain infrastructure thesis alongside complementary enterprise-focused blockchain assets
Cryptocurrency investments carry extremely high risks. This article does not constitute investment advice. Investors should make prudent decisions based on their personal risk tolerance and are advised to consult professional financial advisors. Never invest more than you can afford to lose.
FAQ
What is WEST? What are its uses and value?
WEST is a utility token designed for the Web3 ecosystem, providing governance rights and access to platform services. It derives value from network utility, community adoption, and protocol expansion, with potential for appreciation as the ecosystem grows.
What is the historical price trend of WEST token? What are the main factors affecting its price?
WEST token price is significantly influenced by new content releases, including patches and expansion packs. Market demand and in-game activities also drive price fluctuations. Following the 2024 expansion pack launch, token prices surged substantially, demonstrating strong correlation with major game updates and player engagement.
Use technical analysis with moving averages, RSI, and MACD indicators to track price trends. Combine with fundamental analysis by monitoring trading volume, market sentiment, and project developments. Leverage charting platforms and on-chain data tools for comprehensive price forecasting.
What are the risks of WEST price prediction? How should I rationally view prediction results?
Price predictions involve market volatility, policy changes, and information asymmetry risks. Rationally evaluate predictions by considering long-term trends and your risk tolerance. Avoid emotional trading and maintain composure.
What are WEST's advantages and disadvantages compared to similar tokens?
WEST excels in decentralization and community engagement, offering strong technological innovation potential. However, it faces challenges in market liquidity and mainstream recognition compared to established tokens, presenting both growth opportunity and volatility risk.
WEST的未来发展前景如何?项目方的路线图是什么?
WEST shows strong growth potential with expanding ecosystem development. The project roadmap includes enhanced platform functionality, increased transaction volume, and strategic partnerships to drive adoption and strengthen market position.
* The information is not intended to be and does not constitute financial advice or any other recommendation of any sort offered or endorsed by Gate.