2026 WSDM Price Prediction: Advanced Machine Learning Models and Market Trend Analysis for Next-Generation Search and Data Mining

Introduction: WSDM's Market Position and Investment Value
Wisdomise AI (WSDM) serves as an AI-powered intelligence and investment platform within the crypto ecosystem, functioning since its launch in 2024 to democratize wealth creation through automated financial instruments. As of 2026, WSDM maintains a market capitalization of approximately $225,933, with a circulating supply of around 487.87 million tokens, and the price hovering near $0.0004631. This asset, positioned as a Swiss-regulated AI investment solution, is playing an evolving role in combining proprietary insights with DeFi protocols to enable risk-adjusted crypto market participation.
This article will comprehensively analyze WSDM's price trajectory from 2026 to 2031, incorporating historical patterns, market supply-demand dynamics, ecosystem development, and macroeconomic conditions to provide investors with professional price forecasts and practical investment strategies.
I. WSDM Price History Review and Market Status
WSDM Historical Price Evolution Trajectory
- 2024: Token launch in May with an initial offering price of $0.03, reaching an all-time high of $0.16 on May 14, 2024, representing substantial growth in the early trading period
- 2024-2025: Market adjustment phase, with price experiencing significant volatility as the project established its presence in the AI-powered investment platform sector
- 2026: Continued market correction, with price declining to an all-time low of $0.0004618 on February 7, 2026, reflecting broader market conditions and token performance challenges
WSDM Current Market Status
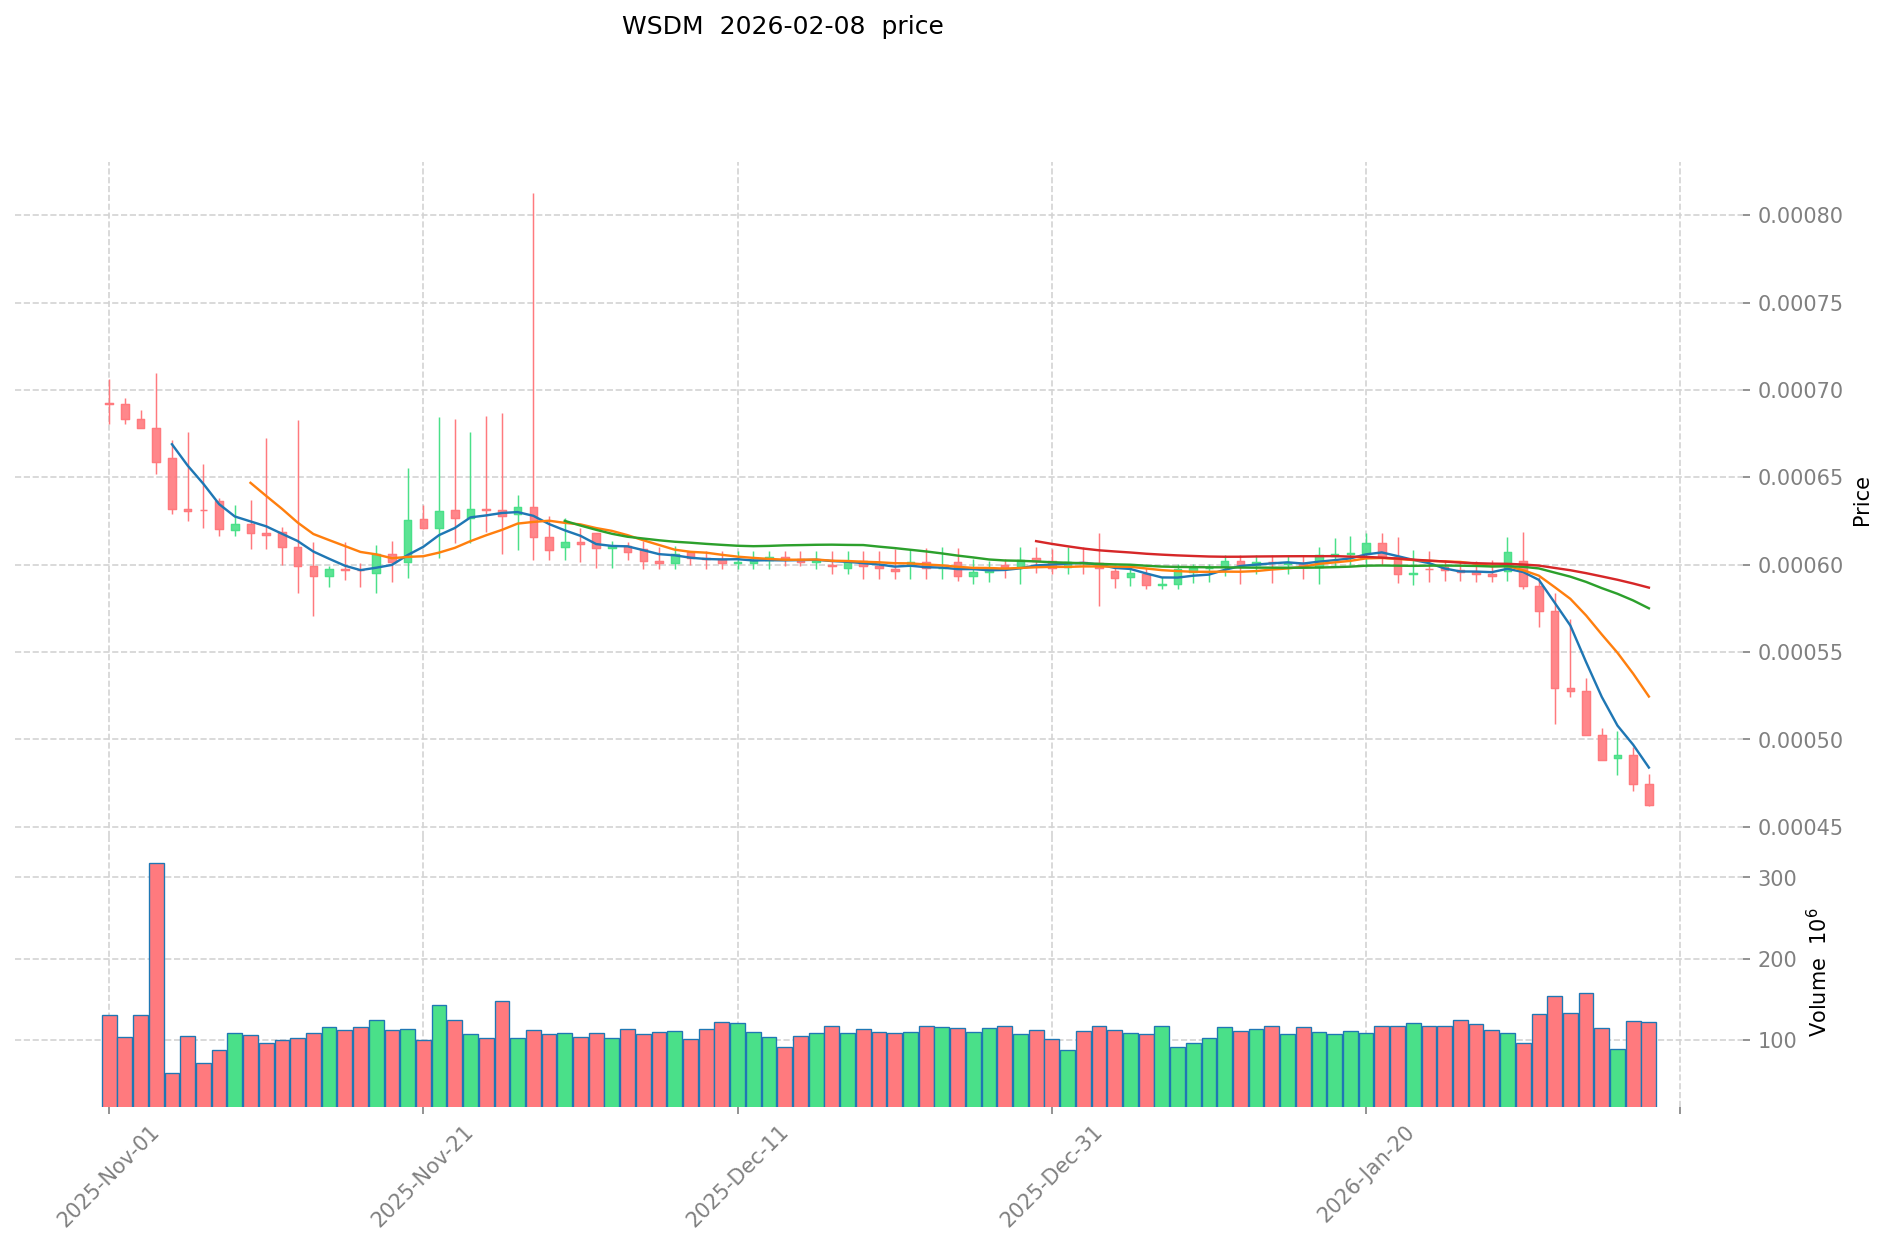
As of February 8, 2026, WSDM is trading at $0.0004631, positioned at $225,933.30 in market capitalization with a ranking of #3794 among digital assets. The token demonstrates a circulating supply of 487.87 million WSDM out of a maximum supply of 1 billion tokens, representing a circulation ratio of approximately 48.79%.
Recent price movements indicate a decline of 0.06% over the past hour and 1.23% over the past 24 hours. The 24-hour trading range spans from $0.0004618 to $0.000473, with trading volume reaching $55,922.96. Over extended timeframes, WSDM has experienced broader declines of 19.25% over the past seven days, 22.45% over the past 30 days, and 95.08% over the past year.
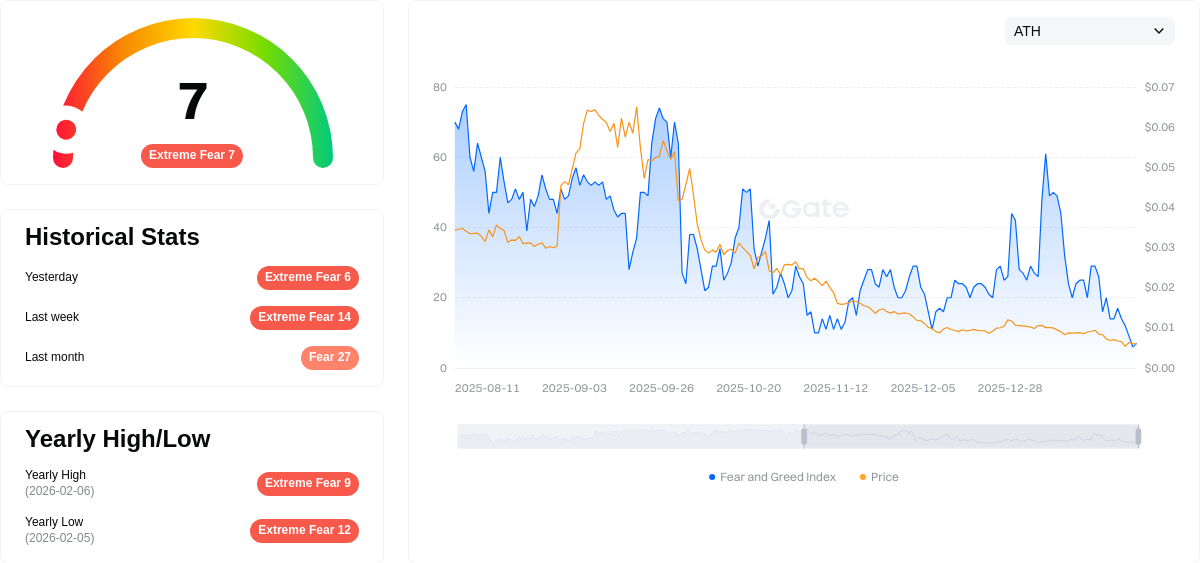
The token's fully diluted valuation stands at $463,100, with the market cap representing 48.79% of this valuation. WSDM maintains a market dominance of 0.000018% and is held by 8,508 addresses. The current market sentiment index registers at 7, indicating an extreme fear environment in the broader cryptocurrency market.
Click to view current WSDM market price
WSDM Market Sentiment Index
02-08-2026 Fear and Greed Index: 7 (Extreme Fear)
Click to view current Fear & Greed Index
The cryptocurrency market is currently experiencing extreme fear, with the Fear and Greed Index at just 7 points. This exceptionally low reading indicates intense market pessimism and risk aversion among investors. During periods of extreme fear, asset prices often reach attractive levels as panic selling dominates trading activity. Experienced traders typically view such extreme sentiment as potential buying opportunities, as markets tend to revert to equilibrium over time. However, caution remains essential, as further downside moves are possible before recovery begins.
WSDM 持仓分布
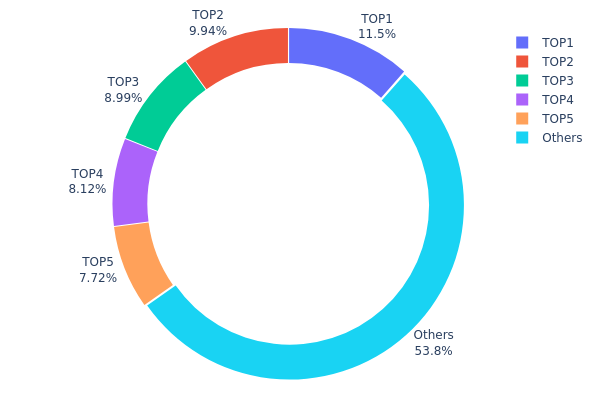
The token holding distribution chart illustrates the percentage of total circulating supply controlled by major addresses, serving as a key indicator of asset centralization and decentralization dynamics. By analyzing the concentration of holdings among top addresses, investors can assess potential market manipulation risks and the overall health of token distribution.
Based on the current data, WSDM exhibits a moderately concentrated holding structure. The top five addresses collectively control approximately 46.21% of the total supply, with the largest single holder accounting for 11.47% (114,715.55K tokens). The second through fifth positions hold 9.93%, 8.98%, 8.11%, and 7.72% respectively. Meanwhile, the remaining 53.79% is distributed among other addresses, indicating a relatively balanced distribution outside the top holders.
This concentration level suggests a hybrid market structure where significant influence remains with major stakeholders while maintaining reasonable decentralization. The absence of extreme concentration (no single address exceeding 15%) reduces the risk of unilateral market manipulation, though coordinated actions among top holders could still impact price movements. The relatively even distribution among top five addresses creates a multi-party balance of power, which typically contributes to more stable price discovery mechanisms and reduces vulnerability to single-point selling pressure. This holding pattern reflects a maturing token economy where early distribution has partially dispersed while maintaining strategic accumulation by key participants.
Click to view current WSDM Holding Distribution
| Top | Address | Holding Qty | Holding (%) |
|---|---|---|---|
| 1 | 0x51e3...bc75e0 | 114715.55K | 11.47% |
| 2 | 0xf91b...ab798d | 99375.00K | 9.93% |
| 3 | 0xf067...b98e47 | 89899.35K | 8.98% |
| 4 | 0x59a7...ce79e2 | 81150.00K | 8.11% |
| 5 | 0x9ac5...7b1c84 | 77217.60K | 7.72% |
| - | Others | 537642.50K | 53.79% |
II. Core Factors Influencing WSDM's Future Price
Market Demand and User Perception
- Perceived Value Gap: The gap between actual value and user perception directly affects price demand. Users tend to accept projects where perceived value aligns more closely with their cognitive expectations.
- User Cognitive Relationships: The influence of positive and negative factors on project perceived value may be less significant than the cognitive relationships of users associated with the current project.
- Current Impact: Market sentiment and user perception remain critical drivers of price volatility in the near term.
Investor Behavior and Market Sentiment
- Trading Decisions: Market regulatory status can influence investor trading decisions, which in turn affects price dynamics.
- Behavioral Patterns: Analysis of user behavior and market trends suggests that investor sentiment plays a substantial role in short-term price movements.
- Market Psychology: The psychological factors behind trading decisions continue to shape market dynamics and price discovery mechanisms.
Technological Progress and Data Analytics
- Data Mining Applications: Advanced data mining techniques, including machine learning and artificial intelligence, are increasingly applied to analyze market patterns and predict trends.
- Predictive Models: The use of sophisticated algorithms like Transformer-based models and neural networks helps forecast price movements based on historical data and current market conditions.
- Information Processing: The ability to process large-scale, real-time data has become essential for understanding market dynamics and identifying valuable patterns.
Competitive Landscape
- Competitor Strategies: Strategies employed by competing projects can influence market positioning and user adoption rates.
- Market Positioning: The project's relative position within the broader ecosystem affects its perceived value and growth potential.
- Innovation Differentiation: Unique features and technological advantages compared to competitors may drive long-term value appreciation.
III. 2026-2031 WSDM Price Prediction
2026 Outlook
- Conservative forecast: $0.00038 - $0.00046
- Neutral forecast: $0.00046
- Optimistic forecast: $0.00068 (requiring favorable market conditions)
2027-2029 Outlook
- Market stage expectations: The project may enter a gradual growth phase during this period, with price volatility potentially remaining significant
- Price range predictions:
- 2027: $0.00043 - $0.00082
- 2028: $0.00048 - $0.00088
- 2029: $0.00042 - $0.00106
- Key catalysts: Market adoption rate, ecosystem development progress, and overall cryptocurrency market sentiment could serve as primary driving factors
2030-2031 Long-term Outlook
- Baseline scenario: $0.00065 - $0.00096 (assuming steady market development and maintained project momentum)
- Optimistic scenario: $0.00092 - $0.00113 (assuming enhanced ecosystem integration and increased trading volume)
- Transformational scenario: Potential to approach $0.00113 (under exceptionally favorable conditions including widespread adoption and strong market support)
- 2026-02-08: WSDM trading within early-stage price discovery range
| Year | Predicted High Price | Predicted Average Price | Predicted Low Price | Price Change |
|---|---|---|---|---|
| 2026 | 0.00068 | 0.00046 | 0.00038 | 0 |
| 2027 | 0.00082 | 0.00057 | 0.00043 | 23 |
| 2028 | 0.00088 | 0.00069 | 0.00048 | 49 |
| 2029 | 0.00106 | 0.00078 | 0.00042 | 69 |
| 2030 | 0.00096 | 0.00092 | 0.00065 | 99 |
| 2031 | 0.00113 | 0.00094 | 0.0009 | 103 |
IV. WSDM Professional Investment Strategy and Risk Management
WSDM Investment Methodology
(1) Long-term Holding Strategy
- Suitable for: Investors seeking exposure to AI-powered investment platforms and believers in democratized wealth creation
- Operational Recommendations:
- Consider accumulation during market dips, as WSDM has experienced significant volatility with a 95.08% decline over the past year
- Monitor the project's ecosystem development and integration of additional dApps and DeFi protocols
- Storage Solution: Utilize Gate Web3 Wallet for secure storage of WSDM tokens on the Polygon network, ensuring compatibility with the contract address 0x5F2F8818002dc64753daeDF4A6CB2CcB757CD220
(2) Active Trading Strategy
- Technical Analysis Tools:
- Moving Averages: Track short-term (7-day: -19.25%) and medium-term (30-day: -22.45%) trends to identify potential reversal points
- Volume Analysis: Monitor the 24-hour trading volume of approximately $55,923 to assess market liquidity and participation
- Swing Trading Considerations:
- Observe the 24-hour price range between $0.0004618 and $0.000473 to identify support and resistance levels
- Be cautious of low liquidity conditions given the relatively modest trading volume
WSDM Risk Management Framework
(1) Asset Allocation Principles
- Conservative Investors: 1-2% of crypto portfolio allocation due to high volatility and early-stage project status
- Aggressive Investors: 3-5% allocation for those with higher risk tolerance and belief in AI-driven investment platforms
- Professional Investors: Up to 5-8% with active monitoring and risk hedging strategies in place
(2) Risk Hedging Solutions
- Portfolio Diversification: Balance WSDM holdings with established cryptocurrencies and stablecoins to mitigate sector-specific risks
- Stop-Loss Implementation: Set stop-loss orders given the token's proximity to its all-time low of $0.0004618
(3) Secure Storage Solutions
- Hot Wallet Recommendation: Gate Web3 Wallet for convenient trading and staking participation while maintaining security on Polygon network
- Cold Storage Option: Consider hardware wallet solutions for long-term holdings exceeding comfortable risk thresholds
- Security Precautions: Verify the correct contract address (0x5F2F8818002dc64753daeDF4A6CB2CcB757CD220) before any transactions, enable two-factor authentication, and never share private keys
V. WSDM Potential Risks and Challenges
WSDM Market Risks
- Extreme Volatility: WSDM has declined 95.08% from its all-time high of $0.16 in May 2024, demonstrating significant price instability
- Limited Liquidity: With a 24-hour trading volume of approximately $55,923 and availability on only one exchange, liquidity constraints may impact trade execution
- Low Market Capitalization: A circulating market cap of approximately $225,933 indicates susceptibility to large price swings from relatively small trading volumes
WSDM Regulatory Risks
- Jurisdictional Uncertainty: While the platform claims Swiss regulatory oversight, evolving global cryptocurrency regulations may impact operations and token utility
- AI Investment Regulation: Emerging regulatory frameworks for AI-powered financial services may introduce compliance requirements affecting the platform's functionality
- Cross-border Compliance: As the platform aims for global financial inclusion, varying regulatory standards across jurisdictions present operational challenges
WSDM Technical Risks
- Smart Contract Vulnerabilities: As a Polygon-based token, WSDM relies on smart contract security; any exploits could affect token value and ecosystem functionality
- Platform Execution Risk: The project's ambitious vision of integrating multiple dApps and DeFi protocols introduces technical complexity and potential integration challenges
- Dependency on Polygon Network: Technical issues or congestion on the Polygon network could impact WSDM token transfers and platform operations
VI. Conclusion and Action Recommendations
WSDM Investment Value Assessment
WSDM represents an early-stage AI-powered investment platform with an ambitious vision of democratizing wealth creation. While the project's approach to combining proprietary AI insights with automated financial instruments addresses a genuine market need, investors should carefully weigh the significant risks. The token's substantial decline of 95.08% over the past year, limited exchange availability, and modest liquidity present considerable challenges. The project's long-term value proposition depends on successful execution of its ecosystem expansion plans and broader adoption of its AI-driven investment tools. Current market conditions suggest heightened caution for potential investors.
WSDM Investment Recommendations
✅ Beginners: Approach with extreme caution; consider allocating no more than 1% of crypto portfolio after thorough research and only invest amounts you can afford to lose entirely ✅ Experienced Investors: Limit exposure to 2-3% of crypto holdings, maintain active monitoring of project development milestones, and implement strict stop-loss protocols ✅ Institutional Investors: Conduct comprehensive due diligence on the platform's regulatory status, technical architecture, and team credentials before considering small-scale allocation as part of a diversified AI/DeFi investment thesis
WSDM Trading Participation Methods
- Spot Trading: Purchase WSDM through available trading pairs on Gate.com, taking advantage of the platform's liquidity and security features
- Staking and Yield Farming: Participate in the ecosystem's staking mechanisms to earn potential rewards while supporting network operations
- Governance Participation: Utilize WSDM tokens for governance rights within the Wisdomise ecosystem as governance mechanisms develop
Cryptocurrency investment carries extremely high risks, and this article does not constitute investment advice. Investors should make prudent decisions based on their own risk tolerance and are advised to consult professional financial advisors. Never invest more than you can afford to lose.
FAQ
What is WSDM price prediction? What is its core principle?
WSDM price prediction analyzes market data and historical trading volumes using predictive models to forecast future prices. The core principle leverages trend analysis and market indicators. Predictions suggest WSDM may fluctuate between $0.01297 and $0.02652 in 2025.
What are the commonly used machine learning algorithms in WSDM price prediction?
Common machine learning algorithms for WSDM price prediction include linear regression, decision trees, and random forests. These models analyze historical price data, trading volume, and market indicators to forecast future price movements.
How to use web search data to improve price prediction model accuracy?
Integrate real-time market sentiment and trend data from web sources into your model. Train with this enriched dataset, validate with separate test data, and regularly retrain to capture emerging market patterns. This multi-source approach significantly enhances prediction precision.
How should feature engineering be performed in WSDM price prediction?
Select key features like trading volume, market cap, and volatility. Handle missing values, normalize data, and create new features combining technical indicators. This enhances model accuracy for price forecasting.
What are the evaluation metrics for WSDM price prediction models? How to measure prediction effectiveness?
WSDM price prediction models use evaluation metrics including Mean Squared Error (MSE) and Mean Absolute Error (MAE) to measure accuracy. These metrics quantify prediction deviation and model performance reliability.
What are practical application cases of WSDM price prediction in e-commerce, stock, or real estate fields?
WSDM price prediction is applied in stock market trend analysis and real estate valuation. In stock markets, it helps analyze price movements and trends. In real estate, it predicts property values based on market data. E-commerce applications remain limited but emerging.
How to handle data sparsity and time series issues in WSDM price prediction?
Data sparsity is resolved through data augmentation and contrastive learning models. Time series challenges are addressed using deep learning and adaptive models that handle rapid market fluctuations better than traditional methods.
Share
Content
Introduction: WSDM's Market Position and Investment Value
I. WSDM Price History Review and Market Status
II. Core Factors Influencing WSDM's Future Price
III. 2026-2031 WSDM Price Prediction
IV. WSDM Professional Investment Strategy and Risk Management
V. WSDM Potential Risks and Challenges
VI. Conclusion and Action Recommendations
FAQ
How to Buy Cryptocurrency


Trending Cryptocurrencies


What will be the market capitalization of USDC in 2025? Analysis of the stablecoin market landscape.

How is DeFi different from Bitcoin?

What is DeFi: Understanding Decentralized Finance in 2025

USDC stablecoin 2025 Latest Analysis: Principles, Advantages, and Web3 Eco-Applications

Development of Decentralized Finance Ecosystem in 2025: Integration of Decentralized Finance Applications with Web3
2025 USDT USD Complete Guide: A Must-Read for Newbie Investors
What is Avalanche (AVAX) market overview: price, market cap, and trading volume in February 2026

What is Avalanche (AVAX): whitepaper logic, use cases, technology innovation, and roadmap explained

How do derivatives market signals predict crypto price movements in 2025: funding rates, liquidations, and open interest data explained

How to analyze on-chain data: active addresses, transaction volume, whale distribution, and gas fees explained
How Will Zcash (ZEC) Price Fluctuate Between $49.96 and $1,422.48 by 2028?