2026 XELS Price Prediction: Expert Analysis and Market Forecast for the Next Bull Run


Introduction: XELS Market Position and Investment Value
XELS (XELS), positioned as an eco-technology platform focused on decentralized climate disclosure solutions, has been operational since 2018 and has established itself within the environmental sustainability sector of the blockchain industry. As of February 5, 2026, XELS maintains a market capitalization of approximately $628,530, with a circulating supply of around 19.59 million tokens, and a price hovering around $0.032. This asset, recognized as a pioneering solution for corporate environmental transparency, is playing an increasingly relevant role in enabling enterprises to generate and maintain accurate, NFT-based carbon offset activity records.
This article will comprehensively analyze XELS price trends from 2026 through 2031, examining historical patterns, market supply and demand dynamics, ecosystem developments, and macroeconomic conditions to provide investors with professional price forecasts and practical investment strategies.
I. XELS Price History Review and Current Market Status
XELS Historical Price Evolution Trajectory
- 2021: XELS reached a peak price during December, trading at approximately $13.95 on December 14, marking a significant milestone in its early trading history
- 2022-2025: The asset experienced a substantial correction phase, reflecting broader market adjustments in the digital asset sector
- 2026: On January 6, XELS recorded its price floor at $0.02887104, representing the lower boundary of its historical trading range
XELS Current Market Status
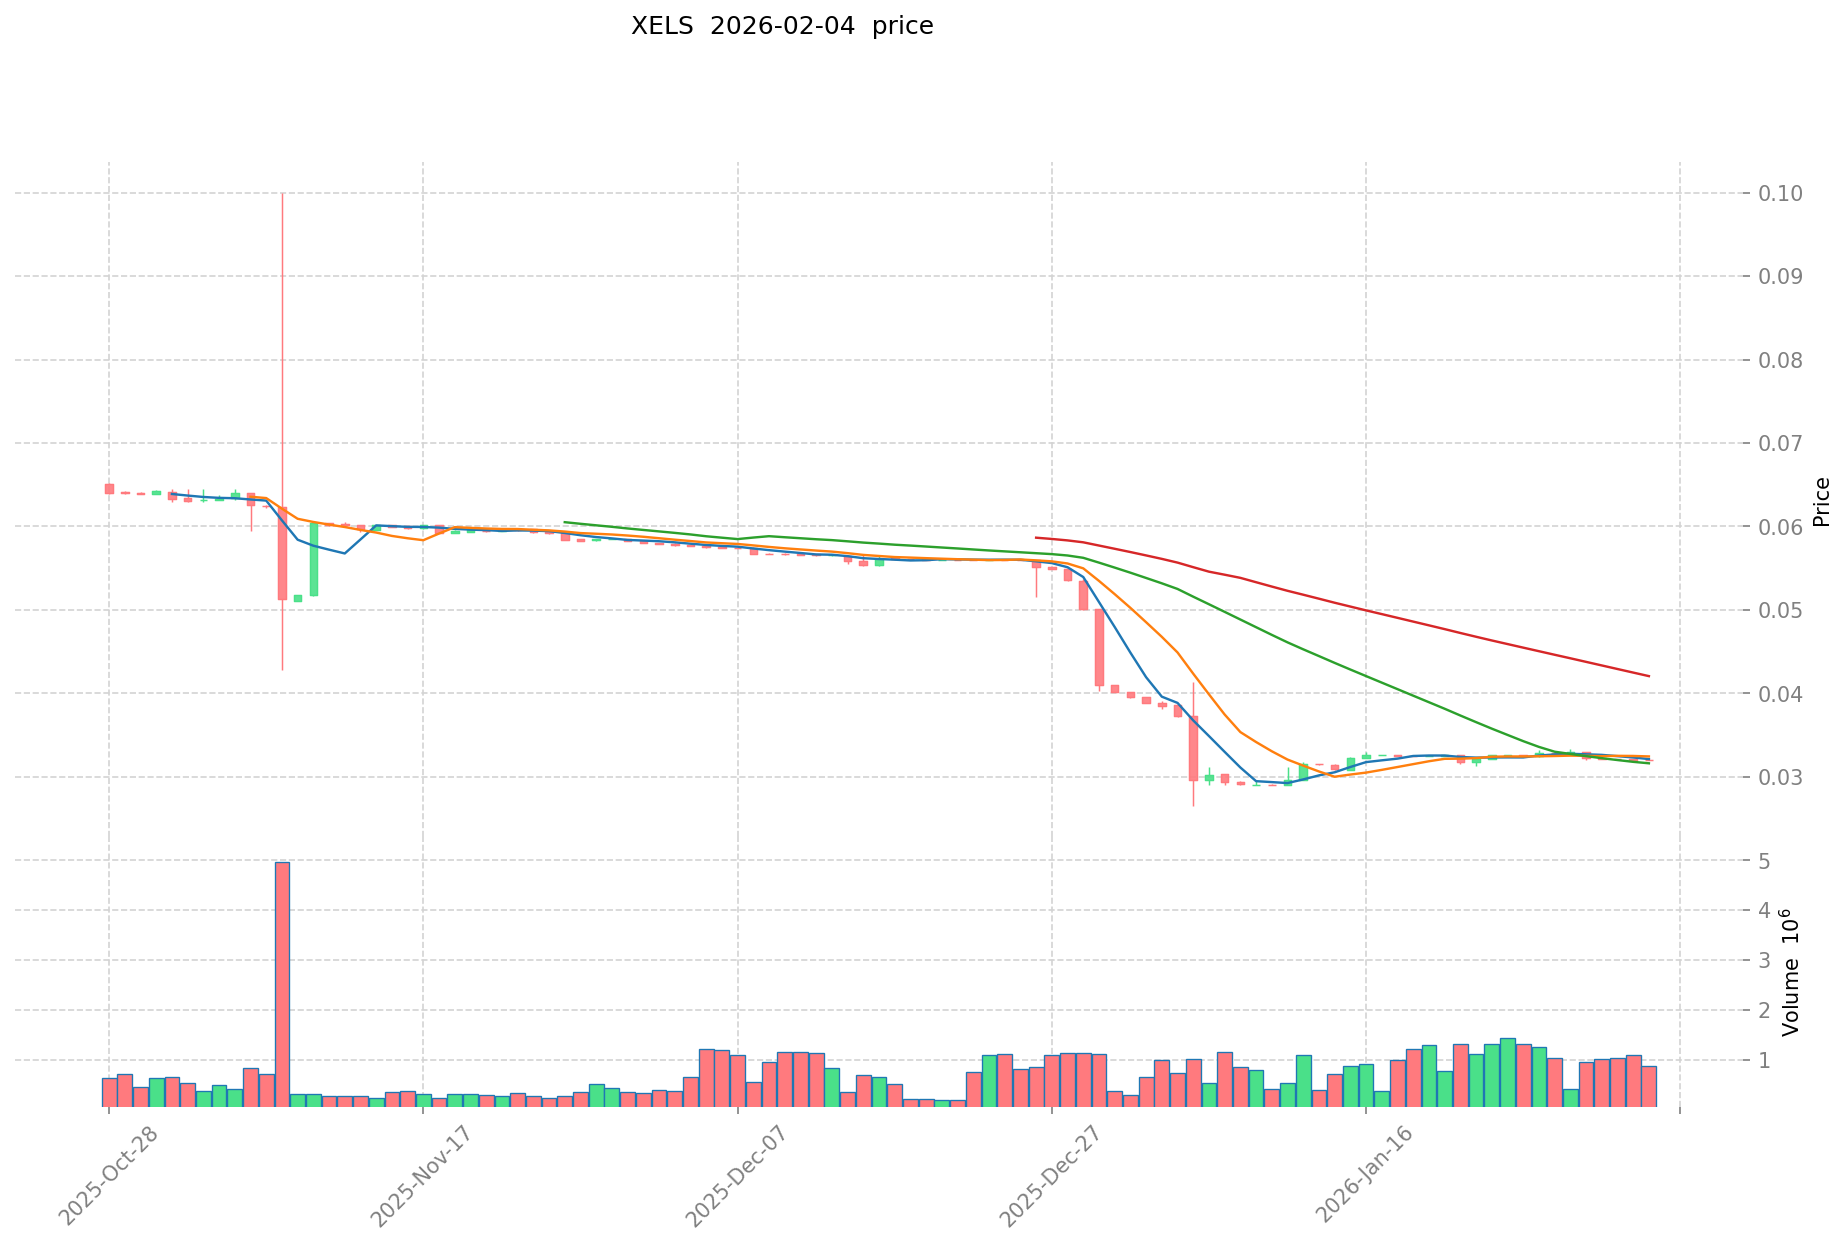
As of February 5, 2026, XELS is trading at $0.032087, showing modest movement within recent sessions. Over the past hour, the asset has registered a 0.13% increase, adding approximately $0.000042 to its value. The 24-hour trading activity reflects relative stability with a marginal 0.03% uptick, translating to a price change of roughly $0.0000096.
Looking at broader timeframes, XELS has demonstrated a 2.53% decline over the past seven days, corresponding to a decrease of approximately $0.000833. However, the 30-day performance shows recovery momentum with a 9.12% gain, equivalent to approximately $0.002682 in value appreciation. The one-year trajectory indicates a 61.06% decline, reflecting a decrease of approximately $0.050314 from year-ago levels.
The asset's 24-hour trading range spans from $0.031875 to $0.032101, with total trading volume reaching $30,332.34. Current circulation stands at 19,588,304.61 XELS tokens, representing 93.28% of the maximum supply of 21,000,000 tokens. The circulating market capitalization is positioned at approximately $628,530, while the fully diluted market capitalization reaches $673,827.
With 1,748 holders participating in the XELS ecosystem, the asset maintains trading availability on Gate.com. The current market sentiment index registers at 14, indicating an extremely cautious market environment. XELS holds a market dominance of 0.000026%, reflecting its position within the broader digital asset landscape.
Click to view current XELS market price
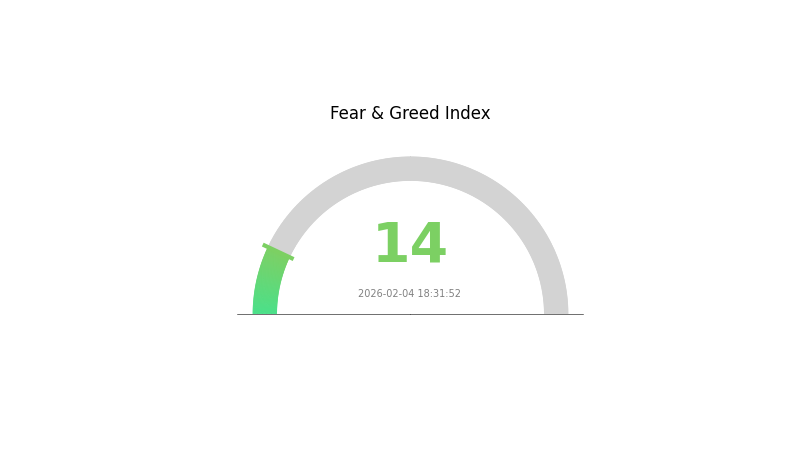
XELS Market Sentiment Indicator
2026-02-04 Fear and Greed Index: 14 (Extreme Fear)
Click to view the current Fear & Greed Index
The cryptocurrency market is currently experiencing extreme fear sentiment with an index reading of 14. This significantly low reading indicates investors are highly pessimistic about market conditions and may be over-selling assets. Such extreme fear often presents contrarian opportunities for long-term investors, as markets typically recover from panic-driven lows. However, caution is still warranted as underlying fundamental weaknesses may continue driving prices lower. Monitor key support levels and market catalysts closely before making investment decisions during this period of heightened uncertainty.
XELS Holding Distribution
The holding distribution chart visualizes how XELS tokens are allocated across different wallet addresses on the blockchain, serving as a critical indicator of token concentration and decentralization levels. This metric helps assess whether token holdings are dispersed among numerous holders or concentrated within a few major addresses, which directly impacts market stability and manipulation risk.
Based on current on-chain data, XELS exhibits a moderately concentrated holding structure. The top holder controls approximately 24.95% of the total supply (5.24 million tokens), while the top five addresses collectively hold 51.71% of circulating tokens. Notably, the "Others" category accounts for 48.29% of holdings, indicating that nearly half of the token supply is distributed among smaller addresses. This distribution pattern suggests a dual-layered structure: while major holders retain significant influence, a substantial portion of tokens remains dispersed across the broader community.
This concentration level presents both opportunities and risks for market participants. The dominance of top addresses could lead to increased price volatility if these entities decide to execute large-scale transactions, potentially triggering significant market movements. However, the relatively balanced distribution—with no single address controlling more than 25% and nearly half the supply distributed among smaller holders—indicates a healthier ecosystem compared to projects with extreme concentration. The current structure suggests moderate decentralization, which provides reasonable protection against single-point manipulation while maintaining sufficient liquidity concentration for market depth. Investors should monitor changes in this distribution pattern, as shifts in major holder positions often precede significant price movements.
Click to view current XELS Holding Distribution
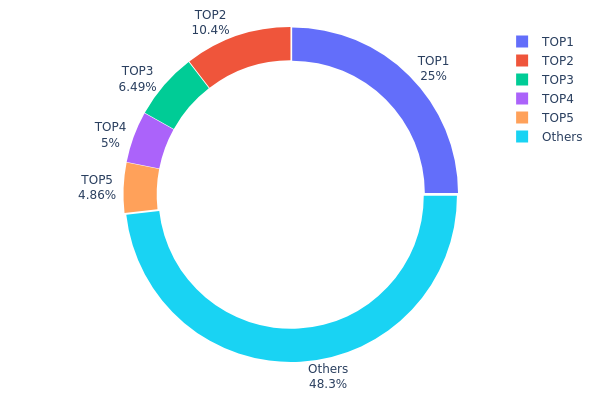
| Top | Address | Holding Qty | Holding (%) |
|---|---|---|---|
| 1 | 0x9642...2f5d4e | 5241.18K | 24.95% |
| 2 | 0x1e14...5e5a2c | 2191.52K | 10.43% |
| 3 | 0xe7c2...978af2 | 1361.92K | 6.48% |
| 4 | 0xd355...54bd86 | 1050.00K | 5.00% |
| 5 | 0xc873...64e16e | 1020.00K | 4.85% |
| - | Others | 10135.39K | 48.29% |
II. Core Factors Influencing XELS Future Price
Supply Mechanism
- Annual Growth Rate: XELS is expected to follow an annual growth rate of approximately 5%, which reflects a moderate supply expansion model designed to balance inflation and scarcity.
- Historical Patterns: Market cycles have demonstrated significant price volatility. XELS experienced a peak of $13.95 in December 2021, followed by a substantial decline to $0.03664388, indicating that supply dynamics combined with market sentiment cycles can lead to dramatic price swings.
- Current Impact: The projected 5% annual growth rate suggests a controlled supply expansion that may support gradual price appreciation over the coming years, provided demand factors remain favorable.
Market Demand and Adoption Trends
- Institutional Participation: The level of institutional involvement remains a critical factor. Increased institutional adoption could provide stability and upward price pressure, though specific institutional holdings were not detailed in the available materials.
- Technology Adoption: As a blockchain-based solution positioned within the carbon credit trading space, broader adoption of carbon credit mechanisms and environmental sustainability initiatives could enhance demand for XELS.
- Market Sentiment: Investor sentiment plays a pivotal role in price fluctuations. Positive market psychology, driven by technological developments or favorable regulatory news, can accelerate price movements.
Macroeconomic Environment
- Economic Factors: Broader economic conditions, including global monetary policies, inflation rates, and economic growth trajectories, influence cryptocurrency valuations. A favorable macroeconomic backdrop may support risk asset appreciation, including digital assets like XELS.
- Risk Appetite: Changes in investor risk appetite, often driven by economic uncertainty or stability, directly impact cryptocurrency markets. Periods of heightened risk aversion typically result in downward price pressure.
Technology Development and Ecosystem
- Blockchain Infrastructure: XELS operates as a blockchain solution focused on carbon credit trading, positioning it within the growing environmental sustainability sector. Technological improvements and ecosystem expansion could enhance utility and demand.
- Application Scenarios: The development of practical use cases and partnerships within the carbon credit market may strengthen XELS' value proposition and drive adoption among enterprises and institutions focused on environmental compliance.
III. 2026-2031 XELS Price Prediction
2026 Outlook
- Conservative prediction: $0.02663 - $0.03209
- Neutral prediction: $0.03209
- Optimistic prediction: $0.04652 (subject to favorable market conditions)
2027-2029 Outlook
- Market stage expectation: The token may enter a gradual recovery phase with moderate volatility as the broader cryptocurrency market stabilizes
- Price range predictions:
- 2027: $0.02398 - $0.0452
- 2028: $0.03887 - $0.04859
- 2029: $0.0268 - $0.06632
- Key catalysts: Increased adoption rates, potential partnerships, and overall market sentiment improvements could drive upward momentum
2030-2031 Long-term Outlook
- Baseline scenario: $0.05308 - $0.06928 (assuming steady ecosystem development and sustained user engagement)
- Optimistic scenario: $0.06257 - $0.08135 (contingent upon successful platform upgrades and expanding use cases)
- Transformative scenario: Above $0.08135 (under exceptionally favorable conditions including mainstream adoption and significant technological breakthroughs)
- 2026-02-05: XELS is positioned at the beginning of its forecast period with baseline predictions suggesting modest growth potential over the coming years
| Year | Predicted High Price | Predicted Average Price | Predicted Low Price | Price Change |
|---|---|---|---|---|
| 2026 | 0.04652 | 0.03209 | 0.02663 | 0 |
| 2027 | 0.0452 | 0.03931 | 0.02398 | 22 |
| 2028 | 0.04859 | 0.04225 | 0.03887 | 31 |
| 2029 | 0.06632 | 0.04542 | 0.0268 | 41 |
| 2030 | 0.06928 | 0.05587 | 0.05308 | 74 |
| 2031 | 0.08135 | 0.06257 | 0.0388 | 95 |
IV. XELS Professional Investment Strategies and Risk Management
XELS Investment Methodology
(I) Long-Term Holding Strategy
- Target Investors: Environmental-conscious investors and those seeking exposure to climate technology blockchain solutions
- Operational Recommendations:
- Consider accumulating positions during market downturns, given the token's current price remains significantly below its historical high
- Monitor developments in carbon credit verification and corporate environmental reporting regulations that may drive adoption
- Utilize Gate.com's spot trading features to build positions gradually through dollar-cost averaging
(II) Active Trading Strategy
- Technical Analysis Tools:
- Moving Averages: Track 50-day and 200-day moving averages to identify potential trend reversals in this low-liquidity asset
- Volume Analysis: Monitor the 24-hour trading volume ($30,332) relative to market cap to assess trading activity and potential breakout opportunities
- Swing Trading Considerations:
- Given the relatively low market cap and limited exchange availability, expect higher volatility and wider bid-ask spreads
- Set clear profit targets and stop-loss levels to manage risk in illiquid market conditions
XELS Risk Management Framework
(I) Asset Allocation Principles
- Conservative Investors: 0.5-1% allocation as a speculative position within a diversified crypto portfolio
- Aggressive Investors: 2-3% allocation for those with higher risk tolerance and conviction in climate tech solutions
- Professional Investors: May consider larger positions based on comprehensive due diligence of the project's business development and partnership progress
(II) Risk Hedging Approaches
- Portfolio Diversification: Balance XELS exposure with established cryptocurrencies and other climate-focused blockchain projects
- Position Sizing: Limit initial investment to amounts that align with the token's high-risk profile and limited liquidity
(III) Secure Storage Solutions
- Gate Web3 Wallet: Recommended for convenient access while maintaining self-custody of XELS tokens on the Ethereum network
- Hardware Wallet Integration: For larger holdings, consider using hardware wallets compatible with ERC-20 tokens for enhanced security
- Security Precautions: Always verify contract address (0x397Deb686C72384FAd502A81f4d7fDb89e1f1280) before transactions, enable two-factor authentication, and never share private keys
V. XELS Potential Risks and Challenges
XELS Market Risks
- Liquidity Constraints: With only one exchange listing and relatively low trading volume, investors may face challenges entering or exiting positions at desired prices
- Price Volatility: The token has experienced substantial price fluctuations, currently trading around $0.032 compared to its historical high of $13.95, indicating potential for significant price swings
- Market Cap Limitations: With a market capitalization under $700,000, the project remains highly speculative and subject to dramatic value changes
XELS Regulatory Risks
- Carbon Credit Regulation: Evolving regulations around blockchain-based carbon credits and environmental disclosures may impact the platform's utility and adoption
- Securities Classification: Potential regulatory scrutiny regarding token classification in various jurisdictions could affect trading availability
- Environmental Claims Verification: Increasing regulatory focus on greenwashing and environmental claim substantiation may create compliance challenges
XELS Technical Risks
- Smart Contract Security: As an ERC-20 token, XELS is subject to potential vulnerabilities in its smart contract implementation
- Platform Development Risk: The project's success depends on continued development of its carbon disclosure platform and NFT-based verification system
- Adoption Challenges: The platform must overcome significant barriers to achieve widespread enterprise adoption in a competitive carbon tracking market
VI. Conclusion and Action Recommendations
XELS Investment Value Assessment
XELS represents a high-risk, early-stage investment opportunity in the blockchain-based climate technology sector. The project addresses a growing need for transparent corporate environmental reporting through its NFT-based carbon offset tracking system. However, the token's current market position—trading near historical lows with limited liquidity and a single exchange listing—reflects significant execution risks and uncertain near-term prospects. Long-term value depends heavily on the platform's ability to secure enterprise clients and establish credibility in carbon credit verification markets. The substantial gap between current price and fully diluted valuation suggests limited near-term dilution risk, as 93.28% of total supply is already in circulation.
XELS Investment Recommendations
✅ Beginners: Avoid or allocate only minimal speculative capital (under 1% of crypto portfolio) given high volatility, low liquidity, and early-stage project status ✅ Experienced Investors: Consider small position sizing (1-3%) if aligned with climate technology investment thesis, while maintaining strict risk controls and realistic expectations ✅ Institutional Investors: Conduct thorough due diligence on platform adoption metrics, partnership progress, and competitive positioning before considering allocation
XELS Trading Participation Methods
- Spot Trading on Gate.com: Purchase XELS directly through the platform's spot markets with various fiat and cryptocurrency pairs
- Dollar-Cost Averaging: Implement systematic purchases over time to mitigate volatility risk and build positions at averaged prices
- Limit Orders: Utilize limit orders rather than market orders to manage slippage in low-liquidity conditions
Cryptocurrency investment carries extremely high risks, and this article does not constitute investment advice. Investors should make prudent decisions based on their own risk tolerance and are advised to consult professional financial advisors. Never invest more than you can afford to lose.
FAQ
What is XELS? What are its basic functions and use cases?
XELS is a blockchain platform combining blockchain technology with environmental sustainability. It aims to transform corporate management and reduce carbon emissions. Its core functions include providing sustainable solutions and supporting eco-friendly projects to decrease enterprise carbon footprints.
What is the historical price performance of XELS? What is the price trend over the past year?
XELS declined 59.03% over the past year. Current market trends remain uncertain. Projections suggest potential 5% growth by 2030, though the outlook remains mixed.
What are the main factors affecting XELS price?
XELS price is influenced by supply and demand dynamics, market sentiment, regulatory changes, institutional adoption rates, and overall economic trends. Trading volume and blockchain ecosystem development also play crucial roles in price movements.
What is the XELS price prediction for 2024? How do experts view it?
2024 XELS price prediction data is not available. As of February 2026, historical 2024 data cannot provide forward-looking forecasts. Expert consensus on 2024 performance has not been formally published in current market reports.
What are the advantages and disadvantages of XELS compared to similar tokens?
XELS offers unique community benefits including exclusive Discord access and early merchandise opportunities. However, it faces relatively lower market liquidity and competitive positioning compared to established tokens in the market.
What are the main risks of investing in XELS?
XELS investment carries market volatility risk and regulatory uncertainty. Long-term holding involves significant risk exposure. Investors should thoroughly understand these risks before participating, especially non-professionals should exercise caution.
Share
Content
Introduction: XELS Market Position and Investment Value
I. XELS Price History Review and Current Market Status
II. Core Factors Influencing XELS Future Price
III. 2026-2031 XELS Price Prediction
IV. XELS Professional Investment Strategies and Risk Management
V. XELS Potential Risks and Challenges
VI. Conclusion and Action Recommendations
FAQ
How to Buy Cryptocurrency


Trending Cryptocurrencies


2025 SUI coin: price, buying guide, and Staking rewards

How to Buy Crypto: A Step-by-Step Guide with Gate.com

HNT Price in 2025: Helium Network Token Value and Market Analysis

What is SwissCheese (SWCH) and How Does It Democratize Investment?

Cardano (ADA) Price Analysis and Outlook for 2025
How to Invest in Metaverse Crypto

Is Göztepe S.K. Fan Token (GOZ) a good investment?: A comprehensive analysis of risks, returns, and market potential for football fans and crypto investors

Is Griffin AI (GAIN) a good investment?: A Comprehensive Analysis of the Emerging AI Token's Potential and Risks

Is STEPN Failing to Generate Profits? Exploring the Factors Behind Its Downturn
LABUBU vs BTC: Which Digital Asset Will Dominate the Future of Collectibles and Cryptocurrency?
GOZ vs BTC: Which Cryptocurrency Offers Better Investment Potential in 2024?