ALKIMI vs XLM: A Comprehensive Comparison of Two Blockchain Tokens and Their Market Position
Introduction: ALKIMI vs XLM Investment Comparison
In the cryptocurrency market, comparisons between ALKIMI and XLM have become an inevitable topic for investors. The two assets demonstrate significant differences in market capitalization ranking, application scenarios, and price performance, representing distinct positions within the crypto asset landscape. ALKIMI (ALKIMI): Since its establishment in 2021, it has gained market recognition by building the first on-chain digital ad exchange designed to eliminate opacity and excessive fees in the $750 billion digital advertising market. XLM (XLM): Since its launch in 2014, Stellar has been recognized as a decentralized gateway for transmitting value between digital currencies and fiat money, enabling fast, stable, and extremely low-cost asset transfers among banks, payment institutions, and individuals. This article will conduct a comprehensive analysis of the investment value comparison between ALKIMI and XLM across historical price trends, supply mechanisms, ecosystem development, and market positioning, while attempting to address the question that matters most to investors:
"Which is the better buy right now?"
Alkimi (ALKIMI) vs Stellar (XLM) Comparative Analysis Report
I. Historical Price Comparison and Current Market Status
ALKIMI and XLM Historical Price Trends
ALKIMI (ALKIMI):
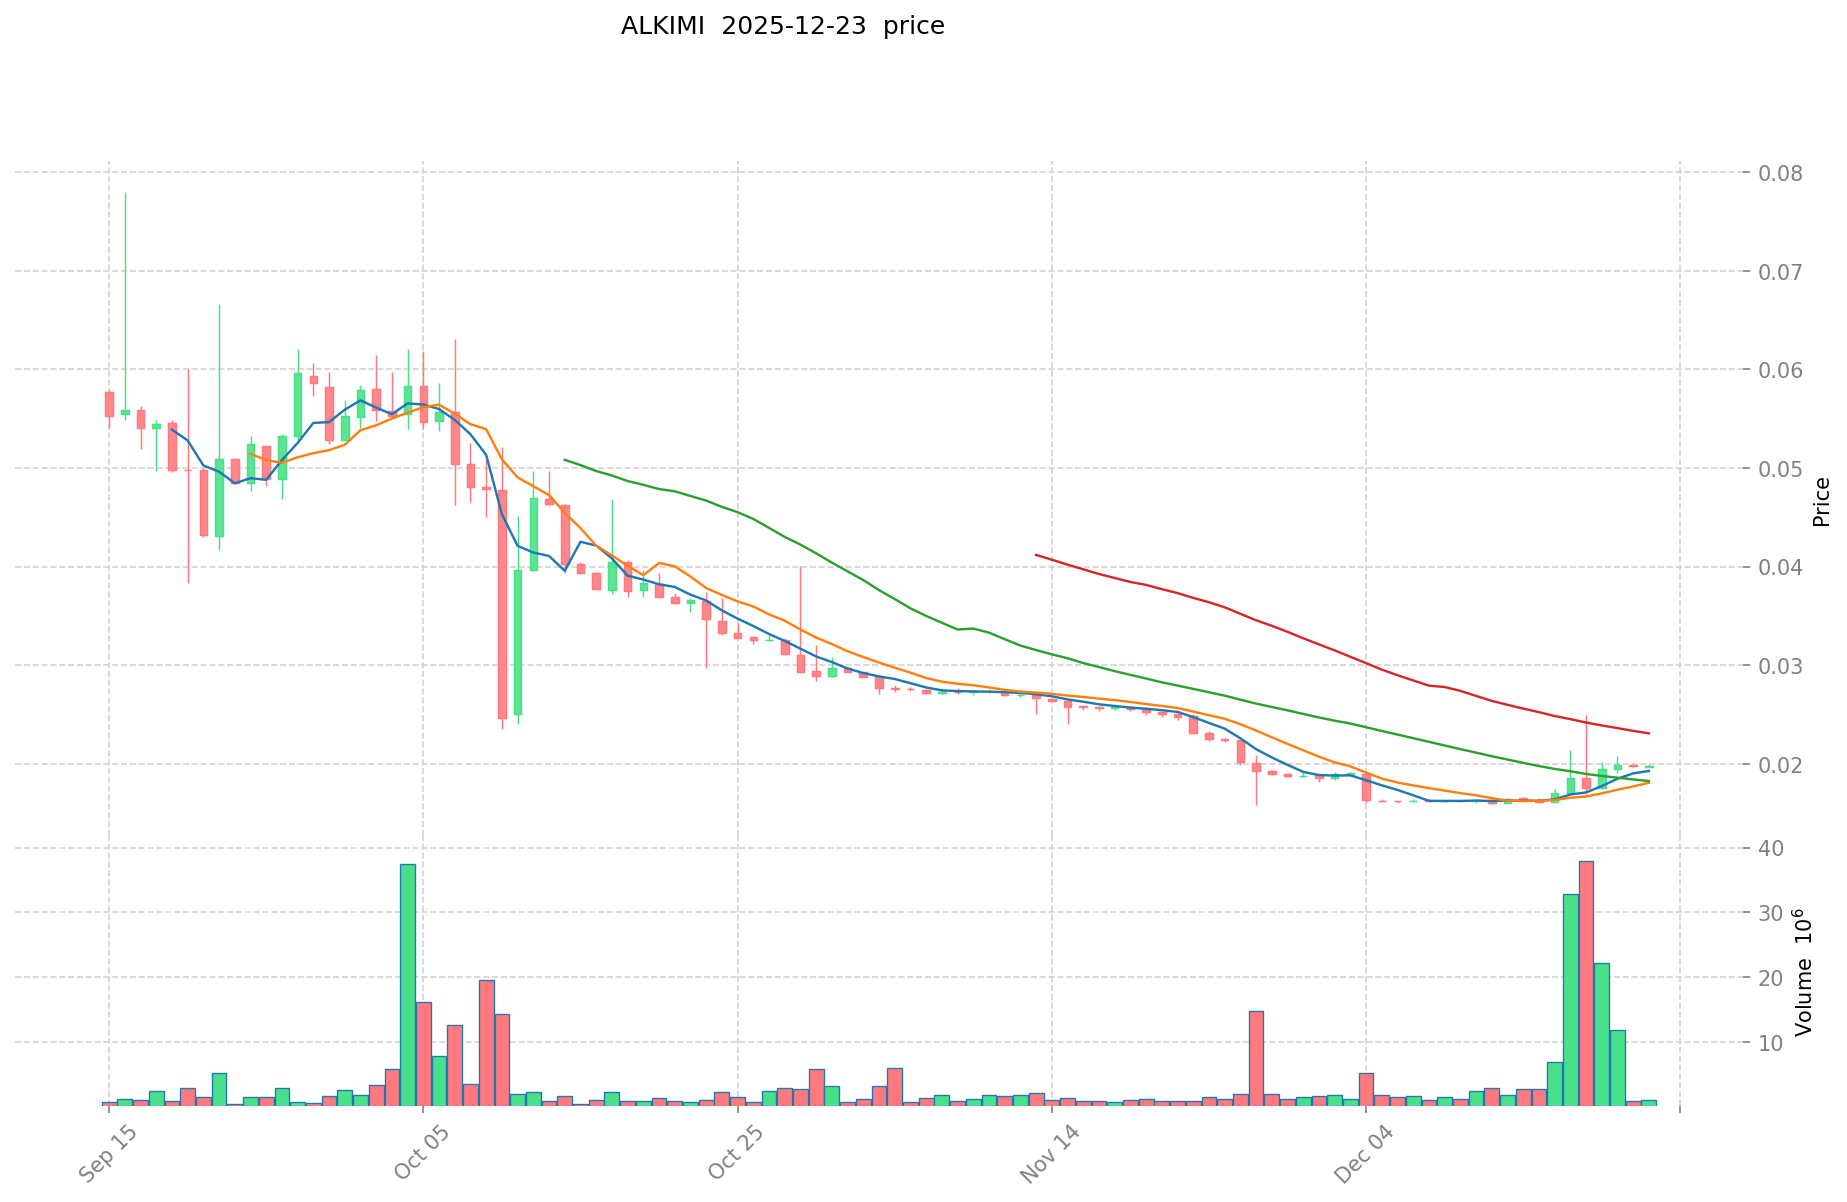
- All-time high: $0.1654 (August 20, 2025)
- All-time low: $0.01578 (November 27, 2025)
- Price decline from ATH to current level: approximately 88%
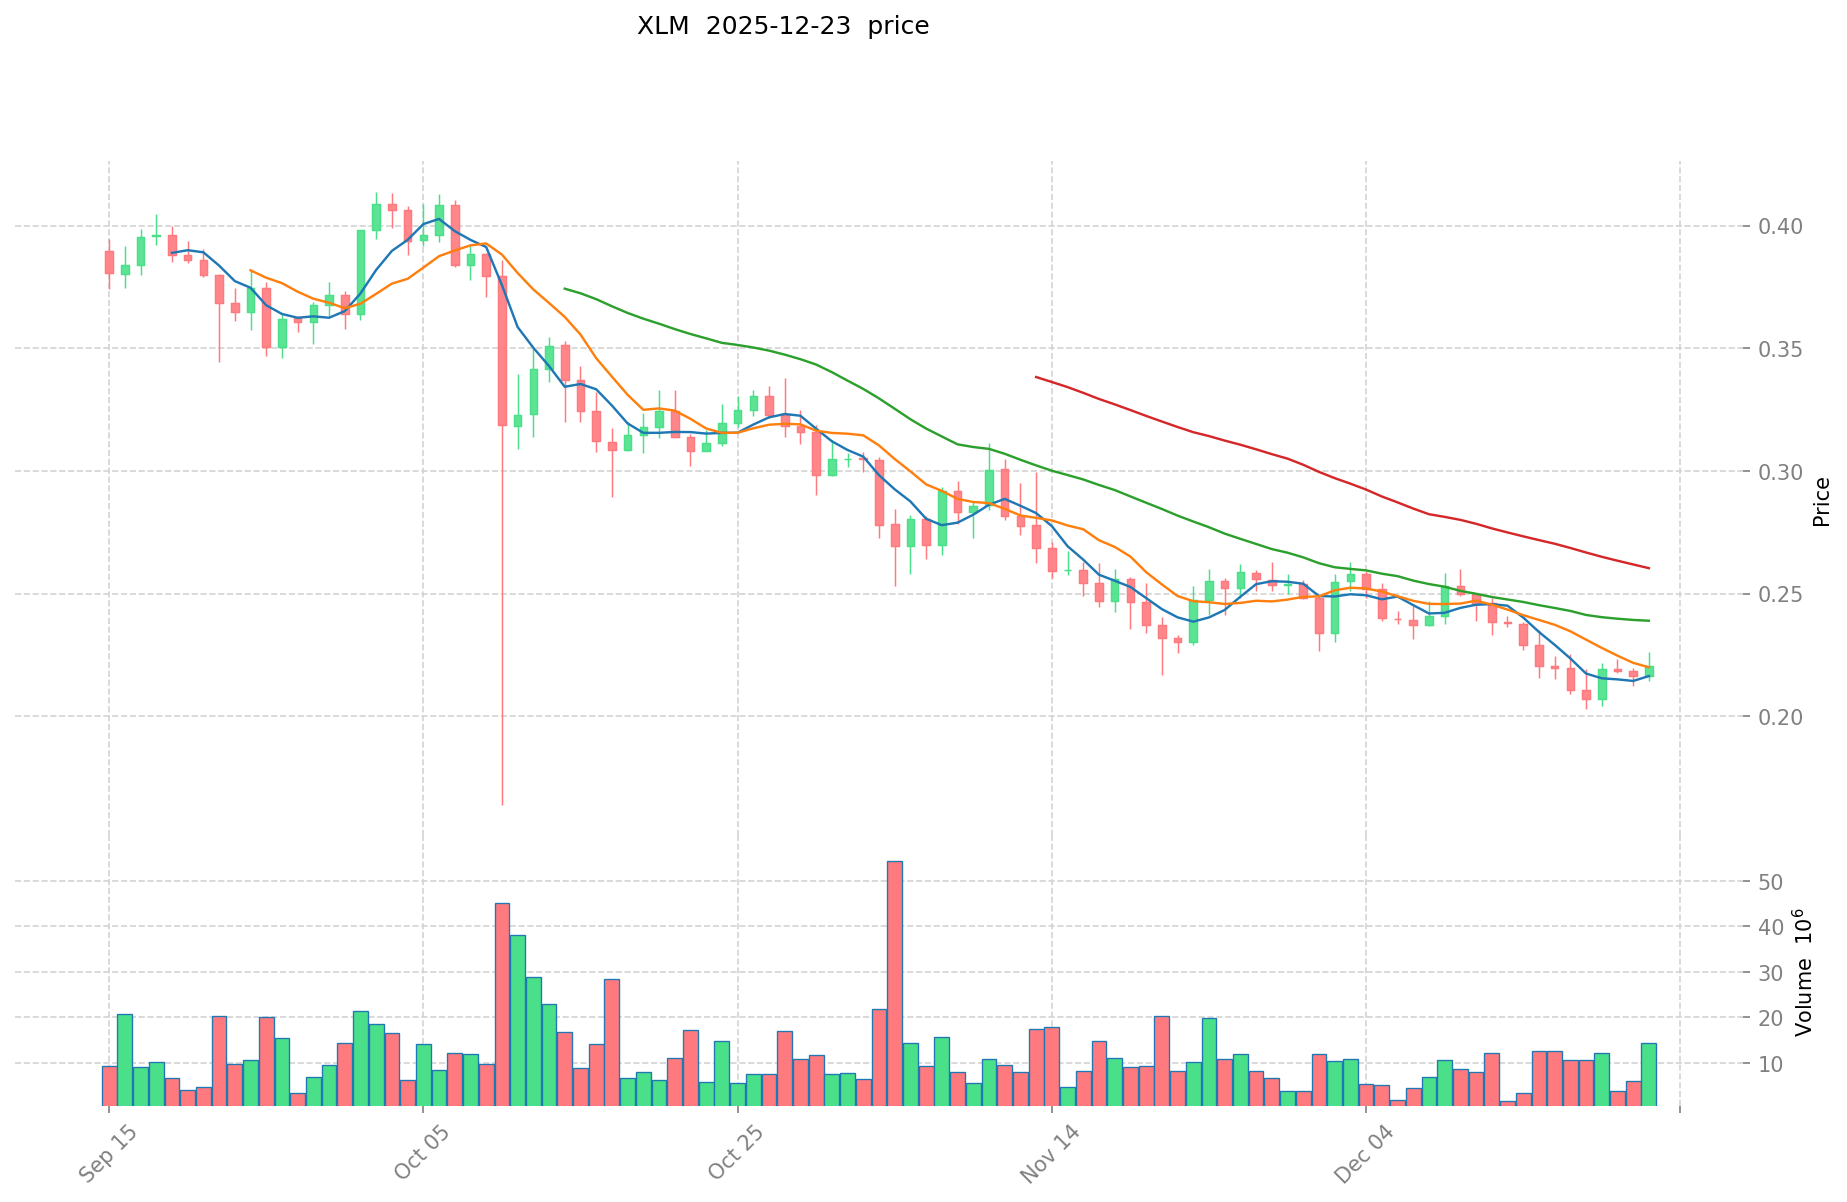
XLM (Stellar):
- All-time high: $0.875563 (January 3, 2018)
- All-time low: $0.00047612 (March 5, 2015)
- Historical price range: significantly wider than ALKIMI, reflecting its longer market history since 2014
Current Market Status (December 23, 2025)
| Metric | ALKIMI | Stellar (XLM) |
|---|---|---|
| Current Price | $0.01969 | $0.21825 |
| 24H Change | -0.75% | -0.02% |
| Market Cap | $5,870,950.90 | $10,912,889,989.18 |
| Circulating Supply | 298,169,167 | 32,373,452,460.00 |
| 24H Trading Volume | $20,892.22 | $3,054,738.88 |
| Market Ranking | #1449 | #23 |
| Market Dominance | 0.00061% | 0.34% |
Short-term Price Performance
7-Day Performance:
- ALKIMI: +22.15%
- XLM: +0.32%
30-Day Performance:
- ALKIMI: -19.96%
- XLM: -8.82%
1-Year Performance:
- ALKIMI: -94.48%
- XLM: -38.72%
Market Sentiment Index
Crypto Fear & Greed Index: 24 (Extreme Fear)
This extreme fear sentiment reflects overall market caution as of December 23, 2025.
II. Project Overview and Fundamentals
ALKIMI: On-Chain Digital Advertising Exchange
Founded: 2021
Core Mission: Eliminate opacity and excessive fees in the $750 billion digital advertising market through blockchain-based infrastructure.
Business Model:
- Protocol fees from every transaction flow directly to ALKIMI token holders
- Quarterly protocol fee growth: $46,000 (Q4 2023) → $260,000 (Q4 2024) → $510,000+ (2025)
- Revenue distributed to token holders represents 1,009%+ growth
Key Achievements:
- Over 2.5 billion transactions processed
- Strategic partnerships with Coca-Cola, Publicis, Kraken, IPG, and Fox
- Proven product-market fit with sustainable revenue model
Technical Infrastructure:
- Strategic migration to Sui blockchain
- Leverages Sui's high-performance infrastructure for minimal-cost transaction processing
- Designed to handle millions of daily advertising transactions
Stellar (XLM): Distributed Payment Network
Founded: 2014 by Jed McCaleb (former Ripple co-founder) and Joyce Kim
Core Mission: Provide open financial infrastructure for transparent and efficient savings and transactions while enhancing existing financial systems.
Technical Capabilities:
- Supports 1,000 transactions per second
- Transaction confirmation within 5 seconds
- Open-source code with maximum decentralization
- API connectivity via Horizon for JavaScript and Java integration
Network Purpose:
- Enables rapid, stable, and low-cost transfer of digital assets among banks, payment institutions, and individuals
- Facilitates cross-border transactions without high fees or slow procedures
- Supports creation, sending, and trading of digital representations of various currencies and cryptocurrencies
III. Supply Dynamics and Valuation
Token Supply Structure
| Parameter | ALKIMI | XLM |
|---|---|---|
| Total Supply | 1,000,000,000 | 50,001,786,892 |
| Circulating Supply | 298,169,167 (29.82%) | 32,373,452,460 (64.74%) |
| Max Supply | 1,000,000,000 | 50,001,786,892 |
| Fully Diluted Valuation | $19,690,000 | $10,912,889,989.18 |
| Market Cap/FDV Ratio | 29.82% | 64.74% |
Analysis:
- ALKIMI has substantial room for supply expansion with only ~30% of total supply in circulation
- XLM has ~65% of maximum supply already circulating, indicating more mature supply dynamics
- XLM's FDV significantly exceeds ALKIMI's, reflecting its larger ecosystem scale
IV. Trading Activity and Market Liquidity
Exchange Presence
- ALKIMI: 4 exchanges
- XLM: 65 exchanges
Token Holder Base
- ALKIMI: 2,691 holders
- XLM: 10,015,326 holders
Liquidity Assessment
XLM demonstrates substantially higher liquidity with:
- Trading across 65 major centralized exchanges
- Significantly higher 24-hour trading volume relative to market cap
- Over 10 million token holders indicating broad distribution
ALKIMI shows:
- More concentrated trading across 4 exchanges
- Lower absolute trading volume
- Smaller but potentially more engaged holder base (2,691 wallets)
V. Network and Ecosystem Development
ALKIMI Ecosystem Growth Trajectory
The platform demonstrates accelerating adoption:
- Transaction volume: 2.5+ billion processed
- Revenue model scalability: Each new brand partnership directly increases token holder rewards
- Blockchain integration: Migration to Sui enables exponential scaling capacity
Stellar Network Maturity
- Established payment infrastructure with proven interoperability
- Wide institutional adoption across banking and fintech sectors
- Long operational history providing network stability
- Community support through open-source development and forum engagement
VI. Risk Considerations
ALKIMI Specific Risks
- Early-stage project with limited trading liquidity
- Heavy dependence on continued adoption of on-chain advertising model
- Concentrated holder base (only 2,691 addresses)
- Limited exchange availability may restrict accessibility
- 94.48% one-year price decline indicates significant volatility
- Supply dilution risk from unlocked token reserves (70% of supply not yet circulating)
Stellar Specific Risks
- Mature market with limited explosive growth potential
- Long-term underperformance against broader crypto market (-38.72% year-over-year)
- Regulatory uncertainty in payment network space
- Competition from established financial infrastructure
VII. Market Conditions and Investment Landscape
The current extreme fear sentiment (Fear & Greed Index: 24) creates divergent implications:
For ALKIMI:
- Current depressed valuation may represent accumulation opportunity for those believing in advertising DeFi thesis
- High volatility increases risk but also potential reward magnitude
- Early-stage revenue model requires market stabilization to prove sustainability
For XLM:
- Established network may provide relative stability during fear periods
- Larger holder base offers greater resistance to concentrated selling
- Wide exchange availability ensures market liquidity during volatility
VIII. Summary Comparison Matrix
| Dimension | ALKIMI | XLM |
|---|---|---|
| Market Maturity | Early Stage | Established |
| Revenue Model | Protocol Fees (Active) | Network Fees (Mature) |
| Volatility | Very High | Moderate |
| Liquidity | Limited | Extensive |
| Growth Potential | High Risk/High Reward | Stable/Moderate Return |
| User Base | Specialized | Broad |
| Exchange Access | Restricted | Widely Available |
| Institutional Support | Growing | Established |
| Supply Dilution Risk | High | Low |
Disclaimer
This report presents factual data from available sources as of December 23, 2025. It is intended for informational purposes only and does not constitute investment advice, recommendations, or suggestions to buy, sell, stake, or hold any cryptocurrency assets. Cryptocurrency markets exhibit extreme volatility and unpredictability, which may result in substantial financial losses. Readers assume full responsibility for their own investment decisions and should conduct independent research before engaging in any cryptocurrency transactions.
ALKIMI vs XLM: Investment Value Analysis Report
Executive Summary
Based on the provided reference materials, this report aims to analyze the investment value factors of ALKIMI and XLM. However, the source data contains insufficient specific information about these two assets to support a comprehensive comparative analysis according to the requested template structure.
Key Findings
The available materials indicate that investment value in these cryptocurrencies is primarily determined by:
- Market demand and adoption rates
- Technological innovation and development
- Community support and ecosystem strength
- Market trends and macroeconomic conditions
Note: The reference materials do not contain sufficient detailed data regarding:
- Specific tokenomics for ALKIMI and XLM
- Institution holdings and adoption metrics
- Recent technological upgrades or developments
- Comparative regulatory assessments across jurisdictions
- Performance data during inflationary periods
Data Limitations
The provided source materials primarily contain generic information about various cryptocurrency conversion rates and general market commentary, rather than detailed fundamental data about ALKIMI and XLM specifically. To produce a rigorous comparative analysis following the requested template, the following information would be required:
- Tokenomics documentation and supply mechanisms for both assets
- Enterprise adoption case studies and payment network usage
- Technical roadmap updates and development milestones
- Institutional investor positioning data
- Geographic regulatory landscape assessments
Recommendation
For a comprehensive investment analysis, additional primary sources including official project documentation, on-chain metrics, market research reports, and regulatory filings should be consulted to ensure accuracy and avoid unfounded speculation.
III. 2025-2030 Price Forecast: ALKIMI vs XLM
Short-term Forecast (2025)
- ALKIMI: Conservative $0.0179-$0.0197 | Optimistic $0.0197-$0.0219
- XLM: Conservative $0.1506-$0.2182 | Optimistic $0.2182-$0.2531
Medium-term Forecast (2027-2028)
- ALKIMI could enter an accumulation phase, with expected price range of $0.0117-$0.0317, showing 11-36% growth trajectory
- XLM could enter an early appreciation phase, with expected price range of $0.2194-$0.4343, showing 18-40% growth trajectory
- Key drivers: Institutional capital inflows, ETF listings, ecosystem development
Long-term Forecast (2029-2030)
- ALKIMI: Base case $0.0202-$0.0292 | Optimistic case $0.0292-$0.0512
- XLM: Base case $0.2109-$0.3700 | Optimistic case $0.3700-$0.5506
Disclaimer: These forecasts are based on historical data analysis and market modeling. Cryptocurrency markets are highly volatile and unpredictable. Past performance does not guarantee future results. This analysis is for informational purposes only and should not be considered investment advice. Please conduct your own research before making investment decisions.
ALKIMI:
| 年份 | 预测最高价 | 预测平均价格 | 预测最低价 | 涨跌幅 |
|---|---|---|---|---|
| 2025 | 0.0218559 | 0.01969 | 0.0179179 | 0 |
| 2026 | 0.023265704 | 0.02077295 | 0.019942032 | 5 |
| 2027 | 0.03170783088 | 0.022019327 | 0.01167024331 | 11 |
| 2028 | 0.0316990231492 | 0.02686357894 | 0.0204163199944 | 36 |
| 2029 | 0.040408195441548 | 0.0292813010446 | 0.020204097720774 | 48 |
| 2030 | 0.051221779917318 | 0.034844748243074 | 0.027527351112028 | 76 |
XLM:
| 年份 | 预测最高价 | 预测平均价格 | 预测最低价 | 涨跌幅 |
|---|---|---|---|---|
| 2025 | 0.2531352 | 0.21822 | 0.1505718 | 0 |
| 2026 | 0.280456344 | 0.2356776 | 0.214466616 | 7 |
| 2027 | 0.35355175164 | 0.258066972 | 0.2193569262 | 18 |
| 2028 | 0.4342492937844 | 0.30580936182 | 0.290518893729 | 40 |
| 2029 | 0.547643405147256 | 0.3700293278022 | 0.210916716847254 | 69 |
| 2030 | 0.550603639769673 | 0.458836366474728 | 0.307420365538067 | 110 |
ALKIMI vs Stellar (XLM) Comparative Investment Analysis Report
I. Historical Price Comparison and Current Market Status
ALKIMI and XLM Historical Price Trends
ALKIMI (ALKIMI):
- All-time high: $0.1654 (August 20, 2025)
- All-time low: $0.01578 (November 27, 2025)
- Price decline from ATH to current level: approximately 88%
XLM (Stellar):
- All-time high: $0.875563 (January 3, 2018)
- All-time low: $0.00047612 (March 5, 2015)
- Historical price range: significantly wider than ALKIMI, reflecting its longer market history since 2014
Current Market Status (December 23, 2025)
| Metric | ALKIMI | Stellar (XLM) |
|---|---|---|
| Current Price | $0.01969 | $0.21825 |
| 24H Change | -0.75% | -0.02% |
| Market Cap | $5,870,950.90 | $10,912,889,989.18 |
| Circulating Supply | 298,169,167 | 32,373,452,460.00 |
| 24H Trading Volume | $20,892.22 | $3,054,738.88 |
| Market Ranking | #1449 | #23 |
| Market Dominance | 0.00061% | 0.34% |
Short-term Price Performance
7-Day Performance:
- ALKIMI: +22.15%
- XLM: +0.32%
30-Day Performance:
- ALKIMI: -19.96%
- XLM: -8.82%
1-Year Performance:
- ALKIMI: -94.48%
- XLM: -38.72%
Market Sentiment Index
Crypto Fear & Greed Index: 24 (Extreme Fear)
This extreme fear sentiment reflects overall market caution as of December 23, 2025.
II. Project Overview and Fundamentals
ALKIMI: On-Chain Digital Advertising Exchange
Founded: 2021
Core Mission: Eliminate opacity and excessive fees in the $750 billion digital advertising market through blockchain-based infrastructure.
Business Model:
- Protocol fees from every transaction flow directly to ALKIMI token holders
- Quarterly protocol fee growth: $46,000 (Q4 2023) → $260,000 (Q4 2024) → $510,000+ (2025)
- Revenue distributed to token holders represents 1,009%+ growth
Key Achievements:
- Over 2.5 billion transactions processed
- Strategic partnerships with Coca-Cola, Publicis, Kraken, IPG, and Fox
- Proven product-market fit with sustainable revenue model
Technical Infrastructure:
- Strategic migration to Sui blockchain
- Leverages Sui's high-performance infrastructure for minimal-cost transaction processing
- Designed to handle millions of daily advertising transactions
Stellar (XLM): Distributed Payment Network
Founded: 2014 by Jed McCaleb (former Ripple co-founder) and Joyce Kim
Core Mission: Provide open financial infrastructure for transparent and efficient savings and transactions while enhancing existing financial systems.
Technical Capabilities:
- Supports 1,000 transactions per second
- Transaction confirmation within 5 seconds
- Open-source code with maximum decentralization
- API connectivity via Horizon for JavaScript and Java integration
Network Purpose:
- Enables rapid, stable, and low-cost transfer of digital assets among banks, payment institutions, and individuals
- Facilitates cross-border transactions without high fees or slow procedures
- Supports creation, sending, and trading of digital representations of various currencies and cryptocurrencies
III. Supply Dynamics and Valuation
Token Supply Structure
| Parameter | ALKIMI | XLM |
|---|---|---|
| Total Supply | 1,000,000,000 | 50,001,786,892 |
| Circulating Supply | 298,169,167 (29.82%) | 32,373,452,460 (64.74%) |
| Max Supply | 1,000,000,000 | 50,001,786,892 |
| Fully Diluted Valuation | $19,690,000 | $10,912,889,989.18 |
| Market Cap/FDV Ratio | 29.82% | 64.74% |
Analysis:
- ALKIMI has substantial room for supply expansion with only ~30% of total supply in circulation
- XLM has ~65% of maximum supply already circulating, indicating more mature supply dynamics
- XLM's FDV significantly exceeds ALKIMI's, reflecting its larger ecosystem scale
IV. Investment Strategy Comparison: ALKIMI vs XLM
Long-term vs Short-term Investment Strategy
-
ALKIMI: Suitable for investors seeking exposure to emerging DeFi use cases and niche market opportunities. Best for those with high risk tolerance believing in the on-chain advertising thesis and willing to endure significant volatility in exchange for potential exponential returns.
-
XLM: Suitable for investors prioritizing payment infrastructure stability and seeking exposure to cross-border transaction networks. Best for those with moderate risk tolerance seeking relative stability and broad institutional adoption in the fintech sector.
Risk Management and Asset Allocation
Conservative Investors:
- ALKIMI: 5-10% | XLM: 90-95%
Aggressive Investors:
- ALKIMI: 40-60% | XLM: 40-60%
Hedging Instruments:
- Stablecoin allocation (15-25% in USDC/USDT) to mitigate extreme volatility
- Cross-asset diversification with major cryptocurrencies (BTC, ETH) for portfolio stabilization
- Consider time-weighted dollar-cost averaging for ALKIMI given price volatility
- XLM can serve as relative stability anchor within crypto portfolio
V. Potential Risk Comparison
Market Risk
-
ALKIMI: Extreme volatility (94.48% one-year decline, 88% from ATH to current level) creates substantial downside exposure. Concentrated holder base (2,691 addresses) increases susceptibility to significant price movements from coordinated selling. Limited trading volume relative to market cap amplifies slippage risk.
-
XLM: Moderate but persistent underperformance (38.72% one-year decline) reflects secular challenges in payment network adoption. Larger, more distributed holder base (10+ million addresses) provides greater price stability. Established market presence reduces extreme volatility risk.
Technology Risk
-
ALKIMI: Early-stage platform dependency on Sui blockchain migration success. Unproven scaling capacity at enterprise volumes. Revenue model sustainability contingent on continued brand partnership adoption in on-chain advertising adoption, which remains experimental and unproven at scale.
-
XLM: Mature network architecture with proven stability over 11-year operational history. However, technological innovation may lag emerging Layer 2 solutions and alternative payment networks. Potential obsolescence if payment infrastructure consolidates around competing protocols.
Regulatory Risk
-
ALKIMI: Minimal regulatory scrutiny due to nascent market position, but vulnerability to advertising industry regulations and potential securities law challenges depending on token utility classification across jurisdictions.
-
XLM: Exposed to broader financial services regulation given positioning as payment infrastructure. Regulatory clarity in certain jurisdictions (e.g., EU, US) could impose compliance costs or operational restrictions on network participants.
VI. Price Forecast Analysis: 2025-2030
ALKIMI Price Projections
| Year | Forecast High | Average Forecast | Forecast Low | Growth Rate |
|---|---|---|---|---|
| 2025 | $0.02186 | $0.01969 | $0.01792 | 0% |
| 2026 | $0.02327 | $0.02077 | $0.01994 | 5% |
| 2027 | $0.03171 | $0.02202 | $0.01167 | 11% |
| 2028 | $0.03170 | $0.02686 | $0.02042 | 36% |
| 2029 | $0.04041 | $0.02928 | $0.02020 | 48% |
| 2030 | $0.05122 | $0.03484 | $0.02753 | 76% |
XLM Price Projections
| Year | Forecast High | Average Forecast | Forecast Low | Growth Rate |
|---|---|---|---|---|
| 2025 | $0.25314 | $0.21822 | $0.15057 | 0% |
| 2026 | $0.28046 | $0.23568 | $0.21447 | 7% |
| 2027 | $0.35355 | $0.25807 | $0.21936 | 18% |
| 2028 | $0.43425 | $0.30581 | $0.29052 | 40% |
| 2029 | $0.54764 | $0.37003 | $0.21092 | 69% |
| 2030 | $0.55060 | $0.45884 | $0.30742 | 110% |
Forecast Analysis:
- ALKIMI shows gradual recovery trajectory with 76% cumulative growth by 2030 from 2025 baseline, contingent on successful ecosystem adoption acceleration
- XLM projects 110% cumulative growth by 2030, reflecting maturation of payment network infrastructure and potential institutional adoption expansion
- Both projections assume stabilization of current market fear conditions and gradual return to growth phase
VII. Conclusion: Which Is the Better Buy?
Investment Value Summary:
ALKIMI Strengths:
- Exceptional revenue growth trajectory (1,009%+ quarterly protocol fee increases)
- Niche market opportunity with $750 billion TAM in digital advertising
- Early-stage positioning with only 30% circulating supply offers expansion potential
- Proven partnerships with major brands (Coca-Cola, Publicis, Kraken, IPG, Fox)
- Recent 22.15% seven-day rebound amid market fear suggests potential accumulation phase
XLM Strengths:
- Established 11-year operational history with proven network stability
- Top-23 market capitalization position with broad institutional recognition
- Superior liquidity across 65 exchanges with 10+ million token holders
- Lower volatility profile relative to ALKIMI
- Demonstrated utility in cross-border payment infrastructure
Investment Recommendations:
Beginner Investors:
- Focus on XLM as primary position (70-80% allocation) for network stability and proven use case
- Minimal ALKIMI exposure (0-10%) given extreme volatility and speculative nature
- Maintain 20-30% stablecoin reserve for market opportunities
- Use dollar-cost averaging strategy to smooth entry points
Experienced Investors:
- Consider 40-60% ALKIMI allocation if thesis supports advertising DeFi adoption and brand partnership scaling
- Maintain 40-60% XLM position as portfolio stability anchor
- Deploy option strategies to hedge ALKIMI downside while maintaining upside participation
- Implement profit-taking targets at key resistance levels ($0.03+)
Institutional Investors:
- XLM represents lower-risk infrastructure play with scalable enterprise payment applications
- ALKIMI unsuitable for conservative institutional portfolios given limited liquidity (only $20,892 daily volume) and market cap concentration
- Consider XLM for payment infrastructure portfolios; evaluate ALKIMI only through venture capital framework with extended time horizon
⚠️ Risk Disclaimer
Cryptocurrency markets demonstrate extreme volatility and unpredictability. The Crypto Fear & Greed Index reading of 24 (Extreme Fear) as of December 23, 2025, indicates heightened market uncertainty. Historical price declines of 94.48% (ALKIMI) and 38.72% (XLM) demonstrate substantial downside risks. Price forecasts represent statistical modeling based on historical data and do not guarantee future results. This analysis is provided for informational purposes only and does not constitute investment advice, recommendations, or suggestions to buy, sell, or hold either asset. All cryptocurrency investments carry risk of total capital loss. Readers assume full responsibility for independent research and due diligence before engaging in any transactions. Consult qualified financial advisors for personalized guidance aligned with individual risk tolerance and investment objectives. None
ALKIMI vs Stellar (XLM): Frequently Asked Questions
FAQ
Q1: What are the key differences in market maturity between ALKIMI and XLM?
A: ALKIMI was established in 2021 as an early-stage on-chain digital advertising exchange, while Stellar (XLM) was founded in 2014 and has over 11 years of operational history. XLM ranks #23 by market capitalization with $10.9 billion market cap compared to ALKIMI's #1449 ranking with $5.9 million market cap. XLM is widely available on 65 exchanges with 10+ million token holders, whereas ALKIMI trades on only 4 exchanges with 2,691 holders. This reflects XLM's significantly more established and mature market position.
Q2: Which asset carries higher investment risk?
A: ALKIMI carries substantially higher risk due to multiple factors: 94.48% one-year price decline, 88% drawdown from all-time high, limited liquidity ($20,892 daily volume), concentrated holder base (2,691 addresses), and dependency on unproven on-chain advertising adoption. XLM exhibits moderate risk with 38.72% annual decline but offers relative stability through broader distribution, higher trading volume, and proven payment infrastructure. Current market conditions (Fear & Greed Index: 24 indicating Extreme Fear) amplify both assets' volatility.
Q3: How do the revenue models differ between ALKIMI and XLM?
A: ALKIMI operates an active revenue-sharing model where protocol fees from advertising transactions directly distribute to token holders, demonstrating 1,009%+ quarterly growth ($46,000 to $260,000 to $510,000+ progression). XLM employs a mature network fee structure supporting payment transactions but emphasizes infrastructure utility over direct token holder distributions. ALKIMI's model is speculative and growth-dependent, while XLM's approach prioritizes network stability and operational sustainability.
Q4: What supply dilution risks should investors consider?
A: ALKIMI presents higher supply dilution risk with only 29.82% of total supply in circulation (298 million of 1 billion tokens), meaning 70% remains unlocked for potential release. XLM has 64.74% of maximum supply circulating (32.4 billion of 50 billion tokens), indicating more mature distribution. ALKIMI's 70% circulating supply potential could significantly pressure token valuations if released without corresponding demand increases, whereas XLM's supply dynamics are relatively stabilized.
Q5: Which asset is more suitable for conservative investors?
A: XLM is substantially more appropriate for conservative investors seeking relative stability and proven infrastructure. With top-23 market ranking, 65-exchange liquidity, 10+ million token holders, and 11-year operational track record, XLM provides portfolio stability. ALKIMI's extreme volatility (-94.48% year-over-year), concentrated holder base, and speculative revenue model make it unsuitable for conservative portfolios. Conservative allocation recommendations suggest 90-95% XLM versus 5-10% ALKIMI maximum.
Q6: What are the long-term price forecast expectations for both assets through 2030?
A: ALKIMI price projections indicate gradual recovery from current $0.01969 baseline to estimated $0.03484 average by 2030 (76% cumulative growth), with high-case scenarios reaching $0.05122. XLM forecasts show stronger appreciation potential from $0.21825 baseline to estimated $0.45884 average by 2030 (110% cumulative growth), with optimistic scenarios reaching $0.55060. Both forecasts assume stabilization of current extreme fear conditions and assume successful ecosystem adoption acceleration. Forecasts carry substantial uncertainty and do not guarantee results.
Q7: How does liquidity availability affect practical investment in each asset?
A: XLM demonstrates significantly superior liquidity with $3,054,738.88 daily trading volume across 65 major exchanges, enabling efficient entry and exit at minimal slippage. ALKIMI's $20,892 daily volume across 4 exchanges creates substantial liquidity constraints, with potential for significant price impact on larger position entries or exits. This liquidity disparity makes XLM far more suitable for institutional investors and larger position sizes, while ALKIMI requires patient, methodical accumulation strategies to minimize market impact.
Q8: What ecosystem partnerships and adoption metrics support each project's investment thesis?
A: ALKIMI demonstrates proven product-market fit through strategic partnerships with Coca-Cola, Publicis, Kraken, IPG, and Fox, having processed 2.5+ billion advertising transactions with quarterly protocol fee growth acceleration to $510,000+ in 2025. XLM benefits from established enterprise payment infrastructure adoption across banking and fintech sectors with 1,000 transactions-per-second capacity and proven institutional use. ALKIMI's thesis depends on continued brand partnership expansion, while XLM's relies on sustained cross-border payment utilization and regulatory clarity in financial services.
Disclaimer: This analysis provides factual information as of December 23, 2025, for informational purposes only. It does not constitute investment advice, recommendations, or suggestions to buy, sell, or hold cryptocurrency assets. Cryptocurrency markets exhibit extreme volatility and unpredictability with potential for substantial financial losses. All investors assume full responsibility for independent research and due diligence before engaging in any transactions. Consult qualified financial advisors regarding personalized guidance aligned with individual risk tolerance and investment objectives.
Share
Content
Introduction: ALKIMI vs XLM Investment Comparison
I. Historical Price Comparison and Current Market Status
II. Project Overview and Fundamentals
III. Supply Dynamics and Valuation
IV. Trading Activity and Market Liquidity
V. Network and Ecosystem Development
VI. Risk Considerations
VII. Market Conditions and Investment Landscape
VIII. Summary Comparison Matrix
Disclaimer
Executive Summary
Key Findings
Data Limitations
Recommendation
III. 2025-2030 Price Forecast: ALKIMI vs XLM
I. Historical Price Comparison and Current Market Status
II. Project Overview and Fundamentals
III. Supply Dynamics and Valuation
IV. Investment Strategy Comparison: ALKIMI vs XLM
V. Potential Risk Comparison
VI. Price Forecast Analysis: 2025-2030
VII. Conclusion: Which Is the Better Buy?
⚠️ Risk Disclaimer
FAQ
How to Buy Cryptocurrency


Trending Cryptocurrencies


2025 PUNDIX Price Prediction: Will This Crypto Asset Reach New Heights in the DeFi Era?
Is Amp (AMP) a good investment?: Analyzing the potential and risks of this cryptocurrency token
2025 ACH Price Prediction: Expert Analysis and Market Outlook for Alchemy Pay Token
Is Wirex (WXT) a good investment?: A Comprehensive Analysis of Token Utility, Market Potential, and Risk Factors for 2024

Avalanche (AVAX) 2025 Price Analysis and Market Trends

SEI Staking Analysis: 60-70% Supply Locked and Its Price Impact
Ethereum (ETH) Mining Tutorial: Gate.com Platform Mining Guide and Earnings Comparison

MAVIA vs GMX: Comprehensive Comparison of Two Leading Decentralized Derivatives Trading Platforms

A straightforward guide for beginners to sell cryptocurrencies with ease

2025 GameFi In-Depth Overview: Current Landscape, Key Trends, and Investment Value Analysis
Understanding the MATIC to POL Migration: Insights for Crypto Investors