This comprehensive analysis compares ATR and DOGE, two distinctly positioned cryptocurrencies in the digital asset market. ATR, launched in 2022, operates as an art RWA marketplace with a Proof-of-Stake mechanism, while DOGE, since 2013, functions as an established digital asset with inflationary supply dynamics. The article examines historical price performance, tokenomics, institutional adoption rates, and technical ecosystems to guide investment decisions across different investor profiles. Current market data reveals DOGE demonstrates superior liquidity and price stability ($19.3M daily volume) compared to ATR ($90K volume), though both assets present distinct risk-reward profiles. Long-term price projections through 2031 suggest DOGE may reach $0.296, while ATR targets $0.0034 under optimistic scenarios. The analysis provides tailored allocation strategies for conservative, aggressive, and institutional investors, emphasizing risk management in today's volatile cryptocurrency landscape.
Introduction: ATR vs DOGE Investment Comparison
In the cryptocurrency market, the comparison between ATR vs DOGE has always been a topic that investors cannot avoid. The two not only have obvious differences in market cap ranking, application scenarios, and price performance, but also represent different crypto asset positioning.
ATR (Artrade): Launched in 2022, it has gained market recognition by positioning itself as the first marketplace for art RWA (real world assets).
DOGE (Dogecoin): Since its launch in 2013, it has been regarded as a fun and light-hearted cryptocurrency, and is one of the cryptocurrencies with high global trading volume and market capitalization.
This article will comprehensively analyze the investment value comparison of ATR vs DOGE around historical price trends, supply mechanisms, institutional adoption, technical ecosystems, and future predictions, and attempt to answer the question that investors are most concerned about:
"Which is the better buy right now?"
I. Historical Price Comparison and Current Market Status
Historical Price Trends of ATR (Coin A) and DOGE (Coin B)
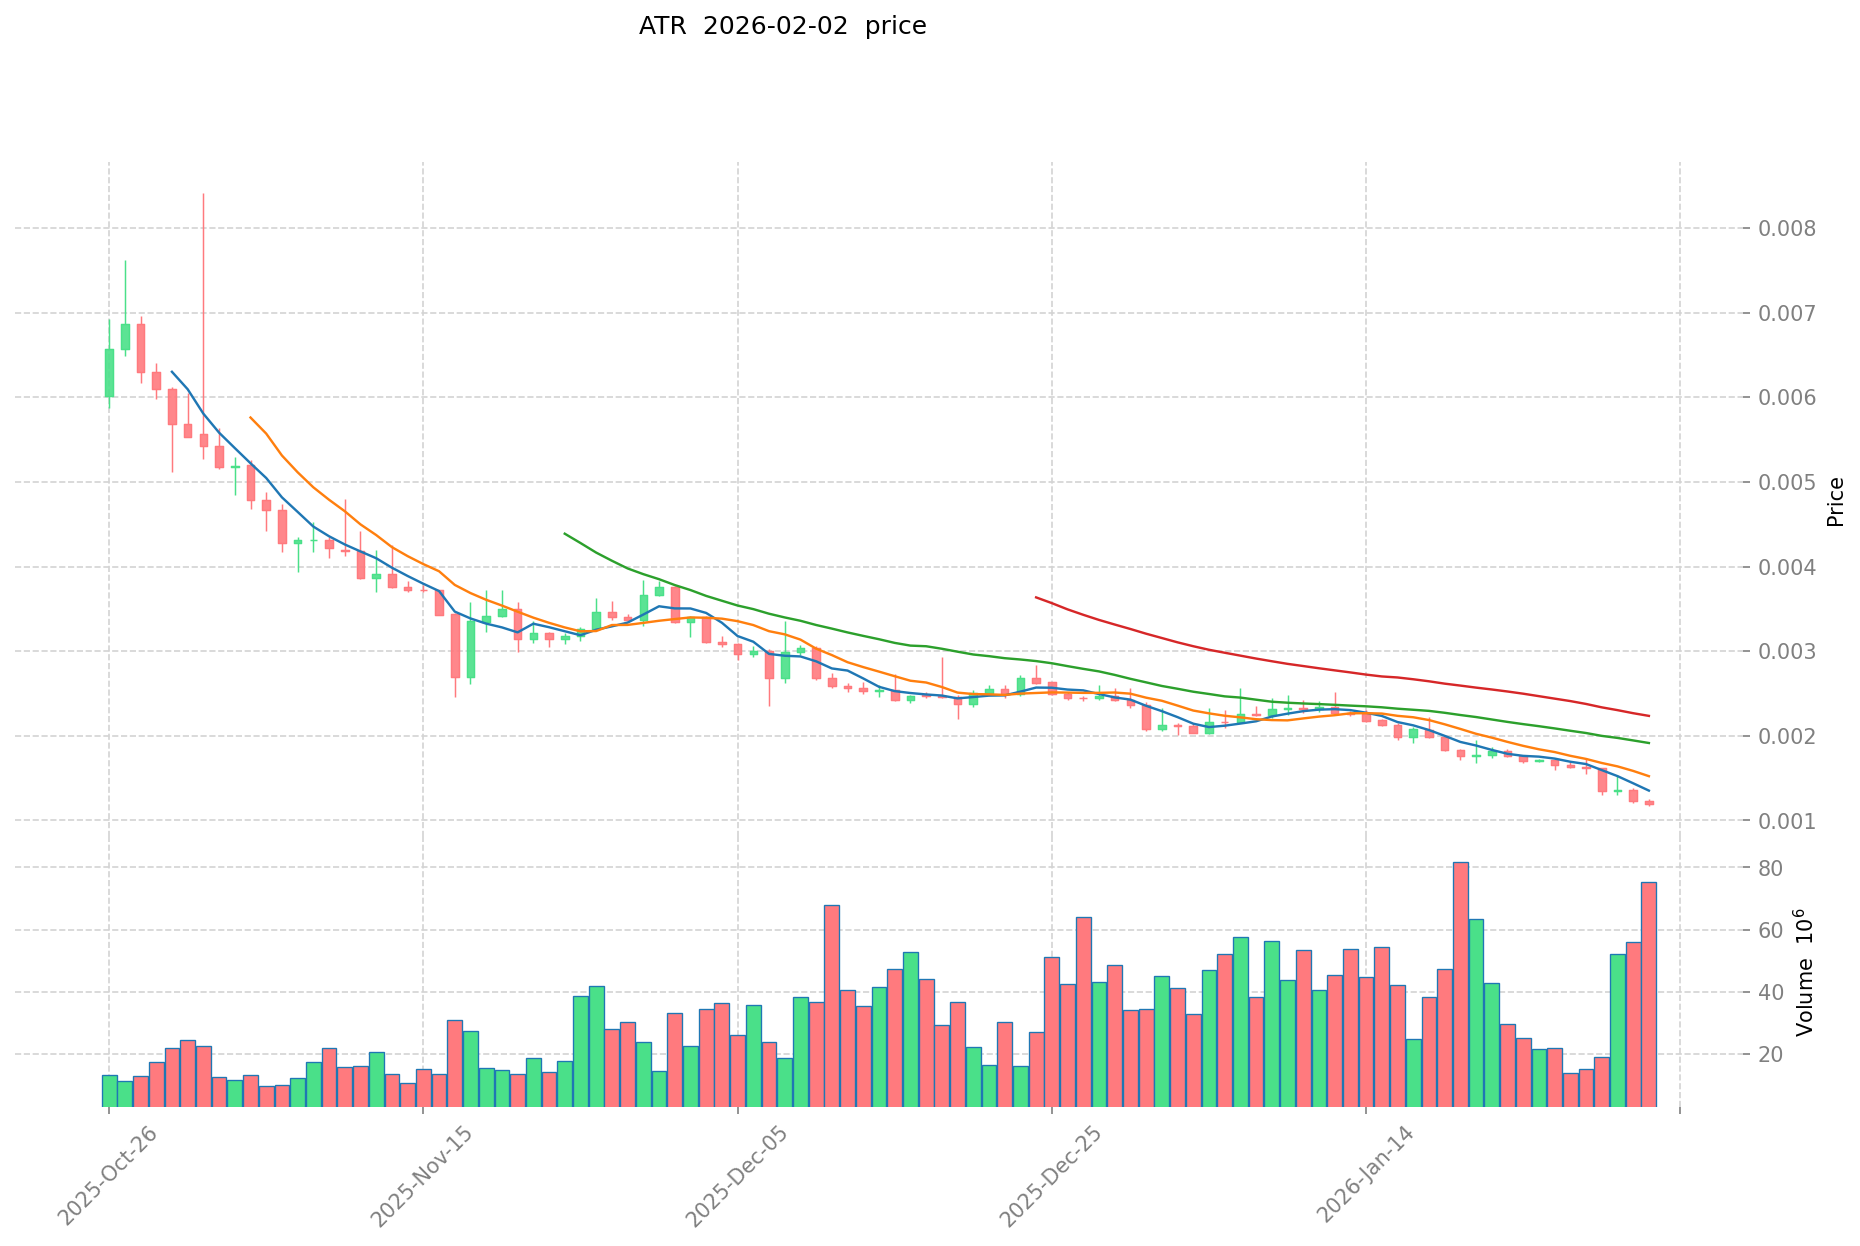
- 2024: ATR reached its historical high of $0.104 on April 3, 2024, but subsequently experienced significant price depreciation.
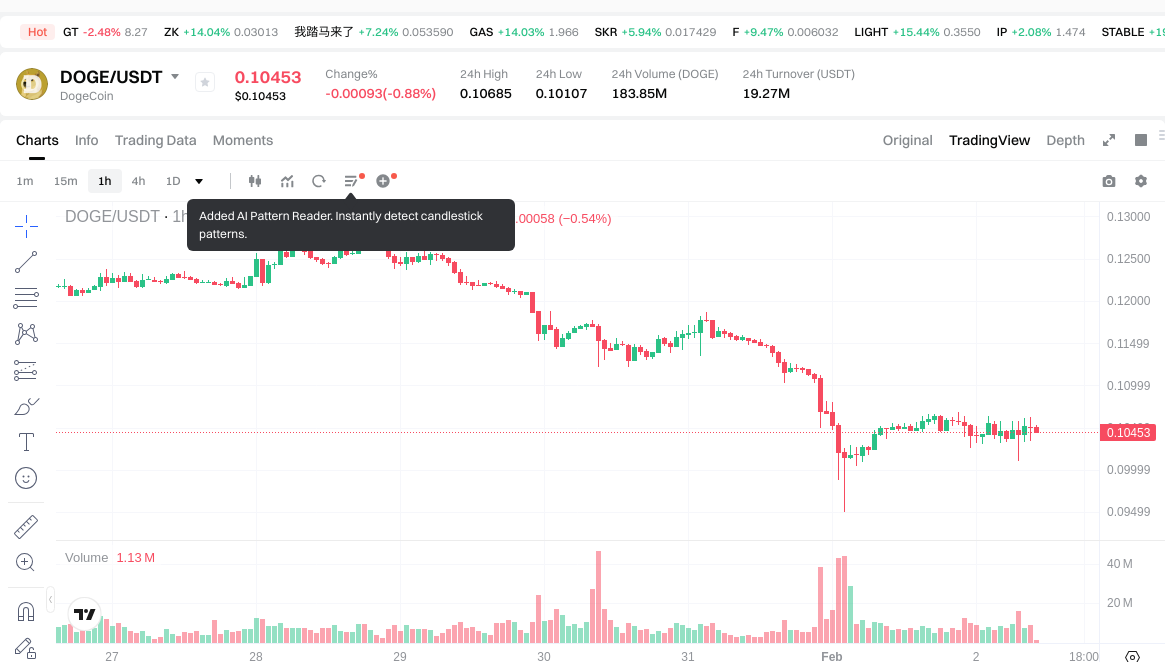
- 2021: DOGE achieved its all-time high of $0.731578 on May 8, 2021, driven by widespread social media attention and endorsements from prominent figures.
- Comparative Analysis: During the recent market cycle, ATR declined from $0.104 to its historical low of $0.001168 on February 1, 2026, representing a substantial decrease. In contrast, DOGE demonstrated relatively greater price stability, declining from its peak of $0.731578 to the current level of $0.10502.
Current Market Status (February 2, 2026)
- ATR Current Price: $0.001192
- DOGE Current Price: $0.10502
- 24-Hour Trading Volume: ATR recorded $90,084.45 compared to DOGE's $19,305,281.08
- Market Sentiment Index (Fear & Greed Index): 14 (Extreme Fear)
View real-time prices:
II. Core Factors Influencing ATR vs DOGE Investment Value
Supply Mechanism Comparison (Tokenomics)
- ATR: Employs a Proof-of-Stake (PoS) consensus mechanism, which differs from traditional Proof-of-Work systems in its approach to transaction validation and value storage.
- DOGE: Operates with an inflationary supply model without a hard cap, distinguishing it from deflationary cryptocurrencies.
- 📌 Historical Pattern: Supply mechanisms play a role in shaping market acceptance and price dynamics, though specific cyclical behaviors depend on broader market conditions.
Institutional Adoption and Market Applications
- Institutional Holdings: Institutional preference between these assets varies based on risk appetite and strategic positioning.
- Enterprise Adoption: Applications in cross-border payments, settlements, and portfolio diversification differ between ATR and DOGE, influenced by their respective technical characteristics and market positioning.
- Regulatory Environment: Different jurisdictions maintain varying regulatory stances toward digital assets, affecting adoption patterns.
Technical Development and Ecosystem Building
- ATR Technical Framework: Utilizes Proof-of-Stake consensus for facilitating decentralized transactions and value storage.
- DOGE Technical Characteristics: Market performance influenced by sentiment-driven factors and community engagement.
- Ecosystem Comparison: Applications span areas including decentralized finance, digital collectibles, payment systems, and programmable contracts, with varying degrees of implementation.
Macroeconomic Environment and Market Cycles
- Inflationary Context: Digital assets respond differently to economic conditions based on their underlying mechanisms and market perception.
- Macroeconomic Policies: Interest rate adjustments, currency index movements, and monetary policy shifts influence cryptocurrency valuations.
- Geopolitical Factors: Cross-border transaction demand and international developments contribute to market dynamics affecting both assets.
III. 2026-2031 Price Prediction: ATR vs DOGE
Short-term Forecast (2026)
- ATR: Conservative $0.00112048 - $0.001192 | Optimistic $0.001192 - $0.0017284
- DOGE: Conservative $0.0952042 - $0.10462 | Optimistic $0.10462 - $0.1454218
Mid-term Forecast (2028-2029)
- ATR may enter a consolidation phase with projected price range of $0.001353079728 - $0.0017347176, showing gradual growth momentum
- DOGE may enter an expansion phase with projected price range of $0.088764839 - $0.2124207608138, potentially benefiting from broader market developments
- Key drivers: institutional capital inflows, ETF developments, ecosystem expansion
Long-term Forecast (2030-2031)
- ATR: Baseline scenario $0.00127076737788 - $0.002660221564 | Optimistic scenario $0.002353272922 - $0.0034122457369
- DOGE: Baseline scenario $0.160279496751858 - $0.296028411988645 | Optimistic scenario $0.227714163068188 - $0.296028411988645
View detailed price predictions for ATR and DOGE
Disclaimer
ATR:
| Year |
Predicted High Price |
Predicted Average Price |
Predicted Low Price |
Price Change |
| 2026 |
0.0017284 |
0.001192 |
0.00112048 |
0 |
| 2027 |
0.00175224 |
0.0014602 |
0.001226568 |
21 |
| 2028 |
0.0017347176 |
0.00160622 |
0.001445598 |
33 |
| 2029 |
0.00242217976 |
0.0016704688 |
0.001353079728 |
39 |
| 2030 |
0.002660221564 |
0.00204632428 |
0.0016779859096 |
70 |
| 2031 |
0.0034122457369 |
0.002353272922 |
0.00127076737788 |
96 |
DOGE:
| Year |
Predicted High Price |
Predicted Average Price |
Predicted Low Price |
Price Change |
| 2026 |
0.1454218 |
0.10462 |
0.0952042 |
0 |
| 2027 |
0.177529678 |
0.1250209 |
0.088764839 |
19 |
| 2028 |
0.20573439304 |
0.151275289 |
0.10286719652 |
44 |
| 2029 |
0.2124207608138 |
0.17850484102 |
0.1374487275854 |
69 |
| 2030 |
0.259965525219477 |
0.1954628009169 |
0.160279496751858 |
86 |
| 2031 |
0.296028411988645 |
0.227714163068188 |
0.177617047193187 |
116 |
IV. Investment Strategy Comparison: ATR vs DOGE
Long-term vs Short-term Investment Strategies
- ATR: May appeal to investors interested in niche market segments and higher risk-reward profiles, with focus on specific use case development
- DOGE: May suit investors seeking exposure to established digital assets with broader market recognition and community engagement
Risk Management and Asset Allocation
- Conservative Investors: ATR 10-15% vs DOGE 20-30%
- Aggressive Investors: ATR 25-35% vs DOGE 40-50%
- Hedging Tools: Stablecoin allocation, options strategies, cross-asset portfolio diversification
V. Potential Risk Comparison
Market Risk
- ATR: Price volatility influenced by lower trading volumes and market liquidity constraints, with significant downside movements observed historically
- DOGE: Market sentiment sensitivity and correlation with broader cryptocurrency market cycles, though demonstrates relatively higher liquidity
Technical Risk
- ATR: Scalability considerations and network adoption metrics
- DOGE: Network maintenance dynamics and technical infrastructure evolution
Regulatory Risk
- Varying regulatory approaches across jurisdictions may impact both assets differently based on their classification, use cases, and market positioning
VI. Conclusion: Which Is the Better Buy?
📌 Investment Value Summary:
- ATR Characteristics: Positioning in specialized market segments, higher volatility profile, early-stage development trajectory
- DOGE Characteristics: Established market presence, broader community base, higher trading liquidity, greater price stability relative to ATR
✅ Investment Considerations:
- Novice Investors: Consider starting with assets demonstrating higher liquidity and established market presence, with emphasis on risk management and portfolio diversification
- Experienced Investors: May evaluate both assets based on individual risk tolerance, portfolio objectives, and market analysis, considering allocation strategies aligned with investment horizons
- Institutional Investors: Assessment based on regulatory compliance requirements, liquidity needs, custody solutions, and strategic positioning within broader digital asset frameworks
⚠️ Risk Disclosure: Cryptocurrency markets exhibit high volatility. This content does not constitute investment advice.
VII. FAQ
Q1: What are the main differences between ATR and DOGE in terms of supply mechanism?
ATR utilizes a Proof-of-Stake (PoS) consensus mechanism, while DOGE operates with an inflationary supply model without a hard cap. ATR's PoS system differs fundamentally from traditional Proof-of-Work approaches in transaction validation and value storage, potentially offering energy efficiency advantages. In contrast, DOGE's unlimited supply model creates continuous token issuance, distinguishing it from deflationary cryptocurrencies like Bitcoin. This fundamental difference significantly impacts long-term price dynamics and scarcity perception among investors.
Q2: Which cryptocurrency shows better price stability based on historical performance?
DOGE demonstrates relatively greater price stability compared to ATR. While DOGE declined from its all-time high of $0.731578 (May 2021) to the current level of $0.10502, ATR experienced a more substantial decrease from $0.104 (April 2024) to its historical low of $0.001168 (February 2026). The 24-hour trading volume comparison further illustrates this disparity, with DOGE recording $19,305,281.08 versus ATR's $90,084.45, indicating significantly higher liquidity and market depth for DOGE.
Q3: What is the projected price outlook for ATR and DOGE through 2031?
For ATR: Short-term (2026) projections range from $0.00112048 to $0.0017284, with long-term estimates (2031) reaching $0.00127076737788 to $0.0034122457369 under optimistic scenarios.
For DOGE: Short-term (2026) projections range from $0.0952042 to $0.1454218, with long-term estimates (2031) extending from $0.177617047193187 to $0.296028411988645.
DOGE's projected price appreciation appears more substantial, with an estimated 116% increase by 2031, compared to ATR's projected 96% growth over the same period. However, these forecasts depend heavily on market conditions, institutional adoption rates, and ecosystem development progress.
Q4: How should different investor types approach ATR vs DOGE allocation?
Conservative investors: Consider allocating 10-15% to ATR and 20-30% to DOGE within cryptocurrency portfolios.
Aggressive investors: May allocate 25-35% to ATR and 40-50% to DOGE for higher risk-reward exposure.
Novice investors should prioritize assets with higher liquidity and established market presence, making DOGE potentially more suitable for beginners. Experienced investors may evaluate both assets based on individual risk tolerance and portfolio objectives, while institutional investors should assess regulatory compliance requirements, custody solutions, and strategic positioning within broader digital asset frameworks before allocation decisions.
Q5: What are the primary risk factors differentiating ATR from DOGE?
ATR faces higher market risk due to lower trading volumes ($90,084.45 vs DOGE's $19,305,281.08) and liquidity constraints, resulting in potentially more severe price volatility. DOGE, while demonstrating greater liquidity, remains highly sensitive to market sentiment and social media influence. Technical risks differ as well, with ATR focusing on scalability and network adoption metrics in its early development stage, whereas DOGE centers on network maintenance dynamics and infrastructure evolution. Both assets face regulatory uncertainty, though impacts may vary based on their classification and use cases across different jurisdictions.
Q6: Which asset better serves as a long-term investment versus short-term trading opportunity?
DOGE may better suit long-term investment strategies due to its established market presence, broader community base, and relatively higher price stability. Its $0.10502 current price and consistent trading volume indicate sustained market interest. ATR, positioned in specialized market segments with higher volatility, may appeal more to short-term traders seeking higher risk-reward profiles and investors interested in early-stage project exposure. However, ATR's significantly lower liquidity ($90,084.45 daily volume) presents execution challenges for both entry and exit strategies, particularly for larger position sizes.
Q7: How does the current market sentiment impact ATR vs DOGE investment decisions?
As of February 2, 2026, the Fear & Greed Index registers at 14 (Extreme Fear), indicating widespread market pessimism. In such conditions, DOGE's established position and higher liquidity provide relatively better downside protection and exit flexibility compared to ATR. Historical patterns suggest that during extreme fear periods, assets with lower liquidity like ATR experience disproportionately larger price declines. Conversely, market recovery phases may present opportunities for both assets, with ATR potentially offering higher percentage gains due to its smaller market capitalization, though accompanied by substantially elevated risk levels.
Q8: What role do institutional adoption and ecosystem development play in ATR vs DOGE valuation?
Institutional adoption patterns significantly diverge between these assets. DOGE benefits from broader recognition, established payment infrastructure integration, and higher institutional comfort levels due to its longer operational history since 2013. ATR, launched in 2022 with positioning as an art RWA marketplace, targets a more specialized institutional segment focused on tokenized real-world assets. Ecosystem development timelines differ accordingly: DOGE's mature infrastructure supports immediate implementation, while ATR's ecosystem remains in earlier development stages. These factors contribute to DOGE's current price premium and may influence medium-term (2028-2029) performance trajectories as outlined in the comparative forecasts.
⚠️ Risk Disclosure: Cryptocurrency investments carry substantial risk. This content provides analytical comparison and does not constitute financial advice. Conduct thorough research and consult qualified financial advisors before making investment decisions.
* The information is not intended to be and does not constitute financial advice or any other recommendation of any sort offered or endorsed by Gate.