BILLY vs DOT: The Ultimate Showdown Between Two Revolutionary Digital Assistants


Introduction: Investment Comparison Between BILLY and DOT
In the cryptocurrency market, the comparison between BILLY vs DOT has become a topic that investors cannot avoid. The two differ significantly in market cap ranking, application scenarios, and price performance, representing different crypto asset positioning.
BILLY (BILLY): Launched in June 2024, it has gained market attention with its positioning as the cutest dog on Solana. Currently ranked 2,980 with a market cap of $536,500.
Polkadot (DOT): Launched in May 2019, it has been recognized for its multi-chain interoperability solution, enabling seamless information and transaction exchange across independent blockchains. Currently ranked 39 with a market cap of approximately $2.38 billion.
This article will provide a comprehensive analysis of BILLY vs DOT investment value comparison around historical price trends, supply mechanisms, technical ecosystems, and future predictions, attempting to answer the question investors care about most:
"Which is the better buy right now?"
I. Historical Price Comparison and Current Market Status
BILLY and DOT Historical Price Trends
- 2024: BILLY reached a notable price level of $0.2858 in July, representing a significant milestone for this Solana-based meme token during a period of elevated market activity.
- 2021: DOT achieved its all-time high of $54.98 in November, driven by growing interest in cross-chain interoperability solutions and Polkadot's parachain auction mechanism.
- Comparative Analysis: Throughout the 2024-2026 market cycle, BILLY declined from $0.2858 to $0.0005365, while DOT decreased from its 2021 peak of $54.98 to the current price of $1.43, with both assets experiencing substantial corrections from their respective highs.
Current Market Status (2026-02-05)
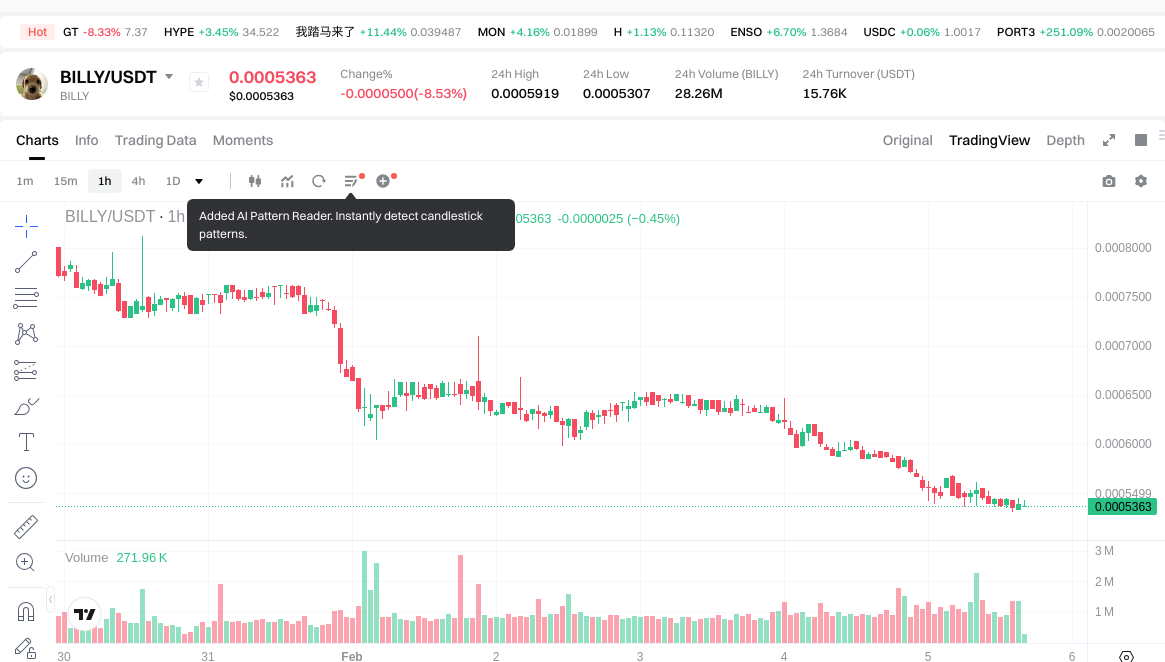
- BILLY Current Price: $0.0005365
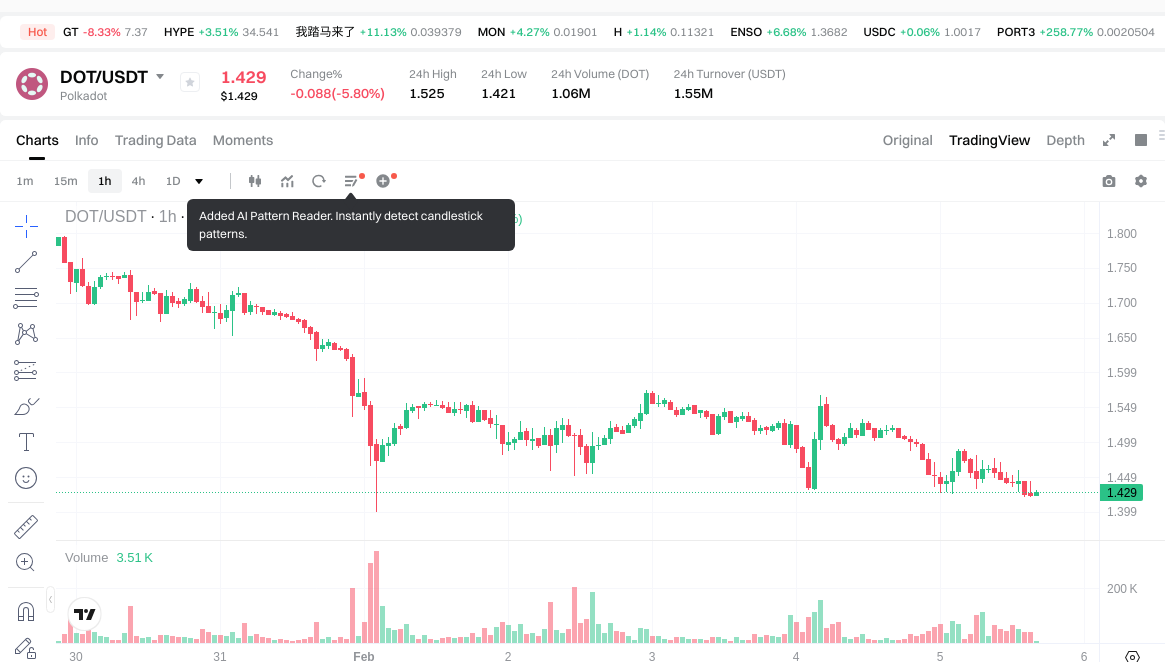
- DOT Current Price: $1.43
- 24-Hour Trading Volume: BILLY $15,742.91 vs DOT $1,554,896.93
- Market Sentiment Index (Fear & Greed Index): 12 (Extreme Fear)
View real-time prices:
- Check BILLY current price Market Price
- Check DOT current price Market Price
II. Core Factors Influencing BILLY vs DOT Investment Value
Supply Mechanism Comparison (Tokenomics)
Based on available market dynamics, investment value in cryptocurrency assets is primarily driven by supply and demand fundamentals in global markets. Interest rate policies set by central banks can significantly influence investment behavior, as rate adjustments alter capital flows and risk appetite across different asset classes. Additionally, inflation rates play a role in currency valuation, with lower inflation environments typically supporting better value preservation.
For BILLY and DOT specifically, the reference materials do not provide detailed information about their respective supply mechanisms, token distribution models, or whether they employ fixed supply, deflationary mechanisms, or halving events. Without concrete data on tokenomics structures, it would be inappropriate to make comparative statements about how their supply mechanisms might drive price cycles.
Institutional Adoption and Market Application
The provided materials do not contain specific information regarding institutional holdings, corporate adoption rates, or comparative analysis of BILLY versus DOT in cross-border payments, settlement systems, or institutional investment portfolios. Similarly, there is no available data on regulatory attitudes or policy frameworks that different jurisdictions have adopted specifically toward these two assets.
Technology Development and Ecosystem Building
The reference materials do not include information about technology upgrades, development roadmaps, or technical improvements for either BILLY or DOT. Consequently, there is insufficient data to compare their respective ecosystems in terms of DeFi integration, NFT platforms, payment infrastructure, or smart contract deployment and adoption rates.
Macroeconomic Factors and Market Cycles
General market principles suggest that macroeconomic conditions can influence cryptocurrency valuations. Factors such as inflation environments, monetary policy decisions including interest rate adjustments, and the strength of the U.S. dollar may affect digital asset performance. Geopolitical developments and cross-border transaction demands can also create varying market conditions.
However, the provided materials do not contain specific comparative analysis of how BILLY versus DOT perform under different macroeconomic scenarios, their relative inflation-hedging characteristics, or their sensitivity to monetary policy changes and geopolitical events.
III. 2026-2031 Price Prediction: BILLY vs DOT
Short-term Prediction (2026)
- BILLY: Conservative $0.000304 - $0.0005429 | Optimistic $0.0005429 - $0.000646
- DOT: Conservative $1.31468 - $1.429 | Optimistic $1.429 - $1.90057
Mid-term Prediction (2028-2029)
- BILLY may enter a growth phase, with estimated price range of $0.00048 - $0.00118
- DOT may enter a consolidation phase, with estimated price range of $1.11 - $2.67
- Key drivers: institutional capital inflows, ETF developments, ecosystem expansion
Long-term Prediction (2030-2031)
- BILLY: Baseline scenario $0.000815 - $0.001006 | Optimistic scenario $0.001006 - $0.001421
- DOT: Baseline scenario $1.95 - $2.35 | Optimistic scenario $2.35 - $3.66
Disclaimer
BILLY:
| Year | Predicted High Price | Predicted Average Price | Predicted Low Price | Price Change |
|---|---|---|---|---|
| 2026 | 0.000646051 | 0.0005429 | 0.000304024 | 1 |
| 2027 | 0.00079659717 | 0.0005944755 | 0.000576641235 | 10 |
| 2028 | 0.0009598401423 | 0.000695536335 | 0.00047992007115 | 29 |
| 2029 | 0.001183594181269 | 0.00082768823865 | 0.000504889825576 | 54 |
| 2030 | 0.001196713039852 | 0.001005641209959 | 0.000814569380067 | 87 |
| 2031 | 0.001420518491128 | 0.001101177124906 | 0.001057130039909 | 105 |
DOT:
| Year | Predicted High Price | Predicted Average Price | Predicted Low Price | Price Change |
|---|---|---|---|---|
| 2026 | 1.90057 | 1.429 | 1.31468 | 0 |
| 2027 | 1.9644463 | 1.664785 | 1.61484145 | 16 |
| 2028 | 2.2319772495 | 1.81461565 | 1.1069155465 | 26 |
| 2029 | 2.67075131367 | 2.02329644975 | 1.45677344382 | 41 |
| 2030 | 3.0746012850401 | 2.34702388171 | 1.9480298218193 | 64 |
| 2031 | 3.659596987556317 | 2.71081258337505 | 1.978893185863786 | 89 |
IV. Investment Strategy Comparison: BILLY vs DOT
Long-term vs Short-term Investment Strategies
- BILLY: May appeal to investors with higher risk tolerance seeking speculative opportunities in emerging meme tokens within the Solana ecosystem, though its substantial price decline from historical levels suggests elevated volatility.
- DOT: May suit investors interested in multi-chain interoperability infrastructure and cross-chain technology development, with established market presence since 2019.
Risk Management and Asset Allocation
- Conservative Investors: BILLY 5-10% vs DOT 90-95%
- Aggressive Investors: BILLY 20-30% vs DOT 70-80%
- Hedging Tools: stablecoin allocation, options strategies, cross-asset portfolio diversification
V. Potential Risk Comparison
Market Risk
- BILLY: Significant price volatility with a decline from $0.2858 to $0.0005365, relatively low trading volume of $15,742.91 indicating limited liquidity, ranked 2,980 with a market cap of $536,500 suggesting higher exposure to market sentiment shifts.
- DOT: Price correction from $54.98 to $1.43 reflecting broader market downturns, ranked 39 with approximately $2.38 billion market cap, 24-hour trading volume of $1,554,896.93 indicating relatively better liquidity compared to smaller market cap assets.
Technical Risk
- BILLY: The reference materials do not provide specific information regarding scalability challenges, network stability concerns, or technical infrastructure vulnerabilities for BILLY.
- DOT: The reference materials do not contain detailed analysis of computational power distribution, security vulnerabilities, or technical implementation risks specific to DOT's cross-chain architecture.
Regulatory Risk
The provided materials do not include comparative analysis of how different global regulatory frameworks might impact BILLY versus DOT specifically. Regulatory developments in various jurisdictions can affect cryptocurrency assets differently based on their classification, use cases, and market positioning, though specific policy implications for these two assets are not detailed in the available information.
VI. Conclusion: Which Is the Better Buy?
📌 Investment Value Summary:
- BILLY Characteristics: Launched in June 2024 as a Solana-based meme token, currently experiencing substantial price correction from July 2024 levels, with limited trading volume and lower market cap positioning at rank 2,980.
- DOT Characteristics: Established since May 2019 with focus on multi-chain interoperability solutions, ranked 39 with approximately $2.38 billion market cap, though also experiencing significant price decline from 2021 levels.
✅ Investment Considerations:
- Novice Investors: Consider prioritizing established assets with greater liquidity and market depth, maintain diversified portfolios including stablecoin allocations, and invest only amounts affordable to lose given current market conditions reflected in the Fear & Greed Index of 12 (Extreme Fear).
- Experienced Investors: Evaluate both assets within broader portfolio context considering risk tolerance, market cycle positioning, and individual investment timeframes, while implementing appropriate risk management strategies.
- Institutional Investors: Conduct comprehensive due diligence including liquidity analysis, regulatory compliance assessment, and alignment with institutional investment mandates before considering allocation to either asset.
⚠️ Risk Warning: Cryptocurrency markets exhibit high volatility. This content does not constitute investment advice.
VII. FAQ
Q1: What are the key differences between BILLY and DOT in terms of market positioning?
BILLY is a meme token launched in June 2024 on the Solana blockchain, currently ranked 2,980 with a market cap of $536,500, while DOT is an established cross-chain interoperability platform launched in May 2019, ranked 39 with approximately $2.38 billion market cap. BILLY represents a speculative, community-driven asset with limited liquidity ($15,742.91 in 24-hour volume), whereas DOT focuses on multi-chain infrastructure enabling seamless blockchain communication with significantly higher trading volume ($1,554,896.93 in 24 hours). The fundamental difference lies in their use cases: BILLY serves primarily as a meme token within the Solana ecosystem, while DOT provides technical infrastructure for cross-chain transactions and information exchange across independent blockchains.
Q2: How have BILLY and DOT performed historically from their respective peaks?
Both assets have experienced substantial corrections from their historical highs, though at different scales and timeframes. BILLY declined from $0.2858 in July 2024 to the current price of $0.0005365, representing approximately an 81% decrease within less than two years. DOT decreased from its all-time high of $54.98 in November 2021 to the current price of $1.43, reflecting approximately a 97% correction over a longer four-year period. These price movements occurred during different market cycles, with DOT's decline spanning multiple crypto market phases since 2021, while BILLY's correction reflects more recent market conditions following its mid-2024 launch.
Q3: What are the price predictions for BILLY vs DOT through 2031?
For 2026, BILLY is predicted to range between $0.000304 - $0.000646 (conservative to optimistic scenarios), while DOT is forecasted at $1.31468 - $1.90057. By 2028-2029, BILLY may reach $0.00048 - $0.00118, and DOT could trade between $1.11 - $2.67. Long-term predictions for 2030-2031 suggest BILLY might achieve $0.000815 - $0.001421, while DOT could range from $1.95 - $3.66. These projections indicate different growth trajectories, with BILLY showing potential percentage gains from lower base levels, though absolute dollar values remain substantially different. However, these predictions should be viewed as estimates subject to significant market variables and technological developments.
Q4: What type of investors might consider BILLY versus DOT?
BILLY may appeal to investors with higher risk tolerance seeking speculative opportunities in emerging meme tokens, though its substantial price decline and limited liquidity suggest elevated volatility risks. DOT may suit investors interested in established blockchain infrastructure and cross-chain technology development, offering greater market depth and liquidity. Conservative investors might consider minimal BILLY allocation (5-10%) balanced with higher DOT exposure (90-95%), while aggressive investors could potentially allocate 20-30% to BILLY and 70-80% to DOT within cryptocurrency portfolios. Institutional investors would likely require comprehensive due diligence on liquidity, regulatory compliance, and alignment with investment mandates before considering either asset.
Q5: What are the primary risks associated with investing in BILLY versus DOT?
BILLY faces significant market risk due to extreme price volatility, limited trading volume ($15,742.91), and lower market cap positioning (rank 2,980 with $536,500 market cap), making it highly susceptible to market sentiment shifts and liquidity constraints. DOT, while experiencing substantial price correction from 2021 highs, maintains better liquidity with $1,554,896.93 in 24-hour trading volume and higher market cap (approximately $2.38 billion), though it remains exposed to broader cryptocurrency market downturns. Both assets face regulatory uncertainty as global frameworks continue evolving, and the current market sentiment index of 12 (Extreme Fear) reflects challenging conditions affecting all cryptocurrency investments. Investors should only allocate funds they can afford to lose completely.
Q6: How do trading volumes compare between BILLY and DOT?
DOT demonstrates significantly higher trading volume with $1,554,896.93 in 24-hour volume compared to BILLY's $15,742.91, representing approximately a 99-fold difference. This substantial liquidity gap indicates that DOT offers greater ease of entry and exit for investors, potentially resulting in tighter bid-ask spreads and reduced slippage during trades. BILLY's limited trading volume suggests lower market participation and higher vulnerability to price manipulation or significant price swings from relatively small transactions. For institutional investors or those managing larger position sizes, DOT's superior liquidity provides more practical execution capabilities, while BILLY's thin trading volume may present challenges for meaningful position building or liquidation without significant market impact.
Q7: What factors should be considered when comparing BILLY vs DOT for portfolio allocation?
Key considerations include risk tolerance, investment timeframe, and portfolio diversification objectives. BILLY's characteristics as a recently launched meme token with high volatility and limited liquidity make it suitable only for small speculative allocations within diversified portfolios, while DOT's established infrastructure focus and greater market depth may justify larger allocations for investors seeking blockchain technology exposure. Current market conditions reflected in the Fear & Greed Index of 12 (Extreme Fear) suggest cautious positioning across all cryptocurrency assets. Additionally, investors should evaluate their ability to withstand potential further price declines, as both assets have experienced substantial corrections from previous highs. Proper risk management includes maintaining stablecoin allocations, implementing appropriate position sizing, and avoiding concentration risk in any single cryptocurrency asset regardless of its market positioning.
Share
Content
Introduction: Investment Comparison Between BILLY and DOT
I. Historical Price Comparison and Current Market Status
II. Core Factors Influencing BILLY vs DOT Investment Value
III. 2026-2031 Price Prediction: BILLY vs DOT
IV. Investment Strategy Comparison: BILLY vs DOT
V. Potential Risk Comparison
VI. Conclusion: Which Is the Better Buy?
VII. FAQ
How to Buy Cryptocurrency


Trending Cryptocurrencies


2025 SUI coin: price, buying guide, and Staking rewards

How to Buy Crypto: A Step-by-Step Guide with Gate.com

HNT Price in 2025: Helium Network Token Value and Market Analysis

What is SwissCheese (SWCH) and How Does It Democratize Investment?

Cardano (ADA) Price Analysis and Outlook for 2025
How to Invest in Metaverse Crypto

How will PI Network price fluctuate by 2030: volatility analysis and support resistance levels
How Does Federal Reserve Policy and Inflation Impact Cryptocurrency Price Movements in 2026

What is Access Protocol (ACS) Market Cap, Price, and Trading Volume in 2026

How does macroeconomic policy impact HBAR crypto price movements in 2026?
What Is a Physical Bitcoin and What Is Its Worth?