Cardano (ADA) Price Forecast 2025/2026/2035
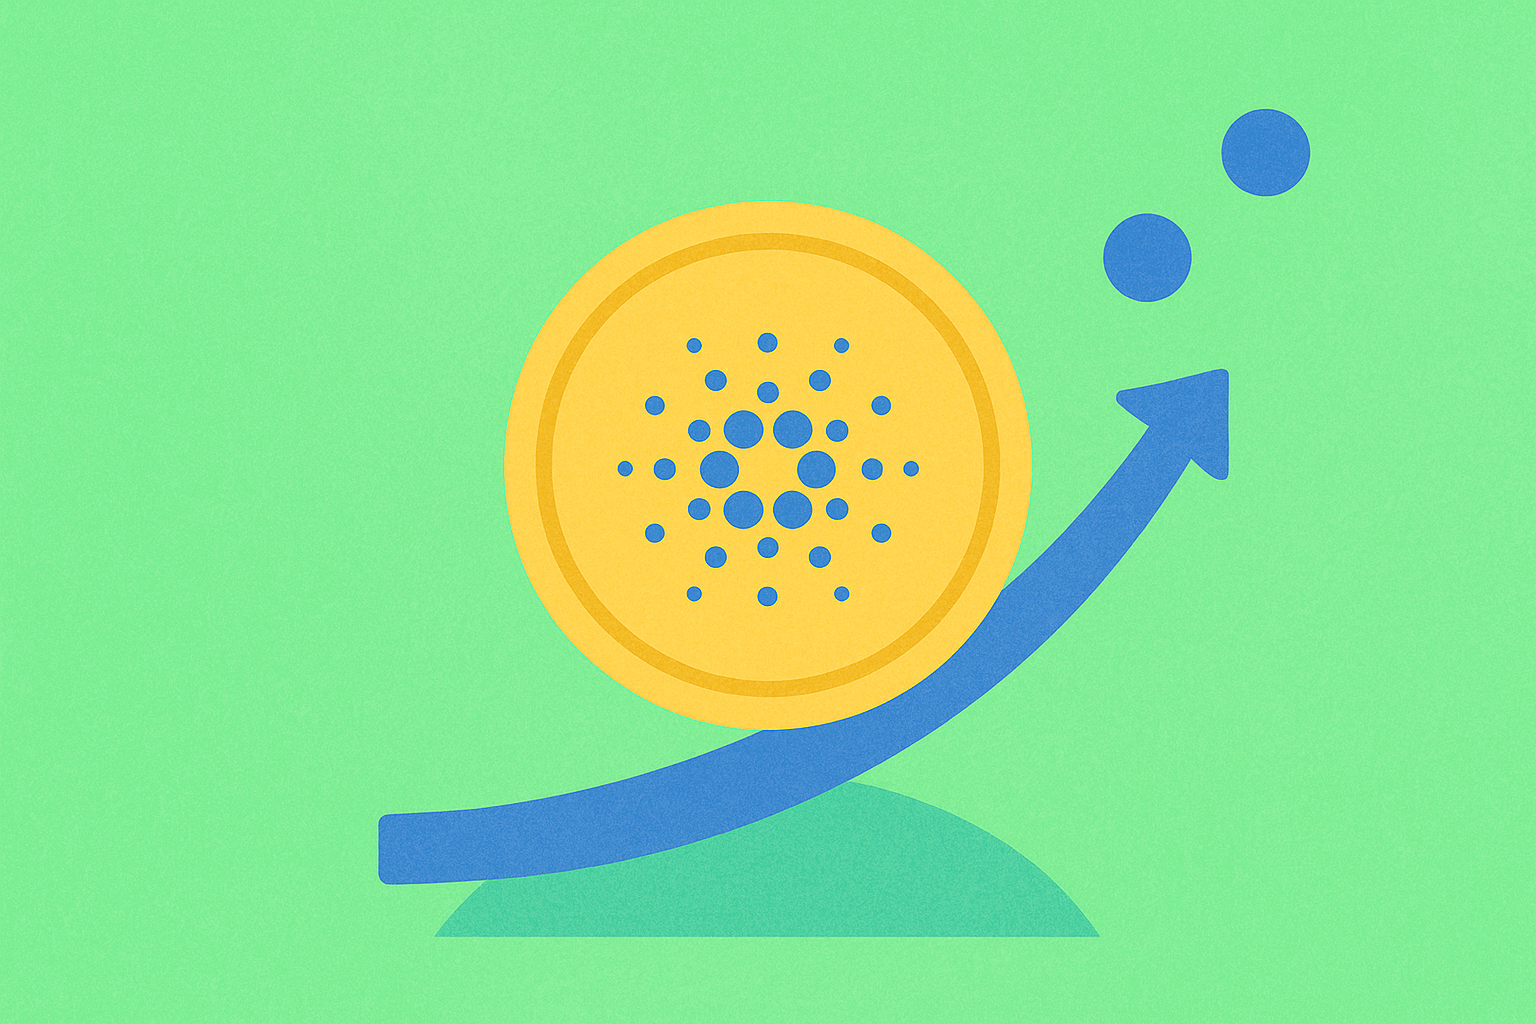
Cardano: Overview and Market Position
Cardano (ADA) is a blockchain project with a prominent standing in the cryptocurrency market. Recent data shows ADA trading near $0.96, with 24-hour volume around $2,689,916,027 and a market capitalization of approximately $36,895,848,050—ranking 9th by total crypto market cap.
This position marks a significant rise from $0.675 at the end of 2023, reflecting increased investor optimism about Cardano’s ecosystem. Thanks to its innovative technical architecture and sustainable development model, Cardano has established a distinct competitive edge within the blockchain sector.
Cardano Fundamentals: Factors Driving ADA Price Forecasts
Founded by Charles Hoskinson, Cardano is widely regarded as one of the most technologically advanced blockchains. Its robust network foundation and rich feature set are key drivers behind long-term price growth.
Technical Features and Advantages
Cardano’s technological strengths include the following core elements:
-
Layered Architecture: Cardano employs a unique dual-layer structure, separating the Cardano Settlement Layer (CSL) from the Cardano Computation Layer (CCL). This design enables flexible transaction processing, enhancing scalability and security across the system.
-
Ouroboros Consensus Mechanism: Cardano utilizes Ouroboros, an academically validated and energy-efficient Proof of Stake (PoS) protocol. Compared to traditional Proof of Work (PoW), Ouroboros drastically lowers energy consumption while maintaining high levels of security.
-
Staking Capability: ADA holders can stake their tokens to help secure the network and earn rewards. Stakers also gain rights to participate in on-chain governance, influencing the protocol’s future direction.
-
Developer Ecosystem: Cardano provides extensive resources and tooling for DApp (decentralized application) and smart contract development—including the Plutus programming language and Marlowe. These dedicated tools enable developers to build secure and efficient applications.
-
Interoperable Ecosystem: Regular technical upgrades strengthen Cardano’s interoperability, enabling cross-chain transactions and data exchanges. This boosts the ecosystem’s overall value.
Growth of the NFT Ecosystem
Cardano is also achieving notable progress in NFTs. Major marketplaces such as Jungle, jpg.store, and Pun City have launched, fueling vibrant trading activity. Data from Crypto Slam shows NFT transaction volume within Cardano’s ecosystem grew by roughly 68% over a set period, underscoring the platform’s expanding diversity.
ADA Price Forecasts and Tokenomics Impact
Cardano’s tokenomics play a crucial role in determining ADA’s long-term price direction. A clear understanding of its supply mechanism and allocation structure is essential for accurate price projections.
Token Supply and Allocation Structure
Cardano’s maximum supply is capped at 45 billion ADA. At launch, roughly 31.1 billion ADA were distributed as follows:
- Cardano Foundation: 30% – supporting long-term ecosystem growth and community initiatives
- IOHK (Input Output Hong Kong): 20% – funding technical development and research
- Early Stakeholders: 20% – rewarding initial project backers
- Community Development: 15% – fostering community-driven projects
- Emerging Technologies Fund: 10% – investing in new technology and innovation
- Cardano Foundation Reserve: 5% – strategic and emergency funding
Inflation Mechanism
It is estimated that Cardano’s full supply will not reach complete circulation until around 2050. This extended schedule helps spread out supply pressure and supports price stability.
As circulating supply nears its cap, inflation rates tend to decline. Cardano’s historical network inflation rate is about 1.55%, notably lower than Bitcoin (BTC). This low inflation benefits ADA’s appeal as a long-term store of value.
ADA Price Forecast: Historical Trends and Key Drivers
Analyzing ADA’s price history provides meaningful insight for projecting future movements. Since inception, Cardano’s growth path has closely followed—yet differentiated itself from—broader crypto market trends.
Early Price Movements
ADA launched in late 2017 and saw rapid growth. By January 2018, amid a surging cryptocurrency market, ADA hit an all-time high of $1.33, reflecting strong market anticipation for new blockchain projects and Cardano’s technical innovation.
However, the 2018 market correction triggered a sharp decline—by early 2019, ADA had dropped to $0.03, a roughly 97% drawdown. Despite adversity, the Cardano team pressed forward with development and reinforced the project’s foundation.
Recovery and Growth
Cardano steadily recovered through 2020 and 2021, buoyed by ongoing development and key upgrades. A notable peak occurred around $3.10 in September 2021.
This rally stemmed from multiple factors: a bullish crypto market and major technical upgrades—most notably the “Alonzo Hard Fork,” which enabled smart contracts. These improvements opened the door for DeFi and NFT projects on Cardano, greatly enhancing ecosystem value.
Major Events and Their Impact
Events such as Bitcoin halving cycles have pronounced effects on Cardano’s price. Bitcoin halving cuts mining rewards, reducing new supply and often fueling bull markets that benefit assets like Cardano.
Bitcoin’s 2020 halving sparked the 2021 crypto bull run, during which ADA reached new highs. Similarly, following the 2024 halving, ADA surged past $1 in a short span.
Internal development milestones have also driven price action. The Shelley upgrade in 2020 introduced decentralization and staking, allowing network participants to earn rewards. The Goguen phase in 2021 launched smart contracts, enabling sophisticated DApp development on Cardano. These upgrades were critical catalysts for ADA’s price spikes.
ADA Price Forecast: Technical Analysis
Technical analysis uses historical price patterns and chart data to project future movements. In-depth chart analysis clarifies Cardano’s long-term price trajectory.
Pattern Identification and Analysis
Detailed weekly chart analysis reveals distinct patterns in Cardano’s price action. Early on, a peak forms—preceded and followed by smaller highs. This leads to approximately two and a half years of range-bound price stagnation.
After consolidation, ADA set two new highs, peaking above $3, followed by two distinct lows during subsequent corrections. Pinpointing these high and low markers provides benchmarks for future price forecasts.
Short-Term Chart Patterns
Past price charts show ADA formed a channel pattern, which it later broke. The channel’s upper trendline acts as a key support; if breached (e.g., near $0.56), ADA may enter further correction.
The 20-period moving average (20-EMA) provides secondary support around $0.52. A drop below this level could send ADA below $0.50. These technical indicators are critical for formulating short-term trading strategies.
Cardano Price Forecast: Statistical Analysis
After isolating key highs and lows, statistical analysis quantifies rate and duration of price changes between them, offering concrete standards for future forecasts.
Price Movement Data Analysis
Historical data analysis reveals the following statistical trends:
Decline Phase:
- Average drop from high to low: 68.53%
- Average decline duration: 151 days
- These figures characterize typical market correction behavior.
Rally Phase:
- Average rise from low to high: 198.79%
- Average rally duration: 90 days
- These figures highlight the potential for rapid price increases in bull markets.
Key Considerations
Actual price swings may deviate considerably from averages due to broad market conditions, support and resistance levels, and other factors. Treat these statistics as reference points and adjust for changing market environments.
Volatility, regulatory shifts, technological breakthroughs, and macroeconomic trends also play major roles in shaping prices. Comprehensive analysis of these variables is vital for sound investment decisions.
Cardano (ADA) Price Forecast: 2025
Outlook: Bullish
The 2025 ADA forecast leverages historical statistics and technical analysis. Factoring in prior corrections, the next low is expected near $0.752, applying an average decline of 38.50%.
This projected low sits above the 2023 peak of $0.675, indicating sustained upward momentum. As sentiment improves and ecosystem growth continues, ADA may resume its uptrend.
Applying the average rally of 198.79% yields a projected 2025 high near $2.24, reflecting Cardano’s technical progress, ecosystem expansion, and overall crypto market growth.
Estimated Investment ROI: Projected ROI from base price: approximately 441%
This forecast assumes Cardano continues technical innovation and expands adoption in DeFi, NFTs, and other blockchain applications.
Cardano (ADA) Price Forecast: 2030
Outlook: Bullish
2030 forecasts factor in long-term growth and market cycles, using the 2025 high as a benchmark for subsequent analysis.
Mid-Term Correction
After the 2025 peak, profit-taking may increase selling pressure, potentially resulting in an average decline of 68.53%. Such corrections are natural parts of the market cycle.
Statistical models suggest a correction period (roughly 150 days) could bring ADA down to $0.712—the projected 2025 low, just below the prior low of $0.752.
Long-Term Uptrend
Following correction, ADA is likely to resume its uptrend. Applying a 198.79% rally from $0.712, the next high may reach $2.14 in early 2026.
Using the 2023 low and projected 2026 high as benchmarks, ADA could reach about $5.26 by 2030 if similar growth patterns persist.
Estimated Investment ROI: Projected ROI from base price: approximately 1170%
This long-term forecast assumes Cardano achieves:
- Ongoing technical innovation and protocol upgrades
- Major expansion of the DeFi ecosystem
- Greater enterprise and government adoption
- Maturation of the global crypto market
Cardano (ADA) Long-Term Price Forecast: Through 2035
Outlook: Highly Bullish
The table below details projected ADA prices from 2025 to 2035, based on historical statistics, technical analysis, and anticipated ecosystem growth.
| Year | ADA Projected High | ADA Projected Low |
|---|---|---|
| 2025 | $2.24 | $0.71 |
| 2026 | $2.14 | $1.32 |
| 2027 | $2.57 | $2.00 |
| 2028 | $3.85 | $3.01 |
| 2029 | $4.23 | $3.30 |
| 2030 | $5.26 | $4.10 |
| 2031 | $7.89 | $6.15 |
| 2032 | $10.65 | $8.30 |
| 2033 | $15.97 | $9.90 |
| 2034 | $18.37 | $14.33 |
| 2035 | $22.04 | $17.19 |
Long-Term Forecast Assumptions
This forecast assumes:
-
Technical Advancement: Cardano continuously improves scalability, interoperability, and sustainability.
-
Ecosystem Expansion: Adoption grows in DeFi, NFTs, gaming, supply chain, and other use cases.
-
Regulatory Maturity: Global crypto regulations become clearer, encouraging institutional entry.
-
Market Maturity: The overall crypto market matures, volatility gradually decreases, and long-term growth persists.
-
Global Adoption: Blockchain and Cardano achieve broader uptake worldwide, including emerging markets.
Cardano Price Forecast Model: Accuracy and Considerations
This model leverages comprehensive technical analysis, tracking diverse indicators and data points for high-precision, relevant forecasts.
Key Analytical Methods
Integrated factors include:
- Historical Price Data: Patterns and statistical trends
- Technical Indicators: Moving averages, support/resistance, chart patterns
- Market Cycles: Crypto market periodicity and Bitcoin halving effects
- Fundamentals: Technology development, ecosystem growth, adoption rates
Drivers of Forecast Variability
Actual ADA prices may diverge due to:
-
Market Cap Fluctuations: Cardano’s capitalization shifts with market flows.
-
Technical Progress: Successful or delayed upgrades (e.g., Vasil Fork) directly affect price.
-
Developer Activity: Changes in developer numbers signal ecosystem health and potential.
-
Regulatory Shifts: Policy changes impact sentiment and price.
-
Competition: Rival smart contract platforms affect Cardano’s market share.
-
Macroeconomic Factors: Global economics, monetary policy, and geopolitical risks exert indirect influence.
Investor Recommendations
When considering ADA, investors should:
- Monitor Continuously: Track ADA prices and compare projections to actuals
- Analyze Fundamentals: Assess growth metrics—developer count, DApps, TVL, etc.
- Track Market Trends: Observe broader crypto market and Bitcoin price movements
- Manage Risk: Diversify portfolios and apply robust risk management
- Maintain Long-Term Focus: Avoid distraction from short-term volatility; invest for the long haul
Considering these factors will support more informed investment decisions.
FAQ
What is Cardano (ADA)? Key Features and Mechanisms
Cardano is a blockchain platform developed by Ethereum co-founder Charles Hoskinson. It uses the Ouroboros PoS consensus algorithm to address scalability, interoperability, and sustainability. ADA is Cardano’s native cryptocurrency.
What is the ADA price forecast for 2025–2026? Expert Views
Expert opinions vary. Bullish forecasts suggest ADA could surpass $1 in 2026, while conservative estimates see it ranging between $0.55 and $0.30 due to a lack of major catalysts.
How high could Cardano (ADA) reach by 2035?
Using a 5% annual growth rate, Cardano (ADA) could reach approximately $0.3905 by 2035. Actual prices may differ due to market volatility.
What are the main factors influencing ADA’s price?
Key drivers include macroeconomic conditions, regulatory trends, technical development, adoption rates, market liquidity, and overall blockchain sector sentiment.
How is Cardano (ADA) different from Bitcoin and Ethereum?
Cardano delivers high throughput (about 250 TPS) via the Ouroboros consensus mechanism. It is faster than Bitcoin and has a more secure upgrade roadmap compared to Ethereum.
What risks are involved in investing in Cardano (ADA)?
Risks include market volatility, blockchain development challenges, regulatory uncertainty, possible project delays, and competition. Comprehensive research is vital before investing.
What is Cardano (ADA)’s technical roadmap and future outlook?
Cardano is in its fifth development phase, “Voltaire,” enabling a voting and treasury system for sustainability. Future plans include improved scalability, interoperability, expanded DApp development, and strengthening its position as a leading blockchain platform.
Are Cardano (ADA) price forecasts reliable? What are the assumptions?
ADA forecasts are based on technological innovation, DeFi growth, scalability improvements, governance progress, and regulatory developments. Cardano’s academic rigor and strong team support expectations for medium- to long-term growth.
Share
Content
Cardano: Overview and Market Position
Cardano Fundamentals: Factors Driving ADA Price Forecasts
ADA Price Forecasts and Tokenomics Impact
ADA Price Forecast: Historical Trends and Key Drivers
ADA Price Forecast: Technical Analysis
Cardano Price Forecast: Statistical Analysis
Cardano (ADA) Price Forecast: 2025
Cardano (ADA) Price Forecast: 2030
Cardano (ADA) Long-Term Price Forecast: Through 2035
Cardano Price Forecast Model: Accuracy and Considerations
FAQ
How to Buy Cryptocurrency


Trending Cryptocurrencies


Cardano (ADA) Price Prediction 2025 & 2030 – Is ADA Set to Soar?

Cardano (ADA): A History, Tech Overview, and Price Outlook

How Does Cardano's Proof of Stake (PoS) Mechanism Work?

What is Cardano?

Cardano (ADA) Price Analysis and Outlook for 2025
Factors Affecting Cardano's Price
Is Xcad Network (XCAD) a good investment?: A Comprehensive Analysis of Token Utility, Market Potential, and Risk Factors
Reserve Rights Token – Is RSR Cryptocurrency Worth Investing In?
How To Use Beefy Finance
What is Blum and How to Earn with It

Byzantine Fault Tolerance Explained