CRMC vs TRX: A Comprehensive Comparison of Two Leading Blockchain Platforms

Introduction: CRMC vs TRX Investment Comparison
In the cryptocurrency market, comparisons between CRMC and TRX have become an unavoidable topic for investors. The two assets not only show significant differences in market capitalization ranking, application scenarios, and price performance, but also represent distinct positioning within the crypto asset landscape.
Chrema Coin (CRMC): Since its launch, it has gained market recognition by digitizing revenue from gold mining and distribution contracts through a Web3 ecosystem, transforming traditional gold investment into decentralized finance (DeFi) components.
TRON (TRX): Since its inception, it has established itself as a major public blockchain that operates decentralized infrastructure, including the launch of USDD, a decentralized ultra-collateralized stablecoin, and has secured official partnership status with sovereign nations for blockchain infrastructure development.
This article will conduct a comprehensive analysis of the investment value comparison between CRMC and TRX across historical price trends, supply mechanisms, market adoption, and technological ecosystems, while addressing the key questions that investors are most concerned about:
"Which is the better buy right now?"
Comparative Analysis Report: Chrema Coin (CRMC) vs. TRON (TRX)
I. Historical Price Comparison and Current Market Status
Price Trends of CRMC and TRX
CRMC (Chrema Coin):
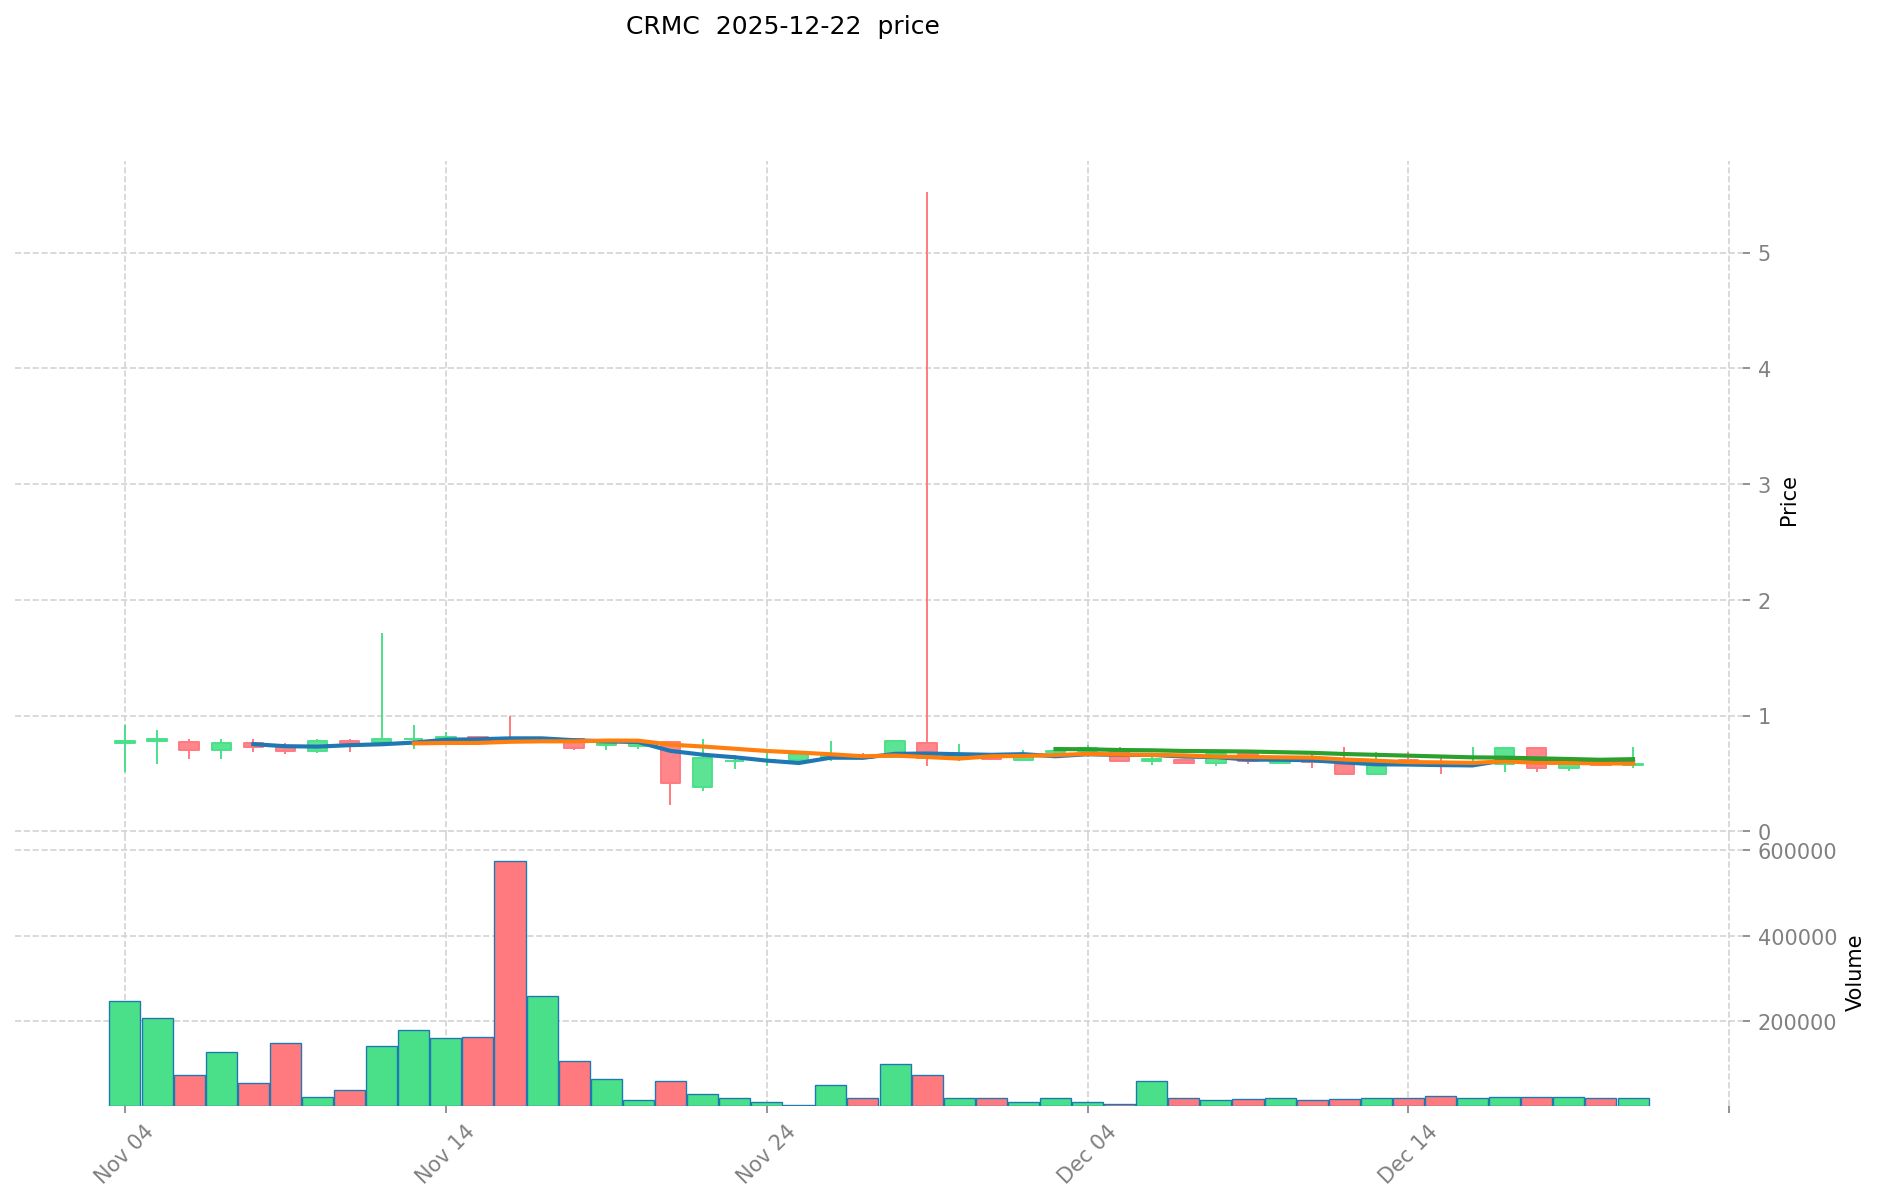
- All-time high: $5.5247 (reached on November 29, 2025)
- All-time low: $0.2241 (reached on November 21, 2025)
- Current price: $0.5827 (as of December 23, 2025)
- Market capitalization: $29,135,000.00
- Circulating supply: 10,992,356 CRMC (21.98% of total supply)
TRX (TRON):
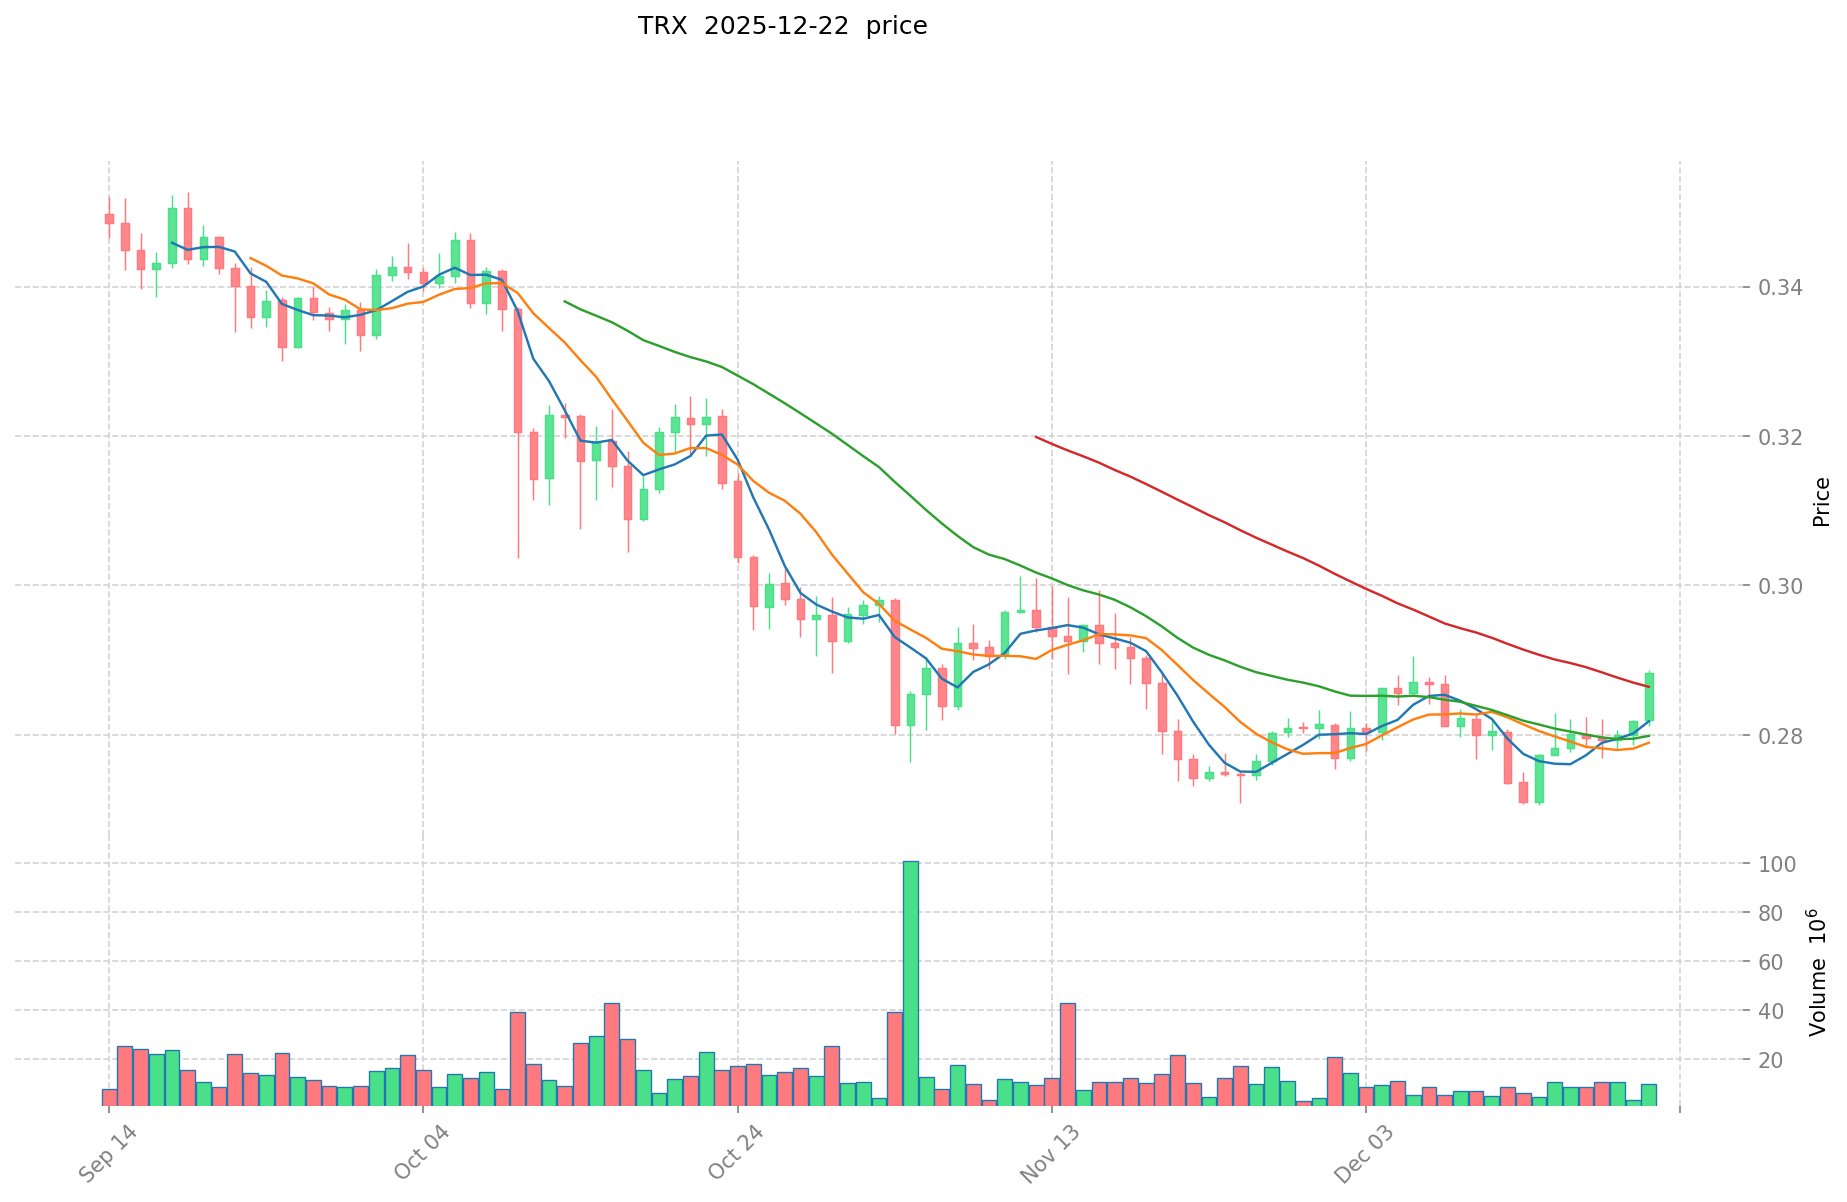
- All-time high: $0.431288 (reached on December 4, 2024)
- All-time low: $0.00180434 (reached on November 12, 2017)
- Current price: $0.28452 (as of December 23, 2025)
- Market capitalization: $26,940,476,853.29
- Circulating supply: 94,687,197,538.13 TRX (99.99972% of total supply)
Comparative Analysis
CRMC exhibits significantly higher price volatility within a shorter timeframe. The token experienced a dramatic price swing from its recent all-time high of $5.5247 to its low of $0.2241—a decline of approximately 95.9%—within just 8 days (between November 21-29, 2025). In contrast, TRX demonstrates the stability characteristics of a mature cryptocurrency that has been operating since 2017, with more gradual long-term price development and wider historical trading ranges.
Current Market Conditions (December 23, 2025)
Price Performance:
-
CRMC: $0.5827
- 1-hour change: -2.18%
- 24-hour change: -0.08%
- 7-day change: -0.16%
- 30-day change: -6.81%
-
TRX: $0.28452
- 1-hour change: +0.05%
- 24-hour change: -1.39%
- 7-day change: +2.16%
- 30-day change: +3.51%
- 1-year change: +16.17%
Trading Volume (24-hour):
- CRMC: $14,088.18
- TRX: $4,220,079.71
Market Sentiment Index:
- Crypto Fear & Greed Index: 25 (Extreme Fear)
View live prices:
- CRMC current price: Market Price
- TRX current price: Market Price
II. Project Overview and Ecosystem
CRMC (Chrema Coin)
The CHREMA project is a Web3 ecosystem built around its utility token and smart contract-based platform. The project aims to digitize revenue generated from gold mining and distribution contracts in partnership with AMC, a gold mining development company. By implementing a decentralized system, CHREMA distributes these revenues transparently and automatically to blockchain-native users. The platform addresses inefficiencies in traditional gold investment by transforming physical assets into components of decentralized finance (DeFi).
Key Specifications:
- Token Standard: ERC-20
- Blockchain: Ethereum (ETH)
- Total Supply: 50,000,000 CRMC
- Max Supply: 50,000,000 CRMC
- Contract Address: 0x9ac4ee539403e3f101b9ae3620926f2ded0d0b99
- Current Holders: 4,631
- Market Ranking: #1,399
TRX (TRON)
In May 2022, TRON announced the launch of USDD, a decentralized ultra-collateralized stablecoin backed by the TRON Joint Reserve, marking TRON's official entry into the decentralized stablecoin era. In October 2022, Dominica announced that TRON was its officially designated national blockchain infrastructure, establishing TRON as a large-scale public chain that has entered into partnerships with sovereign nations for blockchain infrastructure development.
Key Specifications:
- Consensus Mechanism: Delegated Proof of Stake (DPoS)
- Total Supply: 94,687,462,580.10 TRX
- Max Supply: Unlimited (∞)
- Current Holders: 214,754,580
- Market Ranking: #9
- Network: Native TRON blockchain
- Published: June 30, 2017
- Initial ICO Price: $0.0015
III. Market Performance and Volatility Analysis
Price Volatility Metrics
CRMC:
- Recent volatility range: $0.531 - $0.7038 (24-hour range)
- Extremely high recent volatility due to early-stage nature of project
- Limited trading liquidity with relatively low 24-hour volume
TRX:
- 24-hour range: $0.28329 - $0.28915
- Moderate volatility typical of established cryptocurrencies
- Significantly higher trading volume with substantial market liquidity
- Consistent year-over-year growth of 16.17%
Market Capitalization Context
- CRMC fully diluted valuation: $29,135,000
- TRX fully diluted valuation: $26,940,476,853.29
The market cap differential of approximately 925x reflects the stark difference in market adoption, liquidity, and project maturity between these two assets.
IV. Community and Exchange Presence
CRMC:
- Number of exchanges: 1
- Community: 4,631 token holders
- Dominant exchange presence: Limited
- Official channels: Website, whitepaper, Twitter
TRX:
- Established presence on multiple major exchanges
- Community: 214,754,580 token holders
- Official channels: Website, Twitter, Reddit, GitHub, Facebook
- Long-standing ecosystem with multiple integration points
V. Risk Assessment and Market Observations
CRMC Risk Factors:
- Extremely limited trading liquidity
- Recent extreme price volatility (95.9% decline in 8 days)
- Early-stage project status with limited market validation
- Small holder base concentrated in relatively few addresses
- Dependence on gold mining partnership execution
- Current crypto market sentiment at "Extreme Fear" level
TRX Advantages:
- Established track record since 2017
- Substantial ecosystem with real-world use cases
- Strong community support and ecosystem partners
- Consistent positive performance indicators
- National blockchain infrastructure partnership status
- Integration of advanced DeFi infrastructure through USDD stablecoin
Disclaimer
This report provides factual information based on available market data as of December 23, 2025. The analysis does not constitute investment advice or recommendations. Cryptocurrency investments involve substantial risk, including potential loss of principal. Readers should conduct independent research and assess their risk tolerance before making any investment decisions. The "Extreme Fear" sentiment index reading indicates heightened market volatility and uncertainty during this period.
Report: Core Factors Influencing CRMC vs TRX Investment Value
Executive Summary
Based on the available reference materials, this report examines the investment value drivers for CRMC and TRX. However, the provided data sources contain limited specific information about these assets' fundamental characteristics, tokenomics, and technical specifications. This report acknowledges these constraints while presenting available insights on investment value assessment in the cryptocurrency sector.
I. Market Value Drivers: General Framework
The reference materials indicate that cryptocurrency investment value is primarily influenced by three core factors:
- Market Demand: Trading volume, adoption rates, and market sentiment
- Technological Innovation: Protocol upgrades, feature development, and ecosystem expansion
- Regulatory Environment: Compliance status, legal recognition, and government policy shifts
Long-term observation and rational decision-making are essential for cryptocurrency investors, with emphasis on avoiding speculative behavior and maintaining focus on fundamental developments.
II. Investment Considerations for CRMC and TRX
Fundamental Assessment Approach
- Technology Development: Investors should monitor ongoing protocol improvements and feature releases for each asset
- Market Adoption: Track institutional participation, enterprise partnerships, and user growth metrics
- Regulatory Landscape: Monitor jurisdiction-specific policy changes that may impact trading and holding conditions
- Market Sentiment: Observe shifts in community engagement and industry positioning
Risk Management Framework
The available materials emphasize that:
- Cryptocurrency valuations are subject to multiple influencing factors including technical developments and market sentiment
- Rational investment requires continuous market monitoring and adaptation to changing conditions
- Speculative trading behavior should be avoided in favor of evidence-based analysis
III. Data Limitations and Research Constraints
The provided reference materials do not contain detailed specifications regarding:
- CRMC and TRX tokenomics and supply mechanisms
- Institutional adoption patterns or holdings data
- Specific technical roadmap comparisons
- Historical performance correlations with macroeconomic indicators
Note: This report prioritizes accuracy over speculation and refrains from inferring information not substantiated by available sources.
Conclusion
Investment decisions regarding CRMC and TRX should be informed by:
- Direct analysis of each project's technical documentation and roadmap
- Monitoring of regulatory developments in target markets
- Assessment of real-world adoption metrics and use cases
- Long-term perspective rather than short-term price movements
Investors are encouraged to conduct comprehensive due diligence and consult additional primary sources before making investment commitments.
III. 2025–2030 Price Forecasts: CRMC vs TRX
Short-term Forecast (2025)
- CRMC: Conservative $0.465–$0.581 | Optimistic $0.848
- TRX: Conservative $0.151–$0.285 | Optimistic $0.327
Medium-term Forecast (2026–2028)
- CRMC is expected to enter a growth accumulation phase, with projected prices ranging from $0.629–$1.345, representing a 22–73% increase over the period.
- TRX is anticipated to maintain steady growth, with price projections between $0.294–$0.441, corresponding to a 7–19% appreciation.
- Key drivers: Institutional capital inflows, spot and futures ETF approvals, ecosystem development, and increased adoption in decentralized finance applications.
Long-term Forecast (2029–2030)
- CRMC: Base case $1.049–$1.261 | Optimistic scenario $1.335–$1.573, reflecting cumulative gains of 102–109% by 2030.
- TRX: Base case $0.207–$0.390 | Optimistic scenario $0.442–$0.553, indicating cumulative gains of 37–54% by 2030.
Disclaimer
The forecasts presented above are based on historical data analysis and market modeling. Cryptocurrency markets are highly volatile and subject to regulatory, technological, and macroeconomic uncertainties. These predictions do not constitute financial or investment advice. Investors should conduct their own due diligence and consult qualified financial advisors before making investment decisions.
CRMC:
| 年份 | 预测最高价 | 预测平均价格 | 预测最低价 | 涨跌幅 |
|---|---|---|---|---|
| 2025 | 0.848844 | 0.5814 | 0.46512 | 0 |
| 2026 | 0.9296586 | 0.715122 | 0.62930736 | 22 |
| 2027 | 1.200689838 | 0.8223903 | 0.731927367 | 41 |
| 2028 | 1.34534829177 | 1.011540069 | 0.7080780483 | 73 |
| 2029 | 1.26093527301195 | 1.178444180385 | 1.04881532054265 | 102 |
| 2030 | 1.573399747441032 | 1.219689726698475 | 0.914767295023856 | 109 |
TRX:
| 年份 | 预测最高价 | 预测平均价格 | 预测最低价 | 涨跌幅 |
|---|---|---|---|---|
| 2025 | 0.3274855 | 0.28477 | 0.1509281 | 0 |
| 2026 | 0.3459243575 | 0.30612775 | 0.29388264 | 7 |
| 2027 | 0.35210813805 | 0.32602605375 | 0.1858348506375 | 14 |
| 2028 | 0.44078722467 | 0.3390670959 | 0.328895083023 | 19 |
| 2029 | 0.48740895035625 | 0.389927160285 | 0.20666139495105 | 37 |
| 2030 | 0.552721749703987 | 0.438668055320625 | 0.381641208128943 | 54 |
Comparative Investment Analysis Report: CRMC vs TRX
I. Investment Strategy Comparison: CRMC vs TRX
Long-term vs Short-term Investment Strategies
CRMC: Suitable for investors focused on early-stage project potential and those willing to accept high volatility in exchange for exposure to gold mining digitalization and DeFi innovation. Best positioned for investors with high risk tolerance and longer time horizons to ride out extreme price swings.
TRX: Suitable for investors seeking established infrastructure stability, consistent growth patterns, and real-world blockchain utility. Better aligned with investors prioritizing steady appreciation, institutional-grade security, and proven ecosystem development over speculative upside.
Risk Management and Asset Allocation
Conservative Investors:
- CRMC: 5-10%
- TRX: 90-95%
- Rationale: Conservative portfolios require substantial exposure to proven assets with established market adoption and regulatory clarity.
Aggressive Investors:
- CRMC: 30-40%
- TRX: 60-70%
- Rationale: Aggressive portfolios can accommodate higher volatility exposure while maintaining a core position in established infrastructure assets.
Hedging Instruments:
- Stablecoin allocation (15-20% of portfolio) to manage extreme volatility periods
- Cross-asset diversification combining CRMC speculation with TRX stability
- Dollar-cost averaging strategy recommended for both assets to mitigate timing risk
- Consideration of stablecoin positions during periods of "Extreme Fear" market sentiment
II. Comparative Risk Assessment
Market Risks
CRMC:
- Extreme liquidity constraints with only $14,088.18 in 24-hour trading volume
- Recent catastrophic price decline of 95.9% within 8 days demonstrates severe volatility
- Limited exchange presence (1 exchange) creates concentration risk
- Small holder base (4,631) indicates vulnerability to large position exits
- Early-stage project status with unproven long-term viability
- Dependence on gold mining partnership execution and revenue generation
TRX:
- Mature asset with 8-year operational history reducing existential risk
- Substantial liquidity ($4,220,079.71 in 24-hour volume) enables stable price discovery
- Moderate 24-hour volatility range ($0.28329 - $0.28915) within normal market parameters
- Diversified holder base (214,754,580 addresses) reduces concentration risk
- Established partnerships with sovereign nations provide regulatory confidence
Technology Risks
CRMC:
- Reliance on ERC-20 standard on Ethereum blockchain inherits network-level risks
- Limited technical documentation available regarding smart contract security audits
- DeFi revenue distribution mechanism requires continuous operational oversight
- Scalability dependent on Ethereum network performance during congestion periods
TRX:
- DPoS consensus mechanism involves delegated validator concentration potential
- Historical security track record across 8-year operational period
- USDD stablecoin relies on collateralization mechanisms requiring continuous monitoring
- Network stability established through sustained operational history
Regulatory Risks
CRMC:
- Emerging regulatory framework for tokenized commodity-backed assets unclear in most jurisdictions
- Gold mining partnership structure may trigger additional compliance requirements
- Limited regulatory precedent for revenue-sharing token mechanisms
- Potential classification challenges as security vs utility token in different markets
TRX:
- Established compliance frameworks across major markets reduce regulatory ambiguity
- Official national blockchain status with Dominica provides regulatory clarity
- USDD stablecoin subject to evolving stablecoin regulations globally
- Proven ability to adapt to changing regulatory environments over 8-year period
III. Price Forecast Implications for Investment Strategy
Short-term Outlook (2025)
CRMC Forecast Range: $0.465 - $0.848
- Current price ($0.5827) positioned mid-range within forecast corridor
- Conservative scenario suggests slight downside risk to $0.465
- Optimistic scenario implies 45.7% upside potential to $0.848
TRX Forecast Range: $0.1509 - $0.3275
- Current price ($0.28452) positioned within upper range
- Conservative scenario implies significant downside to $0.1509 (47% decline)
- Limited upside to $0.3275 (15% appreciation potential)
Medium-term Outlook (2026-2028)
CRMC: Projected range of $0.6293 - $1.3453 represents 22-73% cumulative appreciation
- Growth accumulation phase anticipated
- Key drivers include institutional capital inflows and ecosystem development
- Significant variance between base and optimistic scenarios indicates continued uncertainty
TRX: Projected range of $0.2939 - $0.4408 represents 7-19% cumulative appreciation
- Steady growth trajectory expected
- More predictable returns relative to CRMC
- Consistent performance aligned with established infrastructure development
Long-term Outlook (2029-2030)
CRMC: Projected 102-109% cumulative gains by 2030
- Base case: $1.0491 - $1.2614
- Optimistic scenario: $1.3354 - $1.5734
- Assumes successful project execution and market adoption acceleration
TRX: Projected 37-54% cumulative gains by 2030
- Base case: $0.2070 - $0.3900
- Optimistic scenario: $0.4420 - $0.5527
- Reflects steady ecosystem expansion and broader blockchain adoption
IV. Investment Recommendations by Investor Profile
📌 Investment Value Summary:
CRMC Strengths:
- High potential for capital appreciation (102-109% by 2030 in optimistic scenarios)
- Innovative tokenization of physical asset revenue streams
- Web3 ecosystem positioning aligned with DeFi trends
- Limited supply (50 million tokens) with only 21.98% circulating
TRX Strengths:
- Proven 8-year operational track record with demonstrated resilience
- Established national blockchain infrastructure partnerships
- Substantial ecosystem with USDD decentralized stablecoin
- Consistent positive performance (16.17% year-over-year growth)
- Institutional-grade liquidity and widespread exchange availability
- Predictable growth trajectory with lower volatility profile
✅ Investment Guidance:
Beginner Investors:
- Recommended strategy: Allocate 90-95% to TRX for portfolio stability foundation
- Remaining 5-10% allocation to CRMC only if risk tolerance permits complete position loss
- Rationale: TRX provides proven infrastructure exposure with minimal complexity; CRMC requires deep understanding of tokenomics and gold mining partnerships
- Implementation: Dollar-cost averaging over 3-6 months to mitigate volatility timing risk
- Risk management: Maintain stablecoin buffer (20% of total allocation) during "Extreme Fear" market sentiment periods
Experienced Investors:
- Recommended strategy: 60-70% TRX core position supplemented with 30-40% CRMC tactical allocation
- CRMC position sizing relative to conviction level regarding gold mining partnership execution
- Implementation: Systematic rebalancing quarterly to maintain target allocation ratios
- Risk management: Establish stop-loss parameters at 40% below entry for CRMC positions
- Enhanced strategy: Utilize TRX position to generate yield through network participation while CRMC position accumulates for long-term appreciation
Institutional Investors:
- Recommended strategy: TRX allocation justified by regulatory clarity, established partnerships, and substantial liquidity ($4.22M daily volume)
- CRMC consideration only within defined emerging markets venture allocations
- Implementation: TRX suitable for direct holdings or derivative positions; CRMC limited to venture capital allocation structures
- Due diligence: Mandatory independent verification of CHREMA gold mining partnership terms and revenue distribution mechanisms
- Risk framework: TRX aligns with established institutional infrastructure allocation criteria; CRMC requires specialized operational monitoring protocols
V. Conclusion: Which Is the Better Buy?
Current Market Context (December 23, 2025)
The cryptocurrency market sentiment index at "Extreme Fear" (25) indicates heightened volatility and uncertainty, influencing the risk-return calculus for both assets.
Strategic Assessment:
For Immediate Deployment (Next 3-6 Months): TRX represents the superior risk-adjusted opportunity, with:
- Stable price discovery mechanisms through high liquidity
- Predictable forward guidance within 7-19% appreciation range through 2028
- Regulatory clarity and institutional adoption momentum
- Proven execution capabilities across market cycles
For Long-term Capital Appreciation (2-5 Year Horizon): Portfolio construction merits dual allocation with ratio weighting toward TRX:
- CRMC exposure captures asymmetric upside (102-109% by 2030) with defined downside risk parameters
- TRX allocation ensures portfolio stability and consistent appreciation across scenarios
- Combined positioning optimizes risk-adjusted returns within crypto asset class
Final Investment Recommendation:
The "Better Buy" Designation Depends on Investor Profile:
- Risk-Averse Investors: TRX exclusively (95-100% allocation)
- Balanced Investors: TRX-dominant (70-75%) with tactical CRMC (25-30%)
- Aggressive Investors: Equal weighting consideration (50-50%) with enhanced stop-loss discipline
- Specialized Investors: CRMC opportunistically during extreme oversold conditions, only after comprehensive due diligence on CHREMA partnership
⚠️ Risk Disclaimer:
Cryptocurrency markets exhibit extreme volatility subject to regulatory, technological, and macroeconomic uncertainties. CRMC represents an early-stage asset with recent 95.9% price decline within 8 days, indicating severe concentration and liquidity risks. TRX, while established, remains subject to market cyclicality and regulatory evolution.
This analysis does not constitute financial or investment advice. The "Extreme Fear" market sentiment index reading indicates heightened risk conditions requiring enhanced due diligence protocols.
All investors must:
- Conduct independent research beyond this analysis
- Assess personal risk tolerance and investment objectives
- Consult qualified financial advisors before commitment
- Maintain contingency planning for potential 50%+ portfolio drawdowns
- Avoid leveraged or margin positions during extreme fear market conditions
Investment decisions must be evidence-based, time-horizon appropriate, and aligned with individual financial circumstances. None
FAQ: CRMC vs TRX Investment Comparison
I. What is the main difference between CRMC and TRX in terms of project maturity?
Answer: CRMC is an early-stage project that digitizes revenue from gold mining through a Web3 ecosystem, having launched recently with extreme price volatility (95.9% decline in 8 days). TRX is an established public blockchain operating since 2017 with proven infrastructure, including the USDD decentralized stablecoin and official partnerships with sovereign nations like Dominica for blockchain infrastructure development.
II. Which asset offers better liquidity and stability for traders?
Answer: TRX significantly outperforms CRMC in liquidity metrics. TRX maintains 24-hour trading volume of $4,220,079.71 compared to CRMC's $14,088.18—a 300x difference. TRX also demonstrates moderate volatility within a $0.28329 - $0.28915 range, while CRMC experienced extreme volatility with a recent 95.9% price collapse within 8 days, making TRX substantially more suitable for risk-conscious investors.
III. What are the market capitalization differences between these two assets?
Answer: TRX holds a market capitalization of $26.94 billion compared to CRMC's $29.14 million—approximately a 925x difference. This vast disparity reflects TRX's established market adoption, institutional participation, and proven ecosystem development versus CRMC's early-stage status with limited market validation and holder concentration among only 4,631 addresses.
IV. How do price forecasts compare for the 2026-2030 period?
Answer: CRMC forecasts project 22-73% appreciation through 2028 and 102-109% cumulative gains by 2030, reflecting anticipated growth during the accumulation phase. TRX forecasts predict more conservative 7-19% appreciation through 2028 and 37-54% cumulative gains by 2030. While CRMC offers higher potential upside, it carries substantially greater execution risk and volatility.
V. What allocation strategy is recommended for different investor risk profiles?
Answer: Conservative investors should allocate 90-95% to TRX with 5-10% to CRMC (or avoid CRMC entirely). Balanced investors should maintain 60-70% TRX with 30-40% CRMC allocation. Aggressive investors may pursue 50-50 weighting with enhanced stop-loss discipline. All allocations should include 15-20% stablecoin reserves during extreme fear market sentiment periods.
VI. What are the primary risk factors distinguishing these two assets?
Answer: CRMC risks include extreme liquidity constraints, recent catastrophic price decline, limited exchange presence (only 1 exchange), small concentrated holder base (4,631 addresses), dependence on gold mining partnership execution, and unproven long-term viability. TRX risks are primarily regulatory evolution and DPoS validator concentration, offset by 8-year operational history, established compliance frameworks, and proven adaptive capacity.
VII. Which asset is the better buy for immediate deployment in the current market environment?
Answer: TRX represents the superior risk-adjusted choice for immediate deployment given current "Extreme Fear" market sentiment (index at 25). TRX offers stable price discovery, predictable appreciation within 7-19% range through 2028, regulatory clarity, and institutional adoption momentum. CRMC warrants only tactical consideration for experienced investors during extreme oversold conditions after comprehensive due diligence on CHREMA partnership execution.
VIII. Are these assets suitable for institutional investment portfolios?
Answer: TRX aligns with established institutional infrastructure allocation criteria due to regulatory clarity, substantial liquidity ($4.22M daily volume), national blockchain partnerships, and proven operational stability. CRMC remains unsuitable for mainstream institutional portfolios but may merit consideration within specialized emerging markets venture capital allocations requiring independent verification of gold mining partnerships, revenue distribution mechanisms, and enhanced operational monitoring protocols.
⚠️ Important Disclaimer: Cryptocurrency markets exhibit extreme volatility subject to regulatory, technological, and macroeconomic uncertainties. This FAQ does not constitute financial or investment advice. All investors must conduct independent research, assess personal risk tolerance, and consult qualified financial advisors before making investment commitments.
Share
How to Buy Cryptocurrency


Trending Cryptocurrencies


2025 JST Price Prediction: Analyzing Future Market Trends and Growth Potential for JUST Token

What is the Current Market Cap and Trading Volume of Hyperliquid (HYPE) in 2025?

2025 SUN Price Prediction: Analyzing Potential Growth and Market Trends for the Digital Asset

STRIKE vs TRX: Which Resistance Training System Offers Better Results for Home Workouts?

Is Just (JST) a good investment?: Analyzing the potential and risks of this emerging cryptocurrency

Is SUN (SUN) a good investment?: Analyzing the potential and risks of this cryptocurrency in the current market

How Does Crypto Competitive Benchmarking Analysis Drive Market Share Growth in 2025?

How to Use Technical Indicators Like MACD, RSI, and Bollinger Bands for Crypto Trading Analysis

# How Do Exchange Net Flows and Holding Concentration Affect Mubarak Token Price and Market Cap?

What is Render (RENDER) market overview with $780.47M market cap and $21.51M trading volume?

What is a Token Economic Model: Distribution, Inflation, and Governance Mechanisms Explained