ECHO vs HBAR: A Comprehensive Comparison of Two Emerging Blockchain Ecosystems

Introduction: Investment Comparison Between ECHO and HBAR
In the cryptocurrency market, the comparison between ECHO vs HBAR has become a topic of interest for investors. These two projects differ significantly in market cap ranking, application scenarios, and price performance, representing distinct positioning within the crypto asset landscape.
ECHO (ECHO): Launched in 2025, this project has positioned itself as Bitcoin staking and liquidity infrastructure built on Move, targeting both institutional partners and individual holders seeking yield opportunities and enhanced asset liquidity for their BTC ecosystem assets.
HBAR (HBAR): Since its launch in 2020, Hedera has been recognized as a fast, secure, and fair public ledger network utilizing hashgraph consensus, supporting decentralized applications and peer-to-peer payment models while protecting the network from malicious attacks.
This article will provide a comprehensive analysis of ECHO vs HBAR investment value comparison, examining historical price trends, supply mechanisms, institutional adoption, technical ecosystems, and future outlook, attempting to address investors' most pressing question:
"Which is the better buy right now?"
I. Historical Price Comparison and Current Market Status
Historical Price Trends of ECHO (Coin A) and HBAR (Coin B)
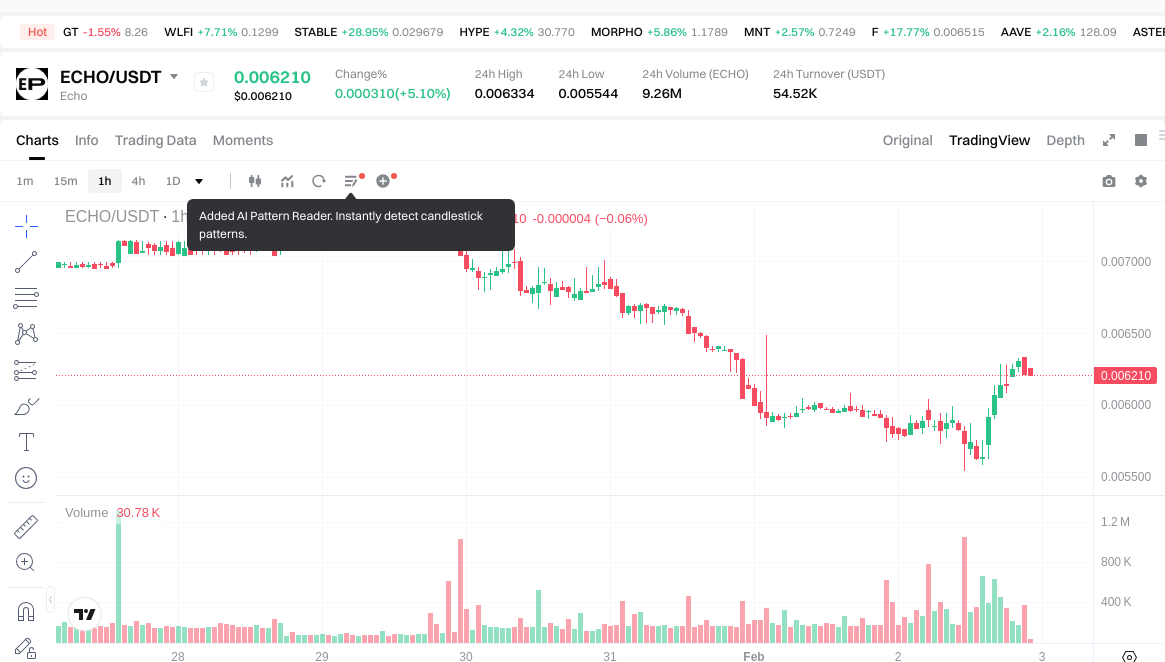
- 2025-07-09: ECHO reached its all-time high at $0.07526, marking a significant milestone during the summer trading period.
- 2021-09-15: HBAR achieved its historical peak at $0.569229, driven by increased adoption and network activity during the broader crypto market rally.
- 2026-02-02: ECHO hit its all-time low at $0.005544, reflecting substantial downward pressure in current market conditions.
- 2020-01-03: HBAR recorded its historical low at $0.00986111 during the early stages of the project.
- Comparative Analysis: During recent market cycles, ECHO has experienced a decline of 79.43% over the past year, dropping from higher levels to its current position. Meanwhile, HBAR has also faced downward pressure with a 67.06% decrease over the same period, though it maintains a relatively stronger market position.
Current Market Status (2026-02-02)
- ECHO Current Price: $0.006239
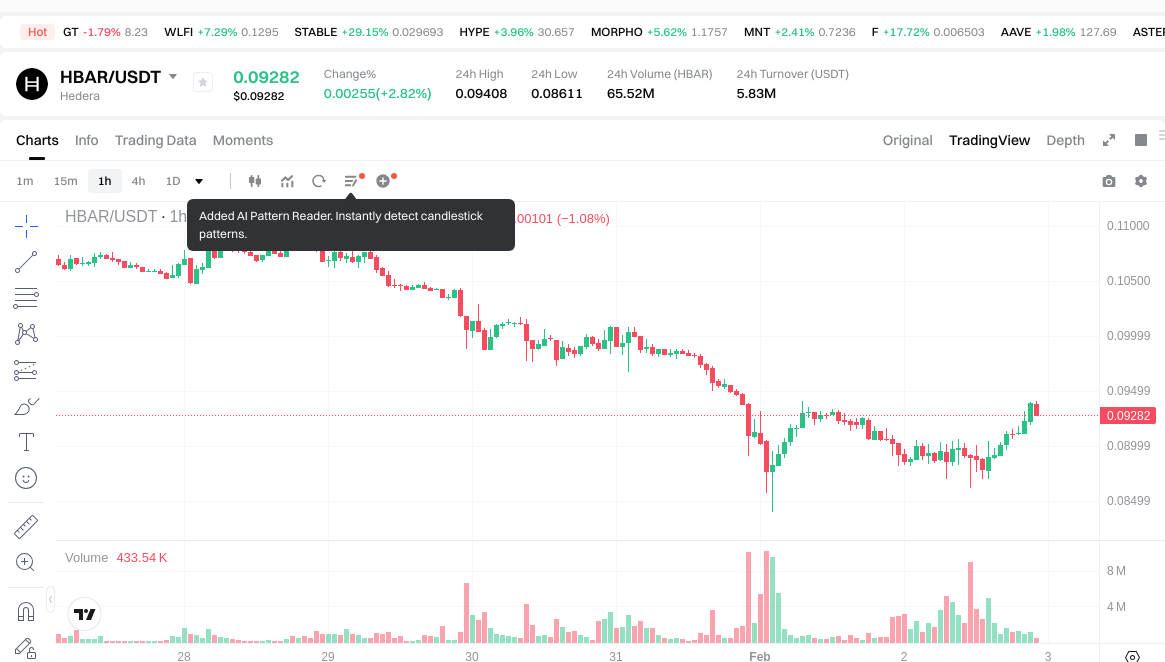
- HBAR Current Price: $0.09388
- 24-Hour Trading Volume: ECHO recorded $54,488.86 compared to HBAR's significantly higher volume of $5,808,566.66
- Market Capitalization: ECHO stands at $1,297,712 while HBAR maintains a substantially larger market cap of $4,037,134,658.61
- Market Sentiment Index (Fear & Greed Index): 14 (Extreme Fear)
- Price Performance (24H): ECHO up 5.97%, HBAR up 3.71%
- Price Performance (7D): ECHO down 13.66%, HBAR down 11.77%
- Price Performance (30D): ECHO down 53.97%, HBAR down 21.42%
View Real-Time Prices:
- Check ECHO Current Price Market Price
- Check HBAR Current Price Market Price
II. Core Factors Influencing ECHO vs HBAR Investment Value
Tokenomics Comparison
- ECHO: The capital-raising mechanism demonstrates growing confidence in decentralized funding structures, with fundraising activities conducted through platforms that have attracted institutional backing from notable firms including GSR, Amber, and Echo.
- HBAR: Market dynamics are influenced by governance expansion initiatives and positive funding rates that may support potential recovery trends.
- 📌 Historical Pattern: Supply mechanisms and funding structures play a role in shaping price cycles through their impact on market liquidity and investor confidence.
Institutional Adoption and Market Application
- Institutional Holdings: HBAR has gained attention through the launch of spot ETF products on U.S. exchanges, which may enhance institutional accessibility and market liquidity.
- Enterprise Adoption: Platform participation mechanisms exist across both assets, with incentive structures designed to encourage wallet activity and user engagement.
- Regulatory Environment: Market participants continue to monitor regulatory developments that may affect both assets, though specific policy stances vary across jurisdictions.
Technical Development and Ecosystem Building
- ECHO Technical Progress: The platform has been subject to acquisition activity by major exchange operators, reflecting its position in the primary market pricing landscape for token fundraising platforms.
- HBAR Technical Development: Governance expansion efforts continue to evolve, with staking capabilities integrated into ETF structures.
- Ecosystem Comparison: Both assets operate within broader crypto ecosystems that include various participation mechanisms, reward structures, and point-based incentive systems designed to foster community engagement.
Macroeconomic Environment and Market Cycles
- Inflationary Context: Asset valuations are influenced by broader market conditions, with fundamental analysis incorporating factors such as team capabilities, financial positioning, and development potential.
- Monetary Policy Impact: Funding rates and liquidity conditions contribute to market sentiment and potential recovery trajectories.
- Geopolitical Considerations: Cross-border transaction requirements and international market dynamics continue to shape the operational environment for digital assets, though specific impacts vary based on regulatory frameworks and market structure.
III. 2026-2031 Price Prediction: ECHO vs HBAR
Short-term Prediction (2026)
- ECHO: Conservative $0.0057 - $0.0062 | Optimistic $0.0079 - $0.0089
- HBAR: Conservative $0.062 - $0.094 | Optimistic $0.095 - $0.107
Mid-term Prediction (2028-2029)
- ECHO may enter a gradual growth phase, with projected price range of $0.0052 - $0.0128 in 2028 and $0.0098 - $0.0152 in 2029
- HBAR may enter a development consolidation phase, with projected price range of $0.117 - $0.140 in 2028 and $0.072 - $0.190 in 2029
- Key drivers: institutional capital inflows, ETF developments, ecosystem expansion
Long-term Prediction (2030-2031)
- ECHO: Baseline scenario $0.0084 - $0.0131 (2030), $0.0149 - $0.0162 (2031) | Optimistic scenario $0.0193 (2030), $0.0175 (2031)
- HBAR: Baseline scenario $0.154 - $0.160 (2030), $0.150 - $0.183 (2031) | Optimistic scenario $0.207 (2030), $0.270 (2031)
Disclaimer
ECHO:
| Year | Predicted High Price | Predicted Average Price | Predicted Low Price | Price Change |
|---|---|---|---|---|
| 2026 | 0.0088679 | 0.006245 | 0.0057454 | 0 |
| 2027 | 0.0103523365 | 0.00755645 | 0.005742902 | 21 |
| 2028 | 0.0128047823475 | 0.00895439325 | 0.005193548085 | 43 |
| 2029 | 0.01523142291825 | 0.01087958779875 | 0.009791629018875 | 74 |
| 2030 | 0.01932214793058 | 0.0130555053585 | 0.00835552342944 | 109 |
| 2031 | 0.017483932776103 | 0.01618882664454 | 0.014893720512976 | 159 |
HBAR:
| Year | Predicted High Price | Predicted Average Price | Predicted Low Price | Price Change |
|---|---|---|---|---|
| 2026 | 0.1066356 | 0.09354 | 0.0617364 | 0 |
| 2027 | 0.142124676 | 0.1000878 | 0.064056192 | 6 |
| 2028 | 0.14048323608 | 0.121106238 | 0.11747305086 | 29 |
| 2029 | 0.189652368708 | 0.13079473704 | 0.071937105372 | 39 |
| 2030 | 0.20668838320746 | 0.160223552874 | 0.15381461075904 | 70 |
| 2031 | 0.269680273019873 | 0.18345596804073 | 0.150433893793398 | 95 |
IV. Investment Strategy Comparison: ECHO vs HBAR
Long-term vs Short-term Investment Strategies
- ECHO: May appeal to investors interested in Bitcoin staking infrastructure and emerging DeFi yield opportunities within the Move ecosystem, though the asset exhibits significant volatility with a 79.43% decline over the past year and relatively lower liquidity as evidenced by its 24-hour trading volume of $54,488.86.
- HBAR: May suit investors seeking exposure to enterprise-grade distributed ledger technology with established institutional presence, supported by spot ETF product availability and higher trading liquidity of $5,808,566.66 in 24-hour volume, while experiencing a 67.06% decline over the past year.
Risk Management and Asset Allocation
- Conservative Investors: A potential allocation approach might consider ECHO at 10-20% versus HBAR at 80-90%, reflecting the significant difference in market capitalization ($1,297,712 vs $4,037,134,658.61) and established market presence.
- Aggressive Investors: A more balanced allocation of ECHO at 30-40% versus HBAR at 60-70% could provide exposure to higher-risk, higher-potential-return opportunities while maintaining substantial exposure to more established infrastructure.
- Hedging Tools: Stablecoin positions, options strategies where available, and cross-asset diversification may help manage portfolio volatility in current extreme fear market conditions (Fear & Greed Index: 14).
V. Potential Risk Comparison
Market Risks
- ECHO: Faces substantial liquidity constraints with significantly lower trading volume and market capitalization, experiencing heightened price volatility as demonstrated by a 53.97% decline over 30 days and an 86.43% drop from its all-time high of $0.07526 to current levels near its all-time low of $0.005544.
- HBAR: Subject to broader market sentiment shifts and institutional capital flow dynamics, with a 21.42% decline over 30 days and an 83.51% decline from its 2021 peak of $0.569229, though maintaining relatively stronger market positioning and liquidity profiles.
Technical Risks
- ECHO: As infrastructure built on Move technology focusing on Bitcoin staking and liquidity, the platform faces adoption challenges and dependency on broader Bitcoin ecosystem development, with limited historical operational data given its 2025 launch.
- HBAR: Network scalability considerations and governance structure evolution continue as the hashgraph consensus mechanism develops, though the platform benefits from a longer operational history since 2020 and established enterprise partnerships.
Regulatory Risks
- Global regulatory frameworks continue to evolve with varying approaches across jurisdictions, potentially affecting both assets differently based on their categorization as staking infrastructure versus distributed ledger technology platforms, while ETF product availability may subject HBAR to additional securities-related oversight considerations.
VI. Conclusion: Which Is the Better Buy?
📌 Investment Value Summary:
- ECHO Characteristics: Represents early-stage Bitcoin staking infrastructure positioning with institutional backing from firms including GSR, Amber, and Echo, offering exposure to emerging Move ecosystem development, though accompanied by significant liquidity constraints and substantial recent price declines of 79.43% over the past year.
- HBAR Characteristics: Provides exposure to established enterprise-grade hashgraph technology with spot ETF product availability, significantly higher market capitalization of over $4 billion, and stronger trading liquidity, while experiencing a 67.06% decline over the past year amid broader market conditions.
✅ Investment Considerations:
- Novice Investors: May prioritize assets with higher liquidity and established market presence, conducting thorough research on both projects' fundamentals, technology, and market positioning before making allocation decisions in the current extreme fear market environment.
- Experienced Investors: Could evaluate portfolio diversification opportunities across different technology architectures and use cases, considering risk tolerance, liquidity requirements, and long-term outlook on Bitcoin staking infrastructure versus distributed ledger enterprise applications.
- Institutional Investors: May assess strategic positioning based on regulatory clarity, liquidity depth, custody solutions, and alignment with institutional investment mandates, noting the availability of ETF products for HBAR and institutional backing structures for both assets.
⚠️ Risk Disclosure: Cryptocurrency markets exhibit extreme volatility, with both assets experiencing substantial declines over recent periods. This analysis does not constitute investment advice. Market participants should conduct independent research, assess personal risk tolerance, and consider consultation with qualified financial advisors before making investment decisions.
VII. FAQ
Q1: What are the key differences between ECHO and HBAR's technological foundations?
ECHO is Bitcoin staking and liquidity infrastructure built on Move technology, launched in 2025, focusing on providing yield opportunities for BTC ecosystem assets. HBAR, operational since 2020, utilizes hashgraph consensus as a distributed ledger technology designed for fast, secure transactions and decentralized applications. The fundamental difference lies in their architectural approaches: ECHO targets Bitcoin-specific staking solutions within a newer ecosystem, while HBAR provides enterprise-grade distributed ledger infrastructure with an established operational history and broader application scope across various use cases.
Q2: Which asset offers better liquidity for investors?
HBAR demonstrates significantly superior liquidity compared to ECHO. As of February 2, 2026, HBAR recorded a 24-hour trading volume of $5,808,566.66 with a market capitalization of $4,037,134,658.61, while ECHO showed a 24-hour volume of only $54,488.86 with a market cap of $1,297,712. This substantial difference means HBAR investors can execute larger transactions with minimal price impact, while ECHO's limited liquidity may result in higher slippage and difficulty entering or exiting positions, particularly for institutional-sized allocations.
Q3: How have both assets performed during the recent market downturn?
Both assets have experienced significant declines over the past year, though with different magnitudes. ECHO declined 79.43% over the past year and 53.97% over 30 days, currently trading near its all-time low of $0.005544, representing an 86.43% drop from its peak of $0.07526. HBAR declined 67.06% over the past year and 21.42% over 30 days, currently at $0.09388, representing an 83.51% decline from its 2021 peak of $0.569229. While both assets have been significantly impacted by extreme fear market conditions (Fear & Greed Index: 14), HBAR has shown relatively more resilience in recent 30-day performance.
Q4: What institutional backing exists for each project?
ECHO has attracted institutional backing from notable firms including GSR, Amber, and Echo through its capital-raising mechanisms and platform operations. HBAR has achieved a different level of institutional recognition through the launch of spot ETF products on U.S. exchanges, which provides traditional institutional investors with regulated access to the asset. This ETF availability represents a significant milestone in institutional adoption, as it subjects HBAR to securities oversight while providing custody solutions and regulatory clarity that many institutional mandates require, potentially offering broader institutional accessibility compared to ECHO's venture capital-style backing structure.
Q5: What are the projected long-term price trajectories for both assets?
According to baseline predictions, ECHO may range from $0.0084-$0.0131 in 2030 and $0.0149-$0.0162 in 2031, with optimistic scenarios reaching $0.0193 (2030) and $0.0175 (2031), representing potential increases of 109-159% from 2026 levels. HBAR baseline projections suggest $0.154-$0.160 in 2030 and $0.150-$0.183 in 2031, with optimistic scenarios of $0.207 (2030) and $0.270 (2031), indicating potential increases of 70-95% from 2026 levels. These projections depend on factors including institutional capital inflows, ETF developments, ecosystem expansion, and broader macroeconomic conditions, though cryptocurrency market volatility makes long-term predictions inherently uncertain.
Q6: What portfolio allocation strategy might suit different investor profiles?
Conservative investors might consider an allocation of 10-20% ECHO versus 80-90% HBAR, reflecting HBAR's significantly larger market capitalization, established market presence, and superior liquidity profile. Aggressive investors seeking higher-risk exposure could evaluate a 30-40% ECHO versus 60-70% HBAR allocation to gain exposure to emerging Bitcoin staking infrastructure while maintaining substantial positioning in established distributed ledger technology. These suggestions account for the substantial difference in market maturity, liquidity constraints, and volatility profiles between the two assets. All investors should assess personal risk tolerance, liquidity requirements, and investment timeframes before determining appropriate allocations.
Q7: What are the primary risks specific to each asset?
ECHO faces substantial liquidity constraints, heightened price volatility (86.43% decline from peak), dependency on Move ecosystem development and Bitcoin staking adoption, and limited operational history since its 2025 launch. HBAR confronts risks related to network scalability evolution, governance structure development, institutional capital flow dynamics, and potential regulatory implications from ETF product classification. Both assets remain subject to broader cryptocurrency market volatility, regulatory framework evolution across jurisdictions, and macroeconomic conditions including monetary policy shifts and global financial market dynamics that have contributed to current extreme fear sentiment (Fear & Greed Index: 14).
Q8: Should novice investors consider these assets in current market conditions?
Novice investors should approach both assets with significant caution given the extreme fear market environment (Fear & Greed Index: 14) and substantial recent price declines. Priority should be given to comprehensive research on each project's fundamentals, technology architecture, team capabilities, and market positioning before making any allocation decisions. Those new to cryptocurrency investing may benefit from starting with assets demonstrating higher liquidity and established market presence, such as HBAR over ECHO, while maintaining conservative position sizing relative to overall portfolio. Consultation with qualified financial advisors and thorough understanding of cryptocurrency market volatility, custody considerations, and personal risk tolerance remain essential prerequisites before entering positions in either asset.
Share
Content
Introduction: Investment Comparison Between ECHO and HBAR
I. Historical Price Comparison and Current Market Status
II. Core Factors Influencing ECHO vs HBAR Investment Value
III. 2026-2031 Price Prediction: ECHO vs HBAR
IV. Investment Strategy Comparison: ECHO vs HBAR
V. Potential Risk Comparison
VI. Conclusion: Which Is the Better Buy?
VII. FAQ
How to Buy Cryptocurrency


Trending Cryptocurrencies


XZXX: A Comprehensive Guide to the BRC-20 Meme Token in 2025

Bitcoin Fear and Greed Index: Market Sentiment Analysis for 2025
5 ways to get Bitcoin for free in 2025: Newbie Guide

Top Crypto ETFs to Watch in 2025: Navigating the Digital Asset Boom

Bitcoin Market Cap in 2025: Analysis and Trends for Investors
2025 Bitcoin Price Prediction: Trump's Tariffs' Impact on BTC

Bitcoin Dominance and Comprehensive Market Analysis

How do Web2 and Web3 differ?

Comprehensive Overview of the Rapid Growth in Bitcoin DeFi (Decentralized Finance)

What is cryptocurrency wave analysis and how does it work

Best Crypto Exchanges for Beginners: A Review of Leading Platforms