Everything About the Cryptocurrency Fear and Greed Index

Why is an Emotional Index Necessary?
The cryptocurrency market is characterized by high volatility, and investor emotions significantly influence investment decisions. While existing cryptocurrency indices provide abundant predictive data, they fail to measure investor sentiment and the psychological dynamics surrounding the market. The Fear and Greed Index for cryptocurrencies was developed to bridge this gap. It is not merely a financial tool but a market indicator that analyzes emotions and investment psychology.
By understanding market sentiment through this index, traders and investors can identify periods of excessive fear or greed, which often signal potential price reversals. This psychological insight complements traditional technical and fundamental analysis, providing a more holistic view of market conditions.
Understanding the Cryptocurrency Fear and Greed Index
The cryptocurrency Fear and Greed Index is a sophisticated tool used to analyze the thoughts, emotions, and reactions of market participants. It serves as a barometer for collective market sentiment, helping investors understand whether the market is driven by fear-based selling or greed-driven buying.
History and Development
The Fear and Greed Index concept was originally developed by a major financial media outlet in 2012 to measure various emotions and sentiments in the stock market. Later, a cryptocurrency analytics firm adapted this methodology specifically for cryptocurrency analysis. The index analyzes multiple market indicators and assigns a value between 0 and 100, where '0' represents extreme fear and '100' represents extreme greed.
This adaptation recognizes the unique characteristics of cryptocurrency markets, including their 24/7 trading nature, higher volatility compared to traditional markets, and the significant role of social media and online communities in shaping market sentiment. The index has become an essential tool for both retail and institutional investors seeking to understand market psychology.
How the Cryptocurrency Fear and Greed Index is Calculated
The Fear and Greed Index considers several market indicators and distributes data according to predetermined weights, displaying the result as a number between 0 and 100. Understanding these components helps investors appreciate the comprehensive nature of this sentiment measure.
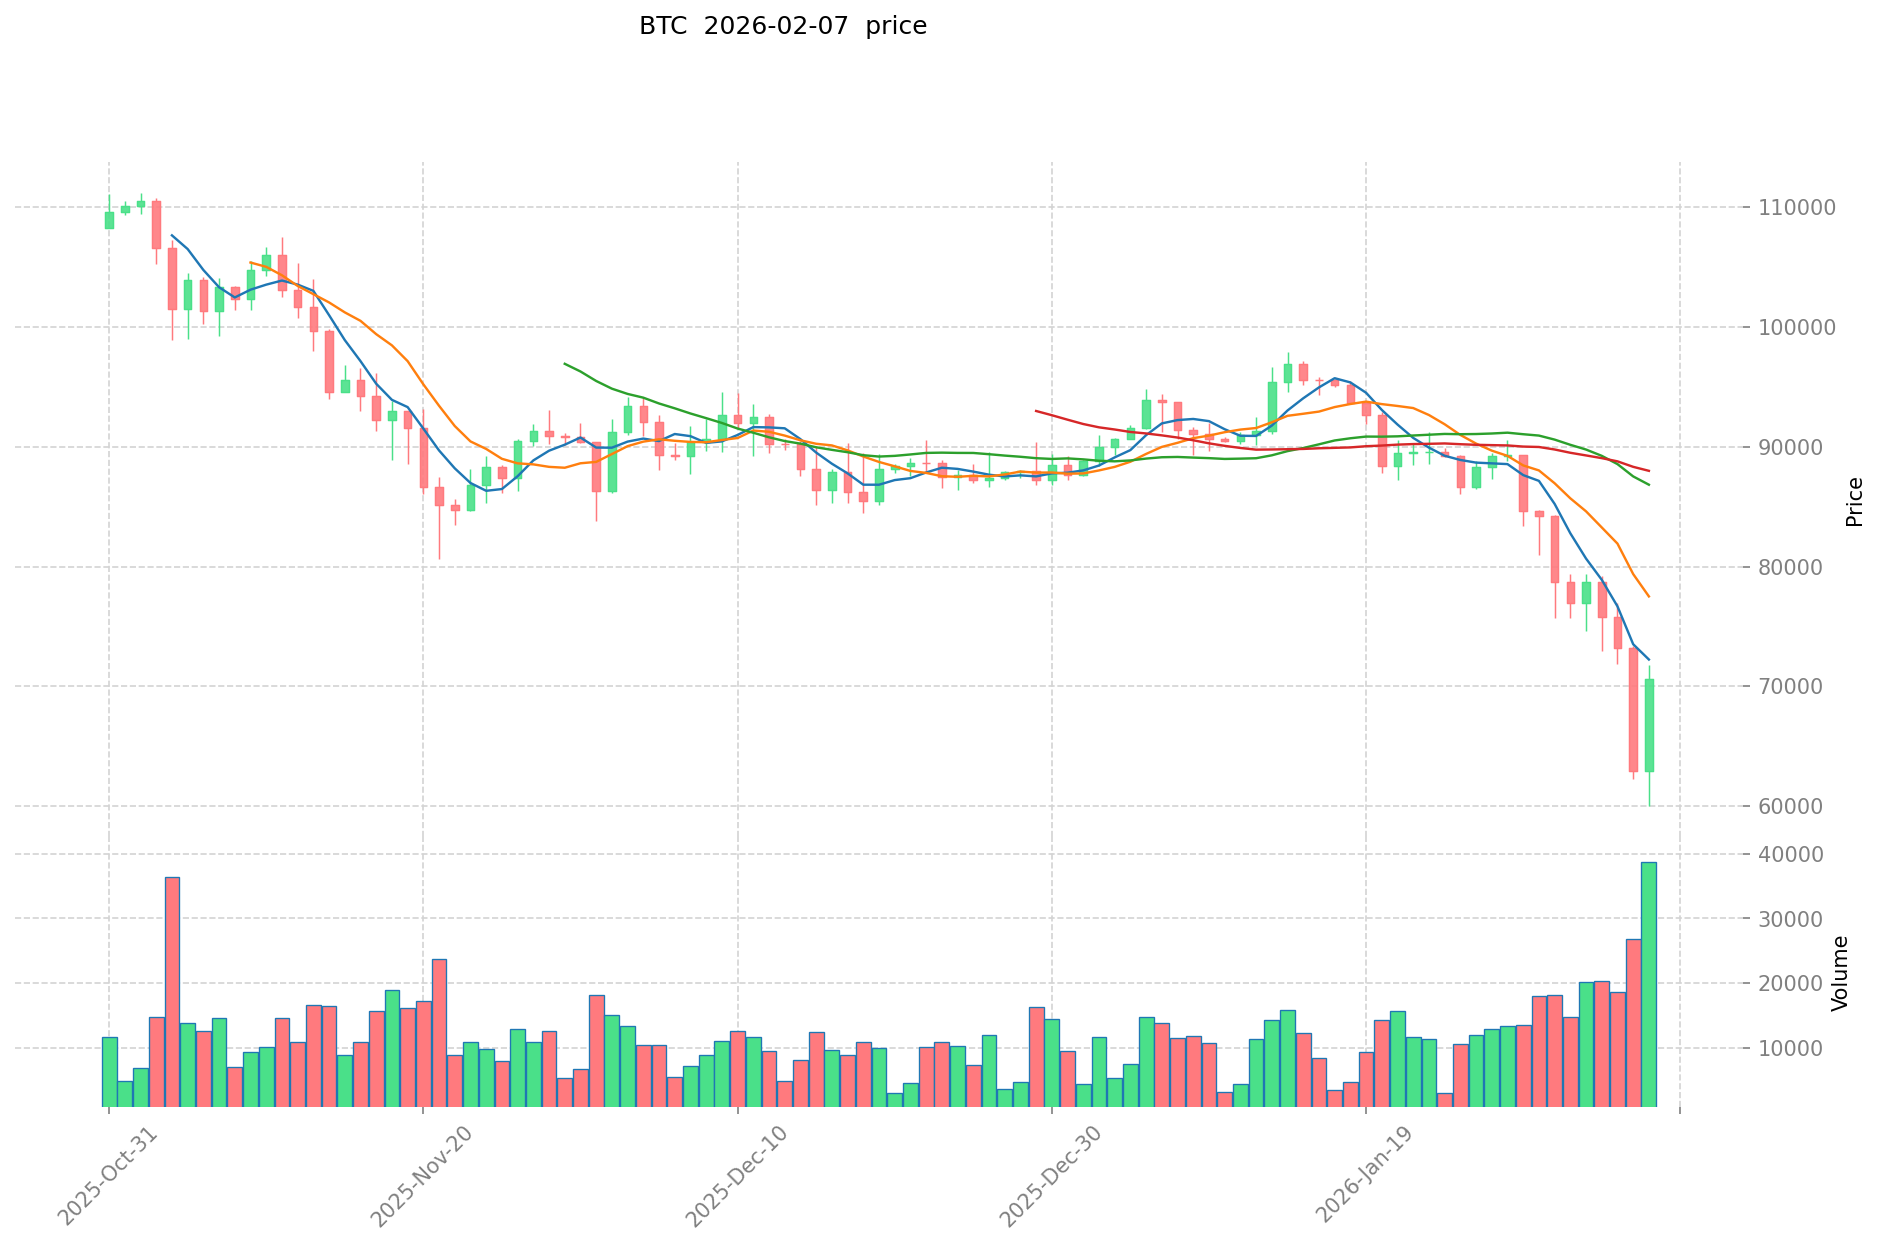
1. Volatility (25% Weight)
Volatility is a core indicator that examines Bitcoin withdrawals and current market fluctuations. High volatility typically instills fear in investors, as rapid price movements create uncertainty and increase risk perception. However, in certain contexts, elevated volatility can also be interpreted as heightened investor enthusiasm and increased trading activity.
 This dual nature makes volatility a nuanced component of the index, requiring careful interpretation within the broader market context.
2. Market Momentum (25% Weight)
This component compares monthly and quarterly trading volume averages to historical norms. High trading volumes generally indicate that greed is dominating the market, as more participants rush to enter positions, fearing they might miss out on potential gains. Conversely, declining volumes often suggest growing caution or fear among market participants. By analyzing momentum trends, the index captures the intensity of market participation and the strength of prevailing trends.
3. Social Media (15% Weight)
Social media analysis measures the quantity and sentiment of cryptocurrency-related posts across various platforms. The index examines hashtags, engagement rates, and social reactions to gauge public interest and emotional tone. In recent years, social media has become increasingly influential in cryptocurrency markets, with viral trends and influential personalities capable of significantly impacting prices. This component recognizes the unique role of online communities in shaping cryptocurrency market dynamics.
4. Bitcoin Dominance (10% Weight)
Bitcoin dominance refers to Bitcoin's market capitalization relative to the total cryptocurrency market. An increase in Bitcoin dominance suggests that greed for altcoins is decreasing, as investors move capital into the perceived safety of Bitcoin. Consequently, when Bitcoin dominance rises, the altcoin market may move toward fear, as participants become more risk-averse. This metric provides insight into risk appetite and capital rotation within the cryptocurrency ecosystem.
5. Trends (10% Weight)
The Fear and Greed Index incorporates search volume data from major search engines to assess public interest in specific cryptocurrencies. Increased search activity typically correlates with heightened interest and potential greed, as more people seek information about entering the market. Declining search volumes may indicate waning interest or growing fear. This component captures the broader public's attention and curiosity about cryptocurrency investments.
Advantages and Disadvantages of the Fear and Greed Index
Advantages:
Comprehensive Market Perspective: The index provides diverse viewpoints on unstable markets by synthesizing multiple data sources, offering a more complete picture than any single indicator could provide alone.
Stability and Trend Identification: The index does not fluctuate rapidly but moves slowly in a specific direction, making it easier to identify sustained trends rather than temporary noise in market data.
Time-Saving Analysis: By incorporating important data such as price volatility, dominance, and search volume into a single metric, the index significantly reduces the time required for comprehensive market analysis.
Valuation Insights: The index provides valuable information when assets are undervalued or in bubble territory, helping investors identify potential buying or selling opportunities based on sentiment extremes.
Balanced Market Outlook: In both bull and bear markets, the index offers a balanced market outlook by quantifying sentiment objectively rather than relying on subjective interpretation.
Risk Detection: By understanding market sentiment, investors can identify dangerous moments when emotions are driving prices to unsustainable levels, either through excessive fear or greed.
Disadvantages:
Limited Long-term Perspective: While the index can capture short-term investment psychology effectively, it does not provide macroscopic perspectives necessary for long-term investment strategies.
Irregular Data Weighting: Volatility and search volume are irregular data types that may not always accurately reflect underlying market conditions, yet they receive substantial weight in the calculation.
Neutral Zone Limitations: When the index is close to neutral values, it provides limited actionable insights, as the market sentiment is balanced and directional signals are weak.
Disconnect from Price Action: The index can experience significant changes without corresponding large price movements, and vice versa, potentially creating confusion for traders relying solely on this metric.
Incomplete Market Factors: The index does not consider whale activity, exchange inflows, trading intensity, and other important factors that can significantly impact market dynamics.
Social Media Reliability: Making investment decisions based on social media mention volume is not recommended as a standalone strategy, as online sentiment can be manipulated or may not reflect actual capital flows.
How Traders Use the Fear and Greed Index
Dividing the Index into Four Zones
Traders typically divide the Fear and Greed Index into four distinct zones, each suggesting different market conditions and potential trading strategies:
Extreme Fear or Orange Zone (0-24): This zone represents extreme fear in the market. It may indicate the best buying opportunity, as assets are potentially oversold, or suggest that a price reversal is imminent. During these periods, panic selling often creates opportunities for contrarian investors who believe the market has overreacted to negative news or price declines.
Fear or Yellow Zone (25-49): This fear zone typically occurs at the beginning of bear markets when prices start to fall sharply. Investor confidence is declining, but the market has not yet reached capitulation levels. Traders should exercise caution in this zone, as further declines are possible before a bottom is established.
Greed or Green Zone (50-74): Prices begin to recover in this zone, and volatility is typically at its lowest. Market confidence is returning, and positive sentiment is building. This zone often represents a transitional period where early adopters of the recovery are being validated, and more cautious investors are beginning to re-enter the market.
Extreme Greed or Dark Green Zone (75-100): This zone occurs when buying activity is at its highest in the market. While strong upward momentum is present, price reversals or corrections may occur as the market becomes overbought. Experienced traders often view extreme greed as a warning signal that the market may be due for a pullback, as euphoria can drive prices beyond sustainable levels.
Can the Fear and Greed Index Be Trusted?
The Fear and Greed Index can be considered reasonably reliable, especially when used in conjunction with technical analysis indicators and other market research tools. It is particularly helpful in understanding short-term investment psychology and market sentiment shifts.
However, investors should recognize its limitations. In bear markets, the index showing 'fear' does not necessarily indicate a bottom has been reached. Markets can remain in fear territory for extended periods during prolonged downturns. Similarly, in bear markets, 'greed' readings may actually trigger selling rather than buying, as traders view temporary rallies as opportunities to exit positions rather than enter new ones.
The index should be viewed as one component of a comprehensive trading strategy rather than a standalone decision-making tool. Successful traders combine sentiment analysis with technical indicators, fundamental research, on-chain metrics, and risk management principles to make informed investment decisions.
Conclusion: Fear and Greed in Cryptocurrency Markets
The cryptocurrency Fear and Greed Index is an excellent tool for predicting overall market sentiment and understanding the psychological factors driving price movements. It provides valuable insights into collective market emotions and can help investors identify potential turning points in market trends.
However, focusing exclusively on this index when conducting investment analysis is not advisable. A more effective approach involves using the Fear and Greed Index to track market sentiment while simultaneously employing on-chain analysis tools, chart indicators, fundamental research, and risk management strategies to analyze the nuances of each investment opportunity.
Successful cryptocurrency investing requires a multifaceted approach that combines sentiment analysis with rigorous technical and fundamental research. By understanding market psychology through the Fear and Greed Index while maintaining discipline in analysis and risk management, investors can better navigate the volatile cryptocurrency markets and make more informed investment decisions. The key is to use this tool as part of a broader analytical framework rather than relying on it as a sole indicator for trading decisions.
FAQ
What is the Cryptocurrency Fear and Greed Index and how is it defined?
The Cryptocurrency Fear and Greed Index is a comprehensive score ranging from 0 to 100 that reflects market sentiment at any given time. It measures the dominant emotion in the crypto market based on multiple data points. Higher values indicate stronger greed, while lower values indicate stronger fear.
How is the Cryptocurrency Fear and Greed Index calculated? What data indicators are included?
The index is calculated using market sentiment data, including trading volume, price volatility, and market participation. It ranges from 0 (extreme fear) to 100 (extreme greed), capturing the three key dimensions of market psychology through weighted indicators that are standardized and linearly scaled to form the final index score.
How to interpret the Fear and Greed Index values? What do 0-100 represent respectively?
The Fear and Greed Index ranges from 0 to 100. Below 50 indicates fear, above 50 indicates greed. 0 represents extreme fear, 100 represents extreme greed. It reflects market sentiment based on volatility, trading volume, social media activity, surveys, and market metrics.
How does the Cryptocurrency Fear and Greed Index help with investment decisions?
The Fear and Greed Index helps investors gauge market sentiment and identify potential turning points. High greed readings may signal overheated markets suitable for taking profits, while extreme fear often indicates buying opportunities. It provides valuable insights into market psychology and trend direction.
What are the accuracy and limitations of the Fear and Greed Index? Can it be completely relied upon for investment decisions?
The Fear and Greed Index reflects overall market sentiment but has limitations. It cannot capture all market details or always predict turning points accurately. Use it as one tool among many in your analysis rather than relying on it completely for investment decisions.
What trends does the Fear and Greed Index typically display across different market cycles?
The Fear and Greed Index typically rises during bullish market phases, peaking at extreme greed levels, then declines during downturns, reaching extreme fear lows. It cyclically reflects investor sentiment swings between market euphoria and panic periods.
Share
Content
Why is an Emotional Index Necessary?
Understanding the Cryptocurrency Fear and Greed Index
How the Cryptocurrency Fear and Greed Index is Calculated
Advantages and Disadvantages of the Fear and Greed Index
How Traders Use the Fear and Greed Index
Can the Fear and Greed Index Be Trusted?
Conclusion: Fear and Greed in Cryptocurrency Markets
FAQ
How to Buy Cryptocurrency


Trending Cryptocurrencies


Bitcoin Fear and Greed Index: Market Sentiment Analysis for 2025

Bitcoin Market Cap in 2025: Analysis and Trends for Investors

How to Mine Ethereum in 2025: A Complete Guide for Beginners

Newbie Must Read: How to Formulate Investment Strategies When Nasdaq Turns Positive in 2025

Best Crypto Wallets 2025: How to Choose and Secure Your Digital Assets
TapSwap Listing Date: What Investors Need to Know in 2025

Comprehensive Guide to HODL Strategy in Cryptocurrency
What is BOOM: A Comprehensive Guide to Understanding the Explosive Growth Phenomenon in Modern Markets
What is the DXY Index, and why should traders and investors keep an eye on it?
What is BDP: A Comprehensive Guide to Big Data Platform and Its Applications in Modern Business

What is Leverage?