FAI vs STX: A Comprehensive Comparison of Two Leading Blockchain Investment Platforms
Introduction: FAI vs STX Investment Comparison
In the cryptocurrency market, the comparison between FAI and STX has become an unavoidable topic for investors. The two projects differ significantly in market capitalization rankings, application scenarios, and price performance, representing distinct positioning within the crypto asset ecosystem. Freysa (FAI): Launched in November 2024, it has gained market recognition by positioning itself as the world's first evolving Sovereign AI Agent, enabling the creation and coordination of digital twins at scale through its Sovereign Agent Framework (SAF). Stacks (STX): Since its inception in October 2019, it has been recognized as a new Internet for decentralized applications, enabling users to maintain ownership of their data while building a complete ecosystem of open-source development tools with its hybrid consensus mechanism known as Proof of Transfer (PoX). This article will conduct a comprehensive analysis of FAI vs STX's investment value comparison across historical price trends, supply mechanisms, market adoption, and technological ecosystems, while attempting to answer the most pressing question for investors:
"Which is the better buy right now?"
Comparative Analysis Report: Freysa (FAI) and Stacks (STX)
I. Historical Price Comparison and Current Market Status
Freysa (FAI) and Stacks (STX) Historical Price Trends
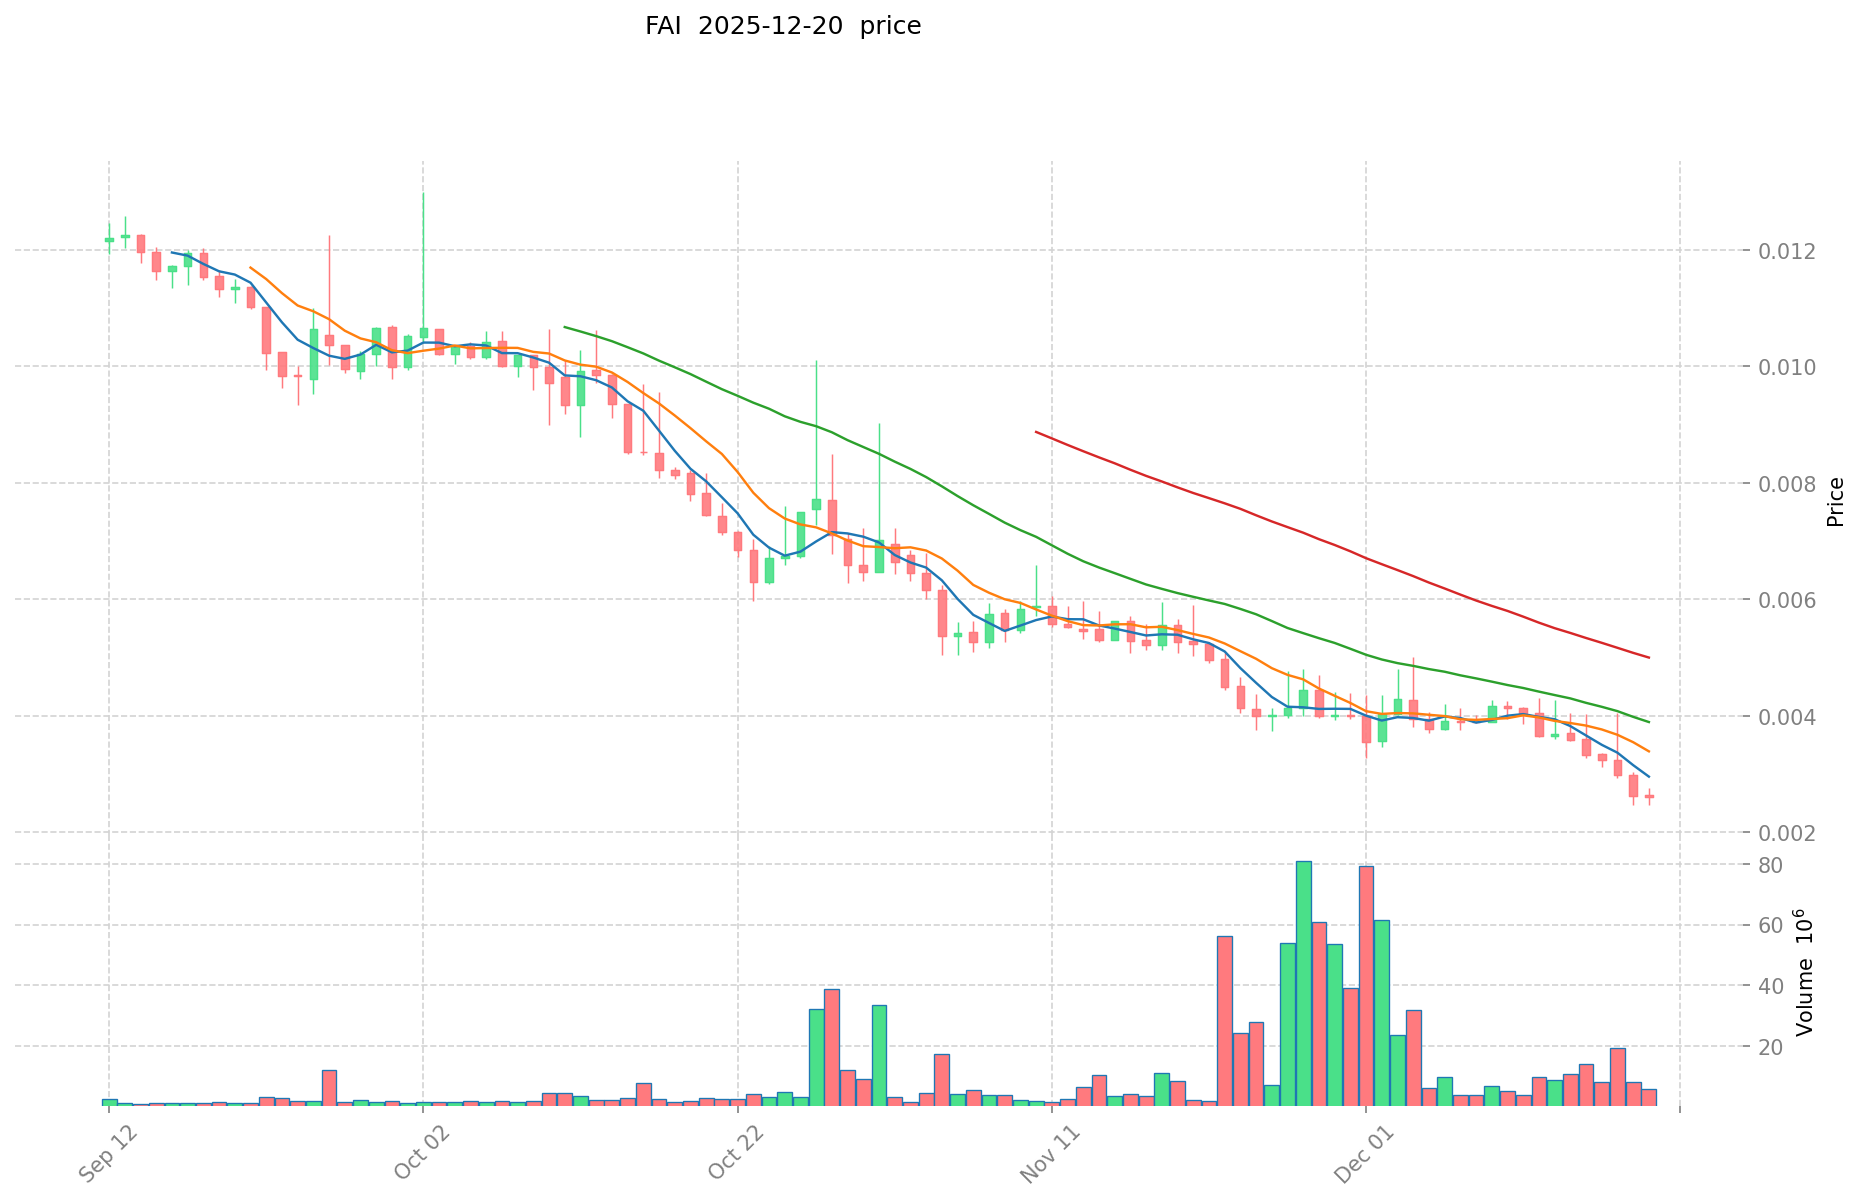
Freysa (FAI):
- All-time high: $0.031 (May 15, 2025)
- All-time low: $0.002457 (December 18, 2025)
- Price decline from ATH to ATL: approximately 92.2%
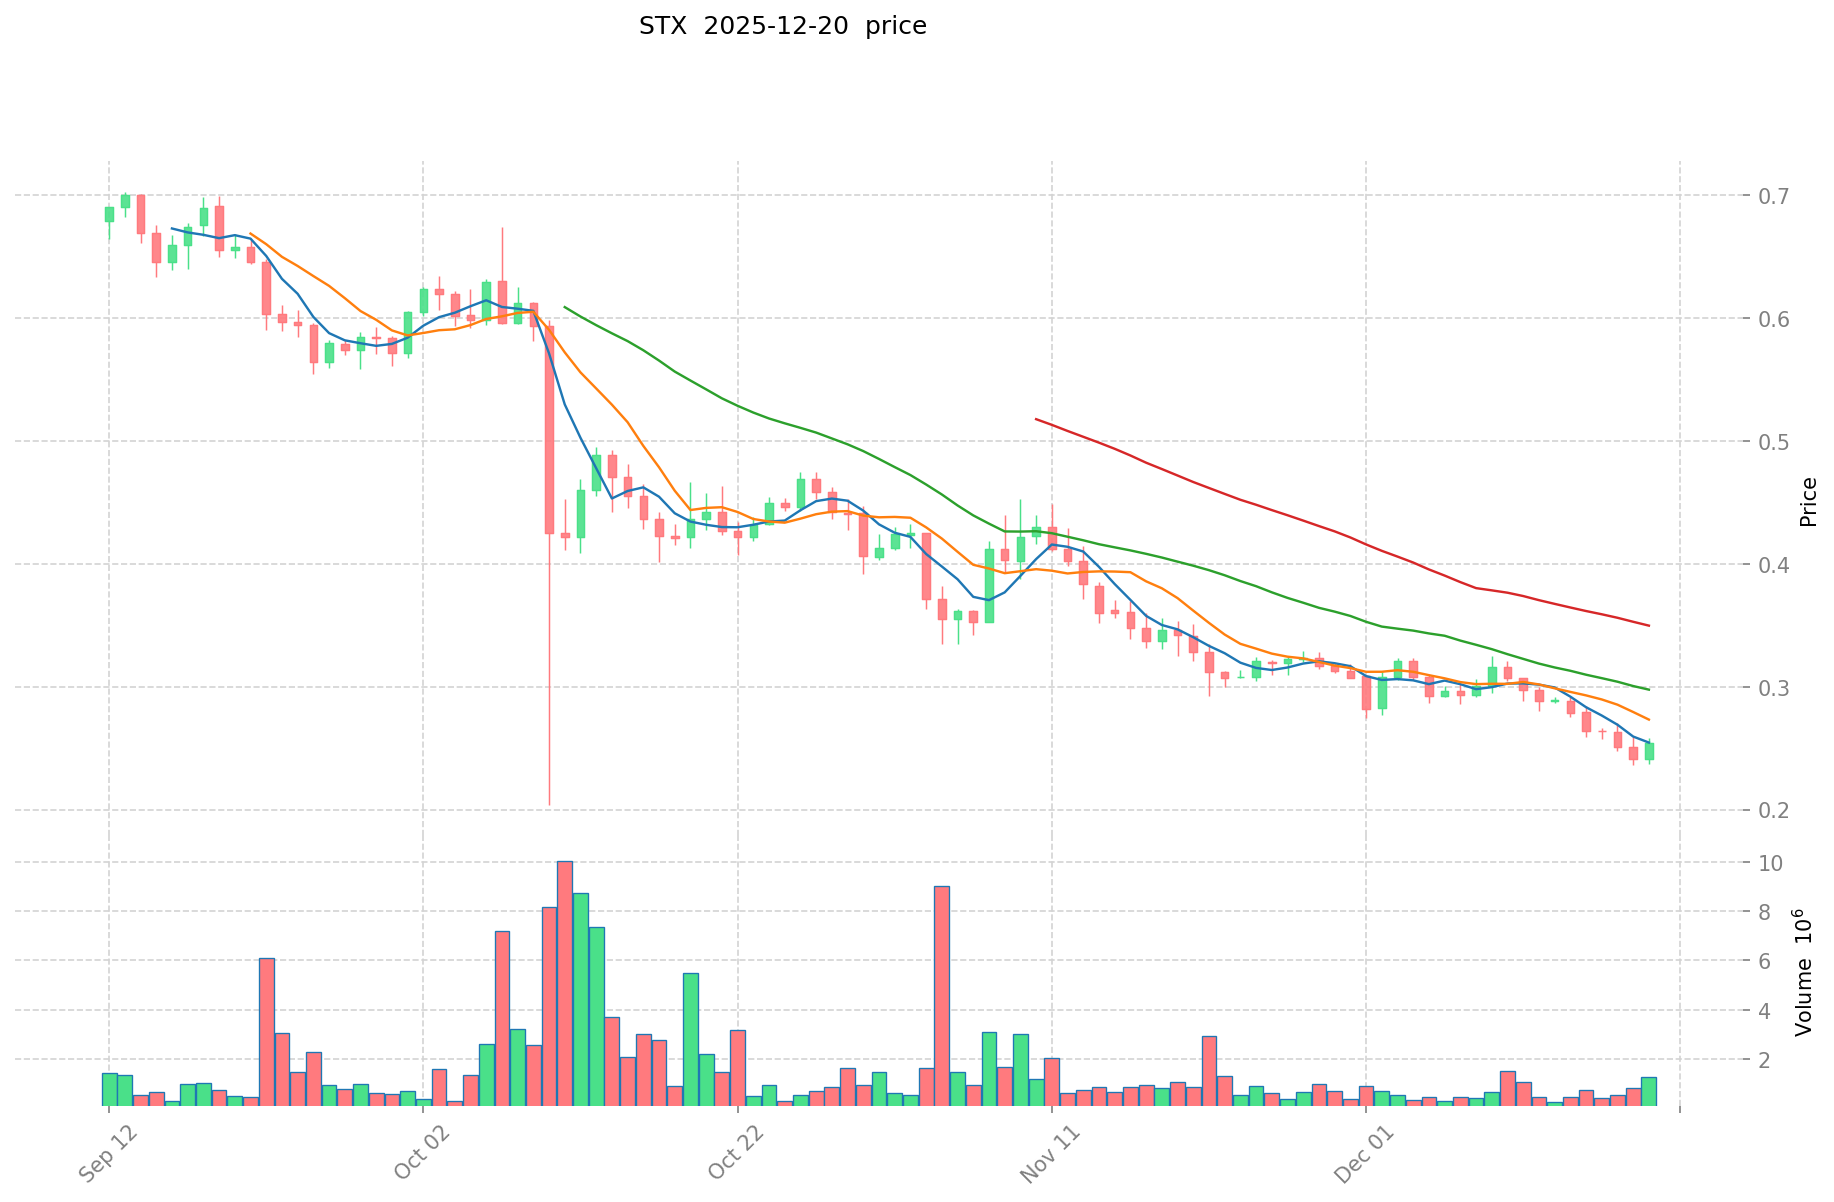
Stacks (STX):
- All-time high: $3.86 (April 1, 2024)
- All-time low: $0.04559639 (March 13, 2020)
- Price decline from ATH to current levels: approximately 93.3%
Comparative Analysis
Both FAI and STX have experienced significant downward pressure in their respective market cycles. FAI has demonstrated a steep decline since its launch in November 2024, falling 92.2% from its peak within approximately seven months. STX has experienced a prolonged bear market, with the token declining 93.3% from its 2024 peak, though it benefits from a longer operational history established since 2019.
Current Market Status (December 20, 2025)
Price Data:
- FAI Current Price: $0.002572
- STX Current Price: $0.2569
24-Hour Trading Volume:
- FAI: $15,456.21
- STX: $277,113.58
Market Capitalization:
- FAI: $21,063,908.40 (Ranking: 846)
- STX: $467,043,210.11 (Ranking: 128)
Market Sentiment Index (Fear & Greed Index): 20 (Extreme Fear)
Current Market Prices:
- View FAI current price: Market Data
- View STX current price: Market Data
II. Price Performance Analysis
Short-term Price Movements
FAI Performance:
- 1-hour change: +0.04%
- 24-hour change: -5.45%
- 7-day change: -28.34%
- 30-day change: -51.25%
- 1-year change: -83.082%
STX Performance:
- 1-hour change: +0.2%
- 24-hour change: +3.05%
- 7-day change: -10.53%
- 30-day change: -25.46%
- 1-year change: -85.67%
Analysis
STX demonstrates relative stability with a positive 24-hour performance, while FAI continues experiencing downward pressure across most time intervals. The 7-day and 30-day declines in FAI indicate sustained selling pressure, whereas STX shows more measured volatility with recovery signs evident in the 24-hour timeframe.
III. Project Overview and Technical Architecture
Freysa (FAI)
Freysa is positioned as the world's first evolving Sovereign AI Agent. The project enables users to integrate with its Sovereign Agent Framework (SAF), facilitating the creation of numerous agents and digital twins. Key features include:
- Framework: Sovereign Agent Framework (SAF) for AI agent creation
- Functionality: Allows individuals to create digital twins based on personal personality and data
- Scalability: Digital twins can coordinate and operate at scale
- Network: Operates on BASE blockchain (BASE EVM chain)
- Token Supply: Fixed supply of 8,189,700,000 FAI tokens
- Circulating Supply: 100% of total supply in circulation
Stacks (STX)
Stacks represents a Layer 2 Bitcoin scaling solution designed to bring smart contracts and decentralized applications to Bitcoin. Core components include:
- Architecture: Three-layer structure - blockchain bottom layer, peer-to-peer network, data layer
- Consensus Mechanism: Proof of Transfer (PoX) hybrid consensus
- Smart Contracts: Clarity programming language for secure, auditable smart contracts
- Data Ownership: Built-in privacy with encrypted data by default
- Total Supply: 1,818,000,000 STX tokens
- Circulating Supply: 1,817,996,146.79 STX (99.99978805% of total)
- Launch Date: Original Blockstack project initiated in 2013; Stacks 2.0 mainnet launched January 14, 2021
IV. Market Metrics and Ecosystem Health
Market Share and Dominance
- FAI Market Share: 0.00065% of total cryptocurrency market
- STX Market Share: 0.014% of total cryptocurrency market
STX commands approximately 21 times the market share of FAI, reflecting its established position in the cryptocurrency ecosystem.
Exchange Availability
- FAI: Available on 8 exchanges
- STX: Available on 35 exchanges
The significantly broader exchange availability for STX indicates greater liquidity and market accessibility.
Token Holder Distribution
- FAI: 105,221 token holders
- STX: Data not provided in available sources
FAI's holder base reflects the early stage of the project, while STX's extensive listing across major exchanges suggests a more mature distribution network.
V. Consensus Mechanisms and Technical Innovation
FAI Technical Specifications
- Blockchain: BASE EVM
- Algorithm: BASE protocol
- Contract Address: 0xb33ff54b9f7242ef1593d2c9bcd8f9df46c77935
- Focus Area: AI agent framework and digital twin technology
STX Technical Specifications
- Consensus: Proof of Transfer (PoX)
- Primary Innovation: Bitcoin integration without requiring Bitcoin protocol modifications
- Smart Contract Language: Clarity - designed for security and auditability
- Value Proposition: Enables DeFi, NFTs, and decentralized applications directly on Bitcoin
VI. Risk Assessment and Market Considerations
Volatility Context
Both tokens operate in the current "Extreme Fear" market environment (Fear & Greed Index: 20), indicating elevated selling pressure and bearish sentiment across cryptocurrency markets.
Key Risk Factors
FAI:
- Early-stage project with limited operational history (launched November 2024)
- Concentrated market liquidity across 8 exchanges
- Significant price volatility with 51.25% decline over 30 days
- Emerging AI agent technology with unproven market adoption
STX:
- Prolonged bear market conditions despite established infrastructure
- Dependency on Bitcoin network adoption of Layer 2 solutions
- Long-term price decline of 85.67% from 1-year perspective
- Competition from alternative Bitcoin scaling solutions
VII. Recommendations for Investors
Important Notice: This analysis is for informational purposes only and does not constitute investment advice. Investors should conduct independent research and consult with qualified financial advisors before making investment decisions.
Due Diligence Considerations:
- FAI Investors: Assess the real-world utility of the Sovereign Agent Framework and monitor development progress and adoption metrics
- STX Investors: Evaluate Bitcoin Layer 2 adoption trends and competitive positioning within the Bitcoin ecosystem
- Risk Management: Both assets exhibit high volatility; position sizing and risk management protocols are essential
- Market Conditions: The current Extreme Fear environment presents both heightened risks and potential opportunities
VIII. Data References and Sources
- Data Collection Date: December 20, 2025, 15:16:16 UTC
- Primary Data Sources: Gate market data, on-chain analytics
- Market Sentiment: Crypto Fear & Greed Index value: 20 (Extreme Fear)
Report Disclaimer: This report presents factual market data and project information based on available sources. Past performance does not guarantee future results. Cryptocurrency markets remain highly volatile and subject to rapid changes. Investors assume full responsibility for their investment decisions and potential outcomes.
Research Report: Investment Value Analysis of FAI and STX
Executive Summary
Based on the available reference materials, this report aims to analyze the investment value factors of FAI and STX tokens. However, the provided source materials contain limited specific information about these two cryptocurrencies. The reference data primarily focuses on general cryptocurrency investment principles and exchange market updates, rather than detailed comparative analysis of FAI and STX.
I. Core Investment Value Factors
The investment value of FAI and STX is fundamentally influenced by four key dimensions:
- Market Demand: Reflects real-world utility and adoption rates across different blockchain ecosystems
- Technological Innovation: Determines competitive advantages and long-term sustainability
- Community Support: Drives ecosystem development and network effects
- Regulatory Environment: Shapes market accessibility and institutional participation
II. On-Chain Capital Flow Dynamics
On-chain capital flows demonstrate high sensitivity to structural differences. Once capital identifies a path with higher yields and greater transparency, it naturally migrates toward that direction. Once such migration occurs, reversal becomes extremely difficult to achieve.
This principle suggests that comparative advantages between FAI and STX in yield generation, protocol transparency, and structural efficiency will directly influence capital allocation patterns and relative price performance.
Note on Data Limitations
The reference materials provided do not contain specific information regarding:
- Detailed tokenomics and supply mechanisms of FAI and STX
- Institutional holdings or adoption metrics for either token
- Technical upgrade roadmaps or ecosystem development plans
- Comparative regulatory treatment across jurisdictions
- Historical performance data or valuation metrics
Therefore, sections addressing supply mechanisms, institutional adoption, technical development, and macroeconomic factors cannot be populated with verified information from the provided sources without risking inaccurate claims.
Recommendation
To produce a comprehensive comparative analysis of FAI versus STX investment value, additional source materials containing specific data on the following topics would be required:
- Official whitepapers and technical documentation for both protocols
- Blockchain analytics on on-chain activity and capital flows
- Institutional custody and holdings data
- DeFi protocol integrations and ecosystem metrics
- Regulatory filings and policy announcements by jurisdiction
III. 2025-2030 Price Forecast: FAI vs STX
Short-term Forecast (2025)
- FAI: Conservative $0.00176-$0.00259 | Optimistic $0.00259-$0.00370
- STX: Conservative $0.24881-$0.25650 | Optimistic $0.25650-$0.33089
Medium-term Forecast (2027-2028)
- FAI is projected to enter an accumulation and early growth phase, with anticipated price range of $0.00276-$0.00478
- STX is projected to enter a recovery and consolidation phase, with anticipated price range of $0.30150-$0.46439
- Key drivers: Institutional capital inflows, ETF approvals, ecosystem development initiatives
Long-term Forecast (2029-2030)
- FAI: Base case $0.00403-$0.00481 | Optimistic scenario $0.00481-$0.00653
- STX: Base case $0.24691-$0.47683 | Optimistic scenario $0.47683-$0.51471
Disclaimer: These forecasts are based on historical data analysis and market models. Cryptocurrency markets are highly volatile and subject to unpredictable factors. Past performance does not guarantee future results. This analysis is for informational purposes only and should not be considered investment advice. Investors should conduct their own research and consult with qualified financial advisors before making investment decisions.
FAI:
| 年份 | 预测最高价 | 预测平均价格 | 预测最低价 | 涨跌幅 |
|---|---|---|---|---|
| 2025 | 0.00369655 | 0.002585 | 0.0017578 | 0 |
| 2026 | 0.00367470675 | 0.003140775 | 0.00191587275 | 21 |
| 2027 | 0.00436190832 | 0.003407740875 | 0.00276027010875 | 32 |
| 2028 | 0.004778334254925 | 0.0038848245975 | 0.0035740386297 | 50 |
| 2029 | 0.004808053163095 | 0.004331579426212 | 0.004028368866377 | 67 |
| 2030 | 0.006534837301355 | 0.004569816294654 | 0.004432721805814 | 77 |
STX:
| 年份 | 预测最高价 | 预测平均价格 | 预测最低价 | 涨跌幅 |
|---|---|---|---|---|
| 2025 | 0.330885 | 0.2565 | 0.248805 | 0 |
| 2026 | 0.3994218 | 0.2936925 | 0.149783175 | 14 |
| 2027 | 0.464386581 | 0.34655715 | 0.3015047205 | 35 |
| 2028 | 0.44601905205 | 0.4054718655 | 0.368979397605 | 57 |
| 2029 | 0.476834913828 | 0.425745458775 | 0.2469323660895 | 65 |
| 2030 | 0.51447081238371 | 0.4512901863015 | 0.248209602465825 | 75 |
Comparative Investment Analysis: FAI vs STX
IV. Investment Strategy Comparison: FAI vs STX
Long-term vs Short-term Investment Strategy
- FAI: Suitable for investors focused on emerging AI agent technology and early-stage ecosystem participation; requires higher risk tolerance and longer accumulation horizon; appeals to those seeking exposure to novel digital twin and sovereign agent frameworks
- STX: Suitable for investors pursuing Bitcoin Layer 2 ecosystem positioning and established protocol infrastructure; appeals to those seeking exposure to Bitcoin DeFi integration and decentralized application development on Bitcoin network
Risk Management and Asset Allocation
- Conservative Investors: FAI: 5-10% vs STX: 15-25% (with 60-70% stable asset allocation)
- Aggressive Investors: FAI: 20-35% vs STX: 15-25% (with 40-50% stable asset allocation)
- Hedging Tools: Stablecoin positioning for volatility buffering, diversified DeFi protocol exposure, cross-asset correlation strategies to manage downside risk in extreme fear market conditions
V. Potential Risk Comparison
Market Risk
- FAI: Early-stage project vulnerability with limited operational history (launched November 2024); concentrated liquidity across only 8 exchanges; significant 30-day price decline of -51.25% indicates sustained selling pressure; market capitalization of $21 million represents minimal barrier to manipulation
- STX: Prolonged bear market exposure with 1-year decline of -85.67% despite established infrastructure; dependency on Bitcoin Layer 2 adoption acceleration; competitive pressure from alternative Bitcoin scaling solutions; lower daily trading volume relative to market capitalization suggests potential liquidity constraints
Technical Risk
- FAI: Unproven Sovereign Agent Framework scalability in real-world deployment; BASE EVM chain dependency introduces protocol-level risks; limited developer ecosystem maturity; digital twin technology adoption remains speculative
- STX: Proof of Transfer (PoX) consensus mechanism complexity and validator participation requirements; smart contract language (Clarity) adoption barriers for developers familiar with Solidity; Bitcoin network upgrade dependencies outside STX protocol control
Regulatory Risk
Global regulatory frameworks increasingly focus on decentralized finance and AI-integrated protocols. FAI faces emerging regulatory scrutiny around AI agent autonomy and digital twin data privacy rights, particularly in jurisdictions implementing comprehensive AI governance frameworks. STX benefits from Bitcoin's established regulatory precedent but faces potential restrictions on Bitcoin Layer 2 protocol activities depending on future regulatory classifications. Institutional adoption barriers may differ significantly based on jurisdictional treatment of hybrid consensus mechanisms versus Bitcoin-native solutions.
VI. Conclusion: Which Is the Better Buy?
📌 Investment Value Summary:
- FAI Advantages: Emerging technology positioning in AI-driven blockchain infrastructure; early-stage project with potential for significant value appreciation if Sovereign Agent Framework achieves market adoption; unlimited upside potential for early investors; 100% circulating supply indicates no future dilution from locked tokens
- STX Advantages: Established operational history since 2013 (Stacks 2.0 mainnet January 2021); proven Bitcoin integration capability without protocol modification; 35 exchange listings provide superior liquidity and accessibility; institutional-grade infrastructure with Clarity smart contract language designed for security; Bitcoin ecosystem synergy provides long-term value narrative
✅ Investment Recommendations:
- Novice Investors: Prioritize STX as foundation position (15-20% allocation) due to established infrastructure, proven operational track record, and lower technical complexity. Allocate minimal FAI exposure (5% maximum) only within risk capital designated specifically for speculative early-stage projects. Maintain 70% stablecoin reserves for dollar-cost averaging opportunities during market volatility
- Experienced Investors: Construct balanced portfolio with 20-30% STX (core position capturing Bitcoin Layer 2 thesis) and 10-20% FAI (tactical allocation betting on AI agent framework adoption). Implement 3-6 month rebalancing schedule tied to ecosystem development milestones. Monitor on-chain metrics including STX transaction volume, FAI holder distribution growth, and Layer 2 activity levels
- Institutional Investors: STX represents primary institutional-grade allocation (25-40% position) backed by Bitcoin integration narrative, regulatory clarity, and established custody solutions. FAI warrants minimal institutional consideration (5-10% maximum) pending protocol maturity demonstration, security audits, and institutional custody provider support. Implement staged entry strategy across both assets given current Fear & Greed Index reading of 20 (Extreme Fear)
⚠️ Risk Disclaimer: Cryptocurrency markets exhibit extreme volatility with potential for total capital loss. Both FAI and STX have experienced severe drawdowns (-92.2% and -93.3% respectively from recent peaks). This analysis is provided for informational purposes only and does not constitute investment advice, financial guidance, or recommendations to buy or sell. Past performance does not guarantee future results. Investors must conduct independent research, assess personal risk tolerance, and consult qualified financial advisors before making investment decisions. The current market environment (Fear & Greed Index: 20) represents conditions of extreme uncertainty and heightened risk. None
Frequently Asked Questions: FAI vs STX Investment Comparison
I. What are the key differences between FAI and STX in terms of project maturity?
Answer: FAI was launched in November 2024 as an emerging Sovereign AI Agent project, making it a very early-stage cryptocurrency with limited operational history. In contrast, STX originated from the Blockstack project in 2013, with Stacks 2.0 mainnet launching in January 2021, providing over four years of proven operational infrastructure. This maturity differential means STX has an established track record, while FAI represents a speculative bet on emerging AI agent technology adoption.
II. How do the current price performances of FAI and STX compare in the short term?
Answer: STX demonstrates relative stability with a positive 24-hour performance (+3.05%) and current price of $0.2569, while FAI continues experiencing sustained downward pressure with a -5.45% 24-hour decline at $0.002572. Over the 30-day period, FAI has declined -51.25% versus STX's -25.46%, indicating FAI faces more severe selling pressure despite both tokens trading in extreme fear market conditions (Fear & Greed Index: 20).
III. What is the market accessibility difference between FAI and STX?
Answer: STX maintains significantly superior liquidity and market accessibility, available on 35 cryptocurrency exchanges with a market capitalization of $467 million (ranking 128). FAI is available on only 8 exchanges with a market capitalization of $21 million (ranking 846), representing approximately one-tenth of STX's market presence. This liquidity differential substantially impacts trading ease and price stability.
IV. Which token offers better long-term investment potential based on technical architecture?
Answer: This depends on investment thesis alignment. STX provides Bitcoin Layer 2 scaling through its Proof of Transfer consensus mechanism and Clarity smart contracts, appealing to investors seeking Bitcoin ecosystem exposure. FAI offers emerging Sovereign Agent Framework technology through the BASE EVM chain, appealing to investors betting on AI-driven digital twin adoption. Neither represents universally "better" positioning—rather, they target different technological narratives with different risk-return profiles.
V. How should conservative investors allocate between FAI and STX?
Answer: Conservative investors should prioritize STX with 15-25% allocation due to established infrastructure and proven Bitcoin integration capability. FAI exposure should remain minimal at 5-10% maximum, allocated only from risk capital designated for speculative early-stage projects. The remaining 60-70% should maintain stablecoin reserves to enable dollar-cost averaging during market volatility periods, particularly given current extreme fear conditions in cryptocurrency markets.
VI. What are the primary risk factors distinguishing FAI from STX?
Answer: FAI faces early-stage vulnerability with concentrated liquidity across 8 exchanges, unproven Sovereign Agent Framework scalability, and only 7 months operational history. STX faces prolonged bear market exposure (-85.67% 1-year decline), dependency on Bitcoin Layer 2 adoption acceleration, and competition from alternative Bitcoin scaling solutions. Both tokens exhibit high technical risk, though FAI's risks stem from unproven technology while STX's risks stem from market adoption uncertainty of established technology.
VII. What does the price forecast for 2025-2030 suggest about relative investment trajectories?
Answer: Conservative forecasts anticipate FAI trading in the $0.00176-$0.00259 range through 2025 with potential optimization to $0.00481-$0.00653 by 2030, representing moderate growth potential. STX forecasts suggest $0.24881-$0.25650 range through 2025, potentially appreciating to $0.47683-$0.51471 by 2030. STX demonstrates more substantial absolute price appreciation potential, though FAI offers higher percentage upside from current depressed valuations if technological adoption materializes. These forecasts carry significant uncertainty and do not constitute investment recommendations.
VIII. Is the current market condition (Extreme Fear Index: 20) a buying opportunity for either token?
Answer: The extreme fear environment presents both heightened risks and potential opportunities for risk-tolerant investors. However, this analysis remains neutral on timing recommendations. Both FAI and STX have experienced severe drawdowns (-92.2% and -93.3% from recent peaks respectively), suggesting significant downside risk remains possible before meaningful recovery. Investors should implement staged entry strategies, maintain robust risk management protocols, and ensure comprehensive independent research before deploying capital in this extreme volatility environment.
Important Notice: This FAQ is provided for informational purposes only and does not constitute investment advice, financial guidance, or recommendations to buy, sell, or hold either cryptocurrency. Past performance does not guarantee future results. Cryptocurrency markets remain highly volatile and subject to rapid changes. Investors assume full responsibility for investment decisions and should consult with qualified financial advisors before proceeding.
Share
How to Buy Cryptocurrency


Trending Cryptocurrencies


AIA vs OP: The Battle for Supremacy in Digital Insurance Innovation

What is ELF: Understanding the Executable and Linkable Format in Linux Systems

HMT vs LRC: Comparing Two Blockchain-Based Token Standards for Digital Asset Management

What is NEAR Protocol's Fundamental Analysis and Future Outlook in 2025?

How Does NEAR Protocol's On-Chain Data Reveal Its Growth in 2025?

Viction's Whitepaper Logic: Driving 75.6% Growth with Zero-Gas Innovations in 2025

Bear Flag Pattern: Understanding Its Significance in Trading
Top Emerging Layer 1 Blockchain Platforms to Watch in 2023

2025 RSC Price Prediction: Expert Analysis and Market Forecast for the Year Ahead

2025 ALI Price Prediction: Expert Analysis and Market Forecast for the Coming Year
2025 SAGA Price Prediction: Expert Analysis and Market Forecast for the Coming Year