GORK vs OP: The Ultimate Comparison of Two Competing Protocols in Modern Technology

Introduction: Investment Comparison Between GORK and OP
In the cryptocurrency market, the comparison between GORK vs OP has consistently been a topic of interest for investors. The two differ significantly in market capitalization ranking, application scenarios, and price performance, representing distinct positioning within the crypto asset landscape.
GORK (GORK): Launched in 2025, this meme coin on the Solana blockchain draws inspiration from xAI's Grok AI chatbot, gaining attention through humorous social media interactions and community engagement.
OP (OP): Since its introduction in 2022, Optimism has been recognized as a low-cost, high-speed Ethereum Layer 2 blockchain solution, primarily serving as a governance token within its ecosystem.
This article will provide a comprehensive analysis of the investment value comparison between GORK vs OP, examining historical price trends, supply mechanisms, institutional adoption, technical ecosystems, and future projections, while addressing the question that concerns investors most:
"Which is the better buy right now?"
I. Historical Price Comparison and Current Market Status
Price Trends of GORK (Coin A) and OP (Coin B)
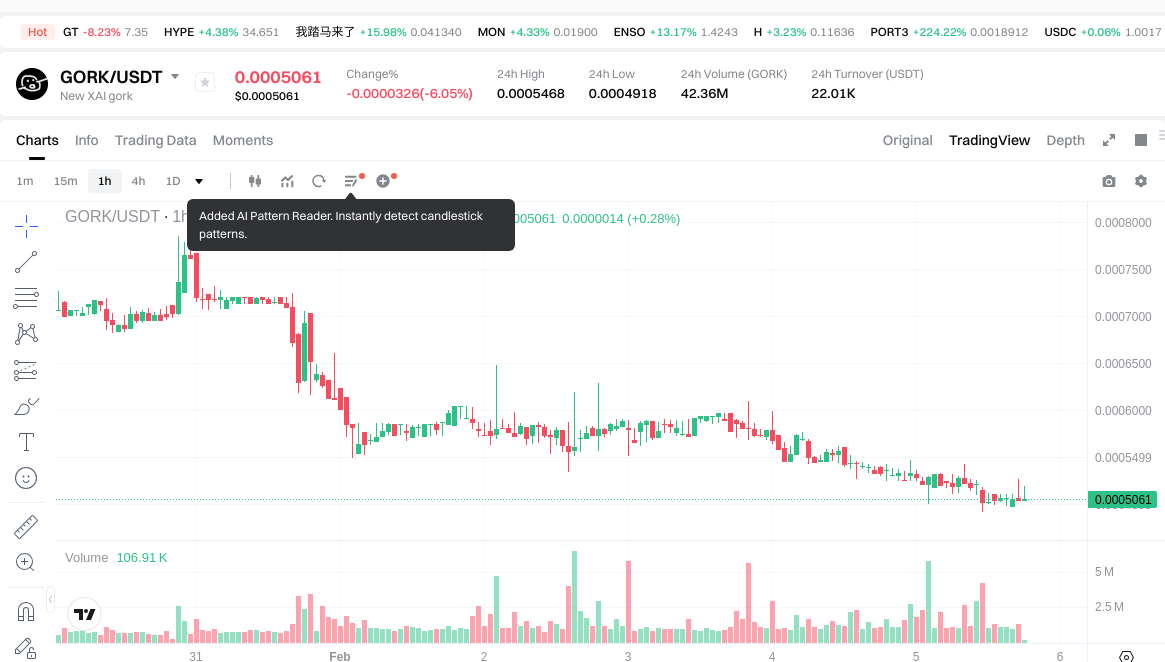
- 2025: GORK experienced significant volatility following its launch on the Solana blockchain, with the price declining from its all-time high of $0.0955 (reached on May 4, 2025) to lower levels as market momentum shifted.
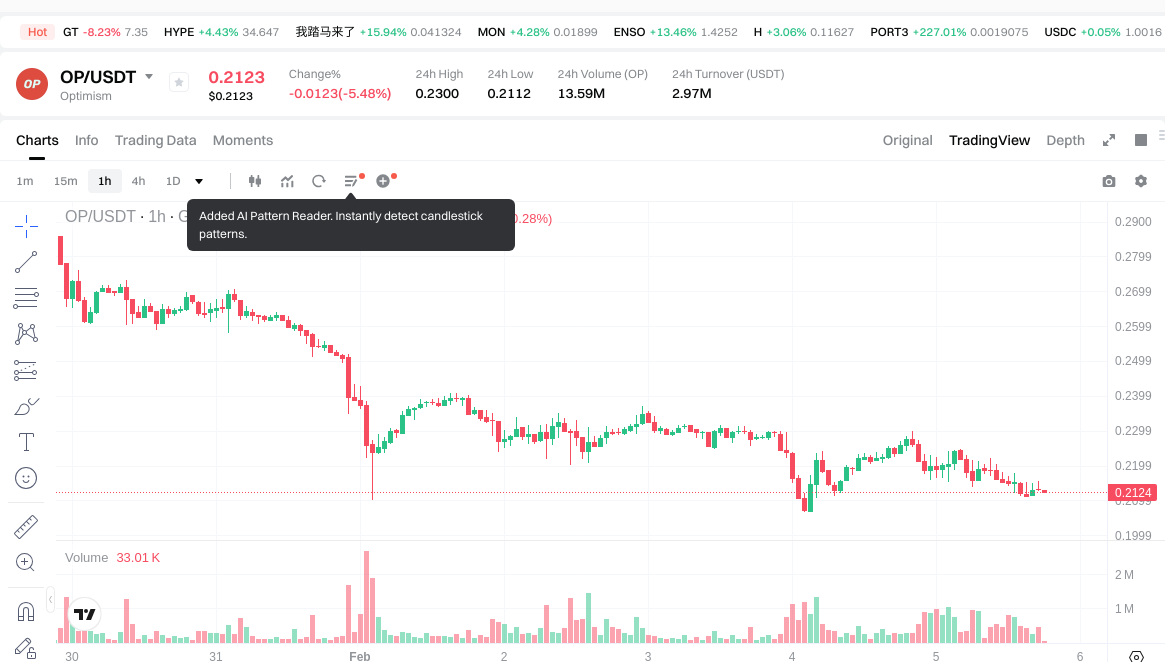
- 2024: OP was impacted by the broader Layer 2 ecosystem development and Ethereum scaling narrative, with the price reaching an all-time high of $4.84 on March 6, 2024, before entering a prolonged correction phase.
- Comparative Analysis: During the 2024-2026 market cycle, GORK fluctuated from $0.0955 to $0.0004918, while OP declined from $4.84 to $0.207182, reflecting different degrees of market correction across meme tokens and infrastructure projects.
Current Market Situation (February 5, 2026)
- GORK Current Price: $0.0005196
- OP Current Price: $0.2123
- 24-Hour Trading Volume: GORK $22,048 vs OP $2,977,769
- Market Sentiment Index (Fear & Greed Index): 12 (Extreme Fear)
View real-time prices:
- Check GORK current price Market Price
- Check OP current price Market Price
II. Core Factors Influencing GORK vs OP Investment Value
Supply Mechanism Comparison (Tokenomics)
- GORK: The supply mechanism and scarcity characteristics represent key factors in evaluating its investment attributes. Market analyses suggest that token distribution models may influence price dynamics over different time horizons.
- OP: Supply-related parameters, including emission schedules and allocation frameworks, form part of the broader tokenomics structure that market participants consider when assessing value propositions.
- 📌 Historical Pattern: Supply mechanisms have historically contributed to cyclical price movements in digital asset markets, though outcomes vary significantly across different projects and market conditions.
Institutional Adoption and Market Application
- Institutional Holdings: Market acceptance and institutional participation levels differ between assets, with various factors influencing professional investor preferences.
- Enterprise Adoption: Both assets occupy distinct positions in terms of real-world applications. Adoption patterns in cross-border transactions, settlement systems, and portfolio allocation strategies reflect varying use cases and market maturity levels.
- Regulatory Landscape: Different jurisdictions maintain diverse regulatory approaches toward digital assets, which may affect market accessibility and institutional participation for both GORK and OP.
Technology Development and Ecosystem Building
- GORK Technology Development: Technical features and development roadmaps represent considerations for evaluating long-term viability, though specific technical specifications require ongoing assessment.
- OP Technology Evolution: Infrastructure development and protocol improvements form part of the broader ecosystem advancement narrative that market participants monitor.
- Ecosystem Comparison: The presence and activity levels across DeFi protocols, NFT platforms, payment solutions, and smart contract implementations vary between the two assets, reflecting different stages of ecosystem maturity and use case focus.
Macroeconomic Environment and Market Cycles
- Performance in Inflationary Contexts: Digital assets exhibit varying characteristics during different macroeconomic conditions, with market participants evaluating relative positioning based on multiple factors.
- Macroeconomic Policy Impact: Interest rate policies, currency strength indicators, and monetary policy shifts represent external variables that may influence digital asset valuations across the broader market.
- Geopolitical Considerations: Cross-border transaction demand patterns and international developments may affect adoption trajectories and market sentiment for digital assets operating in global markets.
III. 2026-2031 Price Prediction: GORK vs OP
Short-term Prediction (2026)
- GORK: Conservative $0.000368 - $0.000519 | Optimistic $0.000519 - $0.000649
- OP: Conservative $0.168 - $0.212 | Optimistic $0.212 - $0.291
Mid-term Prediction (2028-2029)
- GORK may enter a gradual accumulation phase, with estimated price range of $0.000603 - $0.001164
- OP may enter a consolidation and expansion phase, with estimated price range of $0.158 - $0.364
- Key drivers: institutional capital inflows, ETF adoption, ecosystem development
Long-term Prediction (2030-2031)
- GORK: Baseline scenario $0.000795 - $0.001045 | Optimistic scenario $0.001045 - $0.001348
- OP: Baseline scenario $0.289 - $0.361 | Optimistic scenario $0.361 - $0.398
Disclaimer
GORK:
| Year | Predicted High Price | Predicted Average Price | Predicted Low Price | Price Change |
|---|---|---|---|---|
| 2026 | 0.000648625 | 0.0005189 | 0.000368419 | 2 |
| 2027 | 0.000741378375 | 0.0005837625 | 0.00052538625 | 15 |
| 2028 | 0.00095410143 | 0.0006625704375 | 0.000602939098125 | 30 |
| 2029 | 0.0011640037446 | 0.00080833593375 | 0.000646668747 | 59 |
| 2030 | 0.001104510219876 | 0.000986169839175 | 0.000956584743999 | 94 |
| 2031 | 0.001348488638087 | 0.001045340029525 | 0.000794458422439 | 106 |
OP:
| Year | Predicted High Price | Predicted Average Price | Predicted Low Price | Price Change |
|---|---|---|---|---|
| 2026 | 0.290851 | 0.2123 | 0.167717 | 0 |
| 2027 | 0.294343335 | 0.2515755 | 0.17107134 | 18 |
| 2028 | 0.292066576725 | 0.2729594175 | 0.2292859107 | 28 |
| 2029 | 0.364441766275125 | 0.2825129971125 | 0.158207278383 | 32 |
| 2030 | 0.397877179483389 | 0.323477381693812 | 0.236138488636483 | 52 |
| 2031 | 0.37871114461803 | 0.3606772805886 | 0.28854182447088 | 69 |
IV. Investment Strategy Comparison: GORK vs OP
Long-term vs Short-term Investment Strategies
- GORK: May appeal to investors with higher risk tolerance seeking exposure to meme token narratives and community-driven projects, with emphasis on short-to-medium term positioning given market volatility patterns
- OP: May suit investors focusing on Layer 2 infrastructure development and Ethereum ecosystem expansion, with consideration for both medium and long-term holding strategies aligned with blockchain scaling narratives
Risk Management and Asset Allocation
- Conservative Investors: GORK 5-10% vs OP 15-25% (within digital asset allocation)
- Aggressive Investors: GORK 15-25% vs OP 30-40% (within digital asset allocation)
- Hedging Instruments: stablecoin reserves, portfolio diversification across asset categories, position sizing strategies
V. Potential Risk Comparison
Market Risk
- GORK: Exposure to meme token sector volatility, liquidity depth considerations, and sentiment-driven price movements characteristic of community-focused projects
- OP: Subject to Layer 2 competitive landscape dynamics, Ethereum ecosystem developments, and broader infrastructure token market cycles
Technical Risk
- GORK: Network dependency factors, smart contract security considerations, and platform-related technical variables
- OP: Scalability implementation progress, protocol upgrade execution, network security parameters, and infrastructure development risks
Regulatory Risk
- Evolving regulatory frameworks across jurisdictions may affect market accessibility, institutional participation, and operational parameters for both assets, with different implications based on asset classification and use case positioning
VI. Conclusion: Which Is the Better Buy?
📌 Investment Value Summary:
- GORK Characteristics: Community engagement model, meme token sector positioning, early-stage project dynamics with elevated volatility profiles
- OP Characteristics: Layer 2 infrastructure positioning, Ethereum ecosystem integration, governance token utility within established protocol framework
✅ Investment Considerations:
- Novice Investors: Consider starting with smaller position sizes, prioritize understanding project fundamentals, and maintain diversified exposure across multiple asset categories
- Experienced Investors: Evaluate risk-adjusted return profiles relative to portfolio objectives, consider correlation characteristics with existing holdings, and implement appropriate position sizing based on conviction levels
- Institutional Investors: Assess regulatory compliance frameworks, liquidity parameters, custodial infrastructure availability, and alignment with institutional investment mandates
⚠️ Risk Disclosure: Cryptocurrency markets exhibit significant volatility. This content does not constitute investment advice, financial guidance, or recommendations for specific investment actions.
VII. FAQ
Q1: What is the main difference between GORK and OP in terms of their core function?
GORK is a meme token on the Solana blockchain inspired by xAI's Grok AI chatbot, primarily driven by community engagement and social media interactions, while OP serves as a governance token for Optimism, an Ethereum Layer 2 scaling solution focused on reducing transaction costs and improving network speed.
GORK represents a community-driven, sentiment-based digital asset in the meme token category, with its value proposition centered around viral marketing and social dynamics. In contrast, OP functions as infrastructure within the Ethereum ecosystem, providing governance rights for protocol decisions and benefiting from Layer 2 adoption trends. Their fundamental purposes—entertainment versus utility—create distinct value propositions for different investor profiles.
Q2: Which asset has shown greater price volatility historically?
GORK has demonstrated significantly higher price volatility, declining from its all-time high of $0.0955 to $0.0005196 (approximately 99.5% decline), while OP declined from $4.84 to $0.2123 (approximately 95.6% decline) over their respective observation periods.
The extreme volatility in GORK reflects typical meme token characteristics, where sentiment-driven rallies and corrections create dramatic price swings. OP's volatility, though substantial, aligns more closely with broader Layer 2 infrastructure tokens and correlates with Ethereum ecosystem developments. Investors should note that GORK's lower price point and market capitalization amplify percentage movements, while OP's larger market presence provides relatively more liquidity depth.
Q3: What are the current trading volume differences between GORK and OP?
As of February 5, 2026, OP's 24-hour trading volume stands at $2,977,769, which is approximately 135 times higher than GORK's trading volume of $22,048.
This substantial difference in trading volume indicates significantly different liquidity profiles between the two assets. OP's higher trading volume suggests greater market participation, easier entry and exit points, and tighter bid-ask spreads for investors. GORK's lower volume reflects its earlier stage, smaller market capitalization, and niche positioning within the meme token sector. Investors should consider these liquidity differences when planning position sizing and exit strategies.
Q4: How do supply mechanisms differ between GORK and OP?
While specific tokenomics details vary, GORK operates within the parameters typical of meme tokens with considerations for distribution models affecting price dynamics, whereas OP follows a structured emission schedule and allocation framework designed for long-term protocol governance and ecosystem development.
Supply mechanisms represent critical factors in evaluating scarcity and value accrual potential. OP's supply design typically incorporates predictable emission schedules aligned with network growth milestones and governance participation incentives. GORK's supply characteristics reflect meme token design priorities that may emphasize community distribution or liquidity provision. Understanding these structural differences helps investors assess potential dilution risks and long-term value sustainability for each asset.
Q5: Which asset is more suitable for conservative versus aggressive investors?
Conservative investors might allocate 5-10% to GORK and 15-25% to OP within their digital asset portfolio, while aggressive investors might consider 15-25% for GORK and 30-40% for OP, based on individual risk tolerance and investment objectives.
These allocation suggestions reflect the distinct risk-return profiles of each asset. GORK's higher volatility and meme token positioning require smaller position sizes even for aggressive portfolios, while OP's infrastructure role and Layer 2 narrative may warrant larger allocations for investors bullish on Ethereum scaling. Conservative investors prioritizing capital preservation should emphasize OP's relatively lower volatility, while aggressive investors seeking asymmetric returns might increase GORK exposure within appropriate risk management frameworks.
Q6: What are the projected price ranges for 2026-2031?
For 2026, GORK's predicted range spans $0.000368-$0.000649, while OP ranges from $0.168-$0.291. By 2031, GORK's estimated range extends to $0.000795-$0.001348, and OP's range reaches $0.289-$0.398.
These projections reflect baseline and optimistic scenarios incorporating factors such as institutional adoption, ecosystem development, and market cycle dynamics. GORK's predictions suggest potential recovery from current levels but remain within relatively modest absolute value ranges, consistent with meme token volatility patterns. OP's projections indicate gradual appreciation aligned with Layer 2 adoption trajectories and Ethereum ecosystem expansion. Investors should view these estimates as reference points rather than guarantees, given cryptocurrency market unpredictability.
Q7: What are the primary risks specific to each asset?
GORK faces elevated risks including meme token sector volatility, liquidity constraints, sentiment-driven price movements, and dependency on sustained community engagement, while OP confronts risks related to Layer 2 competitive dynamics, Ethereum protocol developments, scalability implementation challenges, and infrastructure token market cycles.
Understanding asset-specific risk profiles enables appropriate position sizing and risk management strategies. GORK's risks center on its community-driven nature and meme token categorization, where shifting social media trends or declining engagement can rapidly impact valuations. OP's risks relate to technical execution, competitive positioning among Layer 2 solutions, and broader Ethereum ecosystem health. Both assets face regulatory uncertainty, though potential implications may differ based on their respective classifications and use case positioning.
Q8: How does the current market sentiment affect investment decisions for GORK vs OP?
With the Fear & Greed Index at 12 (Extreme Fear) as of February 5, 2026, both assets operate in a risk-averse market environment that typically suppresses speculative appetite for higher-volatility assets like GORK while potentially creating accumulation opportunities for infrastructure tokens like OP.
Extreme fear conditions historically correlate with market bottoms or consolidation phases, suggesting potential entry points for patient investors with long-term horizons. However, GORK's meme token characteristics make it particularly sensitive to sentiment shifts, requiring careful timing and risk management. OP's infrastructure positioning may provide relatively more stability during fear-dominated markets, as fundamental adoption metrics can partially offset sentiment-driven selling pressure. Investors should align entry strategies with their risk tolerance and market cycle assessment rather than relying solely on sentiment indicators.
Share
Content
Introduction: Investment Comparison Between GORK and OP
I. Historical Price Comparison and Current Market Status
II. Core Factors Influencing GORK vs OP Investment Value
III. 2026-2031 Price Prediction: GORK vs OP
IV. Investment Strategy Comparison: GORK vs OP
V. Potential Risk Comparison
VI. Conclusion: Which Is the Better Buy?
VII. FAQ
How to Buy Cryptocurrency


Trending Cryptocurrencies


2025 SUI coin: price, buying guide, and Staking rewards

How to Buy Crypto: A Step-by-Step Guide with Gate.com

HNT Price in 2025: Helium Network Token Value and Market Analysis

What is SwissCheese (SWCH) and How Does It Democratize Investment?
Cardano (ADA) Price Analysis and Outlook for 2025
How to Invest in Metaverse Crypto
Cryptocurrency for Beginners: Which Coin Should You Invest In
A Comprehensive Overview of the Future Potential and Types of Altcoins
Comprehensive Guide to Decentralized Finance (DeFi)
Mining Calculator: How to Calculate Cryptocurrency Mining Profitability
What is Polygon?