GORK vs QNT: A Comprehensive Comparison of Two Emerging Blockchain Technologies and Their Market Impact
Introduction: Investment Comparison Between GORK and QNT
In the cryptocurrency market, the comparison between GORK vs QNT has become a topic of interest for investors. The two assets show notable differences in market cap ranking, application scenarios, and price performance, representing distinct positioning within the crypto asset landscape.
GORK: Launched in 2025, this meme coin on the Solana blockchain draws inspiration from xAI's Grok AI chatbot, gaining attention through humorous social media interactions and community engagement.
QNT (Quant): Since its launch in 2018, Quant Network has been recognized as a technology provider enabling trusted digital interaction, creating a global blockchain operating system called Overledger to address interoperability challenges across enterprise blockchain adoption.
This article will analyze the investment value comparison between GORK vs QNT through historical price trends, supply mechanisms, institutional adoption, technological ecosystems, and future forecasts, attempting to address investors' most pressing question:
"Which is the better buy right now?"
I. Historical Price Comparison and Current Market Status
GORK (Coin A) and QNT (Coin B) Historical Price Trends
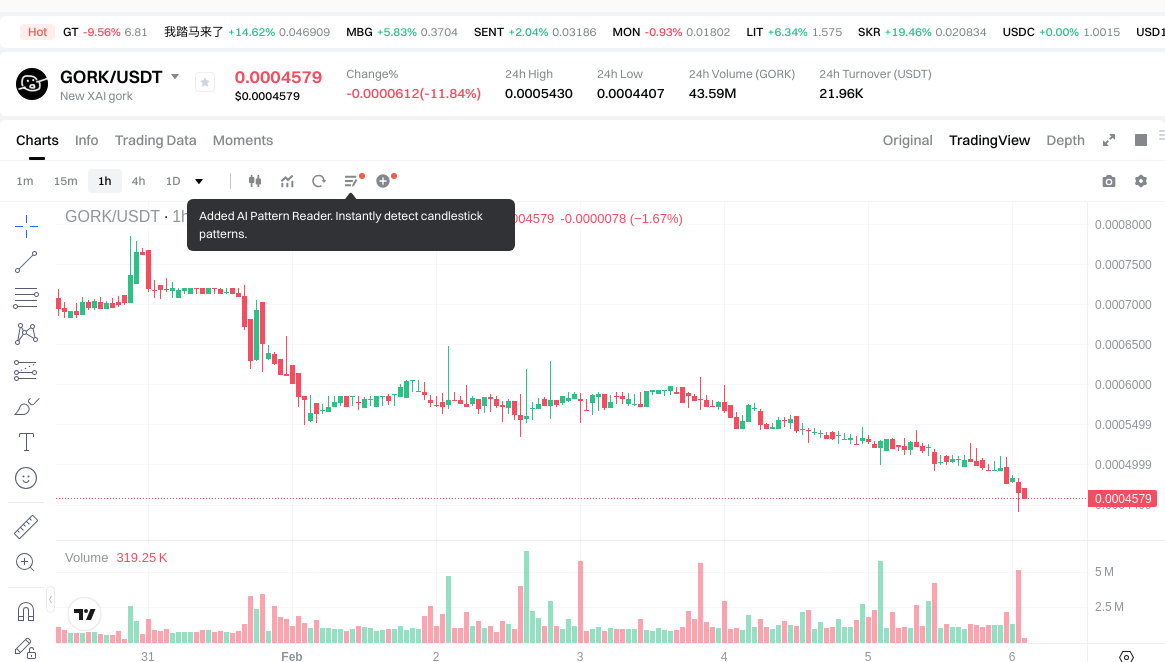
- 2025: GORK launched in April 2025, experiencing rapid growth before reaching an all-time high of $0.0955 on May 4, 2025. However, the token subsequently entered a sharp decline phase.
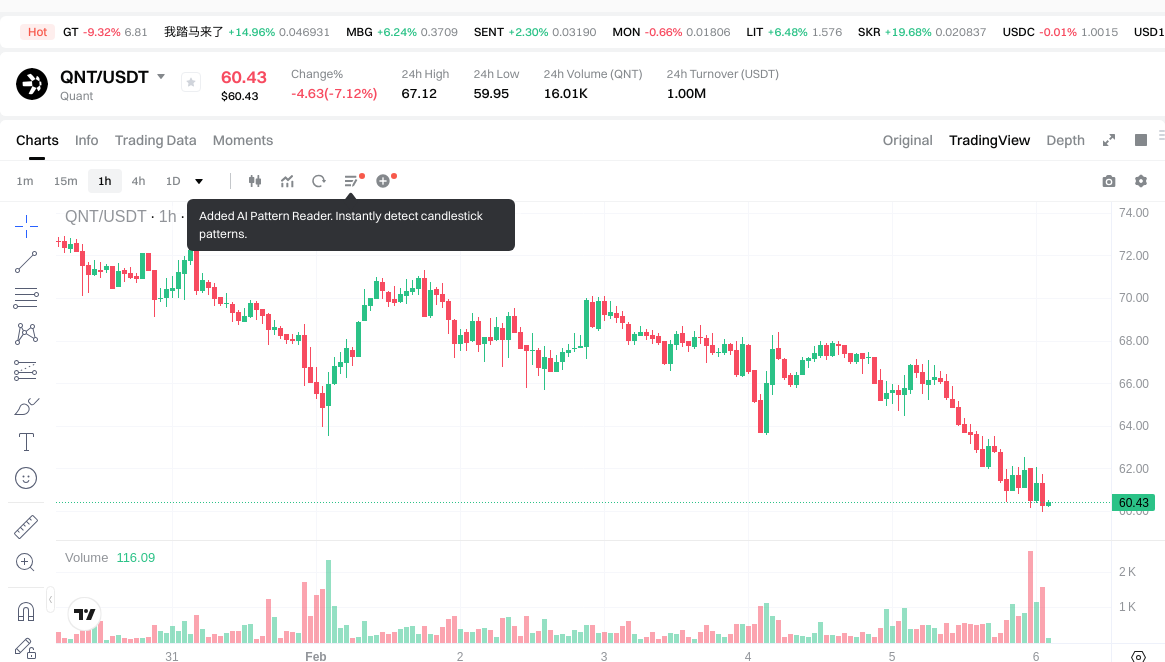
- 2021: QNT recorded its historical peak at $427.42 on September 11, 2021, driven by growing interest in blockchain interoperability solutions. Since then, the token has experienced significant corrections aligned with broader market cycles.
- Comparative Analysis: During recent market volatility, GORK declined from its peak of $0.0955 to a historical low of $0.0004407 recorded on February 5, 2026, representing a decline exceeding 99%. In contrast, QNT decreased from its all-time high of $427.42 to a range around $60-$70, showing approximately 84-86% decline from peak levels, demonstrating relatively more resilient price retention compared to GORK.
Current Market Status (February 6, 2026)
- GORK Current Price: $0.0004568
- QNT Current Price: $60.39
- 24-Hour Trading Volume: GORK recorded $22,039.99 versus QNT at $1,009,851.23, indicating substantially higher liquidity and trading activity for QNT.
- Market Sentiment Index (Fear & Greed Index): 12 (Extreme Fear)
Check real-time prices:
- View GORK current price Market Price
- View QNT current price Market Price
II. Core Factors Influencing GORK vs QNT Investment Value
Tokenomics Comparison
- GORK: Specific supply mechanism details are not provided in available materials.
- QNT: Supply structure information is not disclosed in reference sources.
- 📌 Historical Pattern: Token supply mechanisms can influence price cycles through scarcity dynamics and emission schedules, though specific correlations vary by market conditions.
Institutional Adoption and Market Application
- Institutional Holdings: Data regarding institutional preference between GORK and QNT is not available in provided materials.
- Enterprise Adoption: Information about GORK or QNT applications in cross-border payments, settlement systems, or investment portfolios is not documented in reference sources.
- National Policies: Regulatory stances toward these assets across different jurisdictions are not covered in available materials.
Technical Development and Ecosystem Building
- GORK Technical Upgrades: Reference materials indicate a focus on advanced technological solutions, though specific technical developments are not detailed.
- QNT Technical Development: Materials suggest utilization of social network integration, but comprehensive technical roadmap information is not provided.
- Ecosystem Comparison: Details regarding DeFi, NFT, payment systems, or smart contract implementations for either asset are not available in source materials.
Macroeconomic Factors and Market Cycles
- Performance in Inflationary Environments: Comparative anti-inflation characteristics between GORK and QNT are not documented in available references.
- Macroeconomic Monetary Policy: Specific impacts of interest rates or dollar index movements on these assets are not detailed in provided materials.
- Geopolitical Factors: Information regarding cross-border transaction demand or international situation influences is not available in reference sources.
III. 2026-2031 Price Prediction: GORK vs QNT
Short-term Prediction (2026)
- GORK: Conservative $0.00030 - $0.00046 | Optimistic $0.00056 - $0.00068
- QNT: Conservative $32.58 - $60.34 | Optimistic $60.34 - $74.22
Mid-term Prediction (2028-2029)
- GORK may enter a gradual growth phase, with estimated prices ranging from $0.00045 to $0.00096
- QNT may enter a consolidation and expansion phase, with estimated prices ranging from $46.02 to $96.38
- Key drivers: institutional capital inflows, ETF developments, ecosystem expansion
Long-term Prediction (2030-2031)
- GORK: Baseline scenario $0.00059 - $0.00085 | Optimistic scenario $0.00082 - $0.00093
- QNT: Baseline scenario $46.72 - $91.60 | Optimistic scenario $97.10 - $114.58
Disclaimer
GORK:
| Year | Predicted High Price | Predicted Average Price | Predicted Low Price | Price Change |
|---|---|---|---|---|
| 2026 | 0.000678432 | 0.0004584 | 0.00029796 | 0 |
| 2027 | 0.00077304576 | 0.000568416 | 0.00030694464 | 24 |
| 2028 | 0.0008182916736 | 0.00067073088 | 0.0005432920128 | 46 |
| 2029 | 0.000960419547072 | 0.0007445112768 | 0.000454151878848 | 62 |
| 2030 | 0.000903613336652 | 0.000852465411936 | 0.000818366795458 | 86 |
| 2031 | 0.000930721736751 | 0.000878039374294 | 0.000588286380777 | 92 |
QNT:
| Year | Predicted High Price | Predicted Average Price | Predicted Low Price | Price Change |
|---|---|---|---|---|
| 2026 | 74.2182 | 60.34 | 32.5836 | 0 |
| 2027 | 98.900277 | 67.2791 | 43.058624 | 10 |
| 2028 | 90.567760465 | 83.0896885 | 71.45713211 | 36 |
| 2029 | 96.379884175575 | 86.8287244825 | 46.019223975725 | 43 |
| 2030 | 102.596820848522 | 91.6043043290375 | 46.718195207809125 | 50 |
| 2031 | 114.578663854760105 | 97.10056258877975 | 79.622461322799395 | 60 |
IV. Investment Strategy Comparison: GORK vs QNT
Long-term vs Short-term Investment Strategies
- GORK: May appeal to investors with higher risk tolerance seeking speculative opportunities in emerging meme token sectors, though the asset has demonstrated substantial volatility with decline exceeding 99% from peak levels.
- QNT: May suit investors interested in blockchain interoperability infrastructure and enterprise-focused technological solutions, showing relatively more resilient price retention with approximately 84-86% decline from historical peaks.
Risk Management and Asset Allocation
- Conservative Investors: Consideration may lean toward QNT with higher allocation given its established market presence since 2018 and enterprise-oriented positioning, though specific allocation ratios should align with individual risk profiles and portfolio objectives.
- Aggressive Investors: May consider diversified exposure across both assets while maintaining awareness of GORK's extreme volatility characteristics and QNT's historical price fluctuations.
- Hedging Instruments: Portfolio risk management may incorporate stablecoin reserves, derivatives positioning, and cross-asset diversification strategies aligned with market conditions.
V. Potential Risk Comparison
Market Risks
- GORK: Exhibits extreme price volatility with historical decline from $0.0955 to $0.0004407, representing over 99% depreciation. Current 24-hour trading volume of $22,039.99 indicates relatively limited liquidity compared to established assets.
- QNT: Experienced substantial correction from $427.42 peak to current levels around $60.39, demonstrating cyclical volatility aligned with broader cryptocurrency market dynamics. Trading volume of $1,009,851.23 suggests comparatively higher market liquidity.
Technical Risks
- GORK: Specific technical infrastructure details regarding network scalability and operational stability are not documented in available materials.
- QNT: Technical risk factors related to network concentration or security vulnerabilities are not detailed in reference sources.
Regulatory Risks
- Regulatory framework developments across different jurisdictions may impact both assets differently, with meme tokens and enterprise blockchain solutions potentially facing distinct compliance considerations and policy approaches.
VI. Conclusion: Which Is the Better Buy?
📌 Investment Value Summary:
- GORK Characteristics: Launched in April 2025 as a Solana-based meme token with community-driven engagement model, though experiencing substantial price decline exceeding 99% from peak levels to current price of $0.0004568.
- QNT Characteristics: Established since 2018 as blockchain interoperability infrastructure provider with Overledger operating system, maintaining market presence through multiple cycles with current price at $60.39 and higher trading volume indicating greater liquidity.
✅ Investment Considerations:
- Novice Investors: May benefit from thorough research and understanding of distinct risk profiles between meme tokens and infrastructure-focused assets before allocation decisions.
- Experienced Investors: Could evaluate portfolio diversification strategies considering historical volatility patterns, liquidity metrics, and technological positioning of each asset.
- Institutional Investors: May assess alignment with investment mandates regarding asset maturity, market capitalization, trading volumes, and technological infrastructure characteristics.
⚠️ Risk Disclosure: Cryptocurrency markets demonstrate extreme volatility characteristics. This content does not constitute investment advice. Market sentiment currently reflects extreme fear conditions with Fear & Greed Index at 12. Individual investment decisions should incorporate comprehensive due diligence, risk assessment, and alignment with specific financial objectives and risk tolerance levels.
VII. FAQ
Q1: What are the main differences between GORK and QNT in terms of market positioning?
GORK is a meme token launched in 2025 on Solana blockchain focused on community engagement, while QNT is an enterprise-grade blockchain interoperability infrastructure established in 2018. GORK represents a speculative, community-driven asset with 24-hour trading volume of $22,039.99, whereas QNT positions itself as a technological solution provider with the Overledger operating system, demonstrating significantly higher liquidity with $1,009,851.23 in daily trading volume. The fundamental distinction lies in their value propositions: GORK derives appeal from social dynamics and meme culture, while QNT focuses on solving enterprise blockchain interoperability challenges.
Q2: How do the historical price performances of GORK and QNT compare?
GORK experienced extreme volatility, declining over 99% from its May 2025 peak of $0.0955 to its February 2026 low of $0.0004407, currently trading at $0.0004568. QNT demonstrated relatively more resilient price retention, declining approximately 84-86% from its September 2021 all-time high of $427.42 to current levels around $60.39. This comparison indicates that QNT has maintained better price stability across market cycles compared to GORK's dramatic depreciation within less than one year of existence.
Q3: What are the projected price ranges for GORK and QNT through 2031?
For GORK, conservative 2026 estimates range from $0.00030-$0.00046, with optimistic scenarios reaching $0.00056-$0.00068. Long-term projections for 2031 suggest baseline prices between $0.00059-$0.00085 and optimistic scenarios of $0.00082-$0.00093. QNT's conservative 2026 predictions range from $32.58-$60.34, with optimistic estimates between $60.34-$74.22. By 2031, baseline scenarios project $46.72-$91.60, while optimistic forecasts reach $97.10-$114.58. These projections reflect distinct growth trajectories influenced by market maturity, technological development, and adoption patterns.
Q4: Which asset is more suitable for conservative versus aggressive investors?
Conservative investors may find QNT more aligned with their risk profiles due to its established market presence since 2018, enterprise-focused positioning, and relatively higher liquidity metrics. QNT's 84-86% decline from peak, while substantial, demonstrates less extreme volatility compared to GORK. Aggressive investors with higher risk tolerance might consider GORK for speculative opportunities in emerging meme token sectors, though they should acknowledge its extreme volatility with over 99% decline from peak levels. Portfolio allocation should incorporate comprehensive risk assessment and alignment with individual financial objectives.
Q5: What are the primary risk factors investors should consider for each asset?
GORK's primary risks include extreme price volatility evidenced by 99%+ depreciation, limited liquidity with $22,039.99 daily trading volume, and uncertain regulatory treatment of meme tokens. QNT faces risks including substantial cyclical volatility demonstrated by historical corrections, potential regulatory developments affecting enterprise blockchain solutions, and market cycle dependencies. Both assets operate within the broader cryptocurrency market currently experiencing extreme fear conditions (Fear & Greed Index at 12), amplifying overall risk exposure across the sector.
Q6: How do current market conditions affect the investment outlook for GORK versus QNT?
Current market sentiment reflects extreme fear with a Fear & Greed Index reading of 12, creating challenging conditions for both assets. GORK's limited trading volume and extreme historical volatility make it particularly vulnerable to adverse market conditions, while QNT's higher liquidity and established market position may provide relatively better resilience during market downturns. The macroeconomic environment, regulatory developments, and institutional adoption patterns will differentially impact these assets based on their distinct positioning as meme token versus enterprise infrastructure solution.
Q7: What role do technological ecosystems play in the investment value comparison?
QNT's value proposition centers on its Overledger operating system designed to address blockchain interoperability challenges for enterprise adoption, positioning it within technological infrastructure development. GORK's ecosystem relies primarily on community engagement and social media dynamics rather than technological innovation. This fundamental distinction suggests different value drivers: QNT's investment case depends on enterprise blockchain adoption and cross-chain functionality demand, while GORK's value correlates with community sentiment, social media trends, and meme token market dynamics.
Q8: How should investors approach portfolio allocation between GORK and QNT?
Portfolio allocation should reflect comprehensive risk assessment and individual investment objectives. Novice investors benefit from thorough research understanding the distinct risk profiles between meme tokens and infrastructure-focused assets before making allocation decisions. Experienced investors could evaluate diversification strategies considering historical volatility patterns, with potential emphasis on QNT for stability-focused portions and limited GORK allocation for speculative exposure if aligned with risk tolerance. Institutional investors should assess alignment with investment mandates regarding asset maturity, market capitalization, and technological infrastructure characteristics before determining appropriate allocation ratios.
Share
Content
Introduction: Investment Comparison Between GORK and QNT
I. Historical Price Comparison and Current Market Status
II. Core Factors Influencing GORK vs QNT Investment Value
III. 2026-2031 Price Prediction: GORK vs QNT
IV. Investment Strategy Comparison: GORK vs QNT
V. Potential Risk Comparison
VI. Conclusion: Which Is the Better Buy?
VII. FAQ
How to Buy Cryptocurrency


Trending Cryptocurrencies


2025 SUI coin: price, buying guide, and Staking rewards

How to Buy Crypto: A Step-by-Step Guide with Gate.com

HNT Price in 2025: Helium Network Token Value and Market Analysis
What is SwissCheese (SWCH) and How Does It Democratize Investment?

Cardano (ADA) Price Analysis and Outlook for 2025

How to Invest in Metaverse Crypto

Hot vs. cold crypto wallets — which is right for you?
APR vs. APY in Crypto Assets: An In-Depth Guide to Their Key Differences

Understanding Demand and Supply Zones in Trading: Comprehensive Guide and Application Strategies

What Are Nodes?

What Is an IDO? Initial DEX Offering Explained