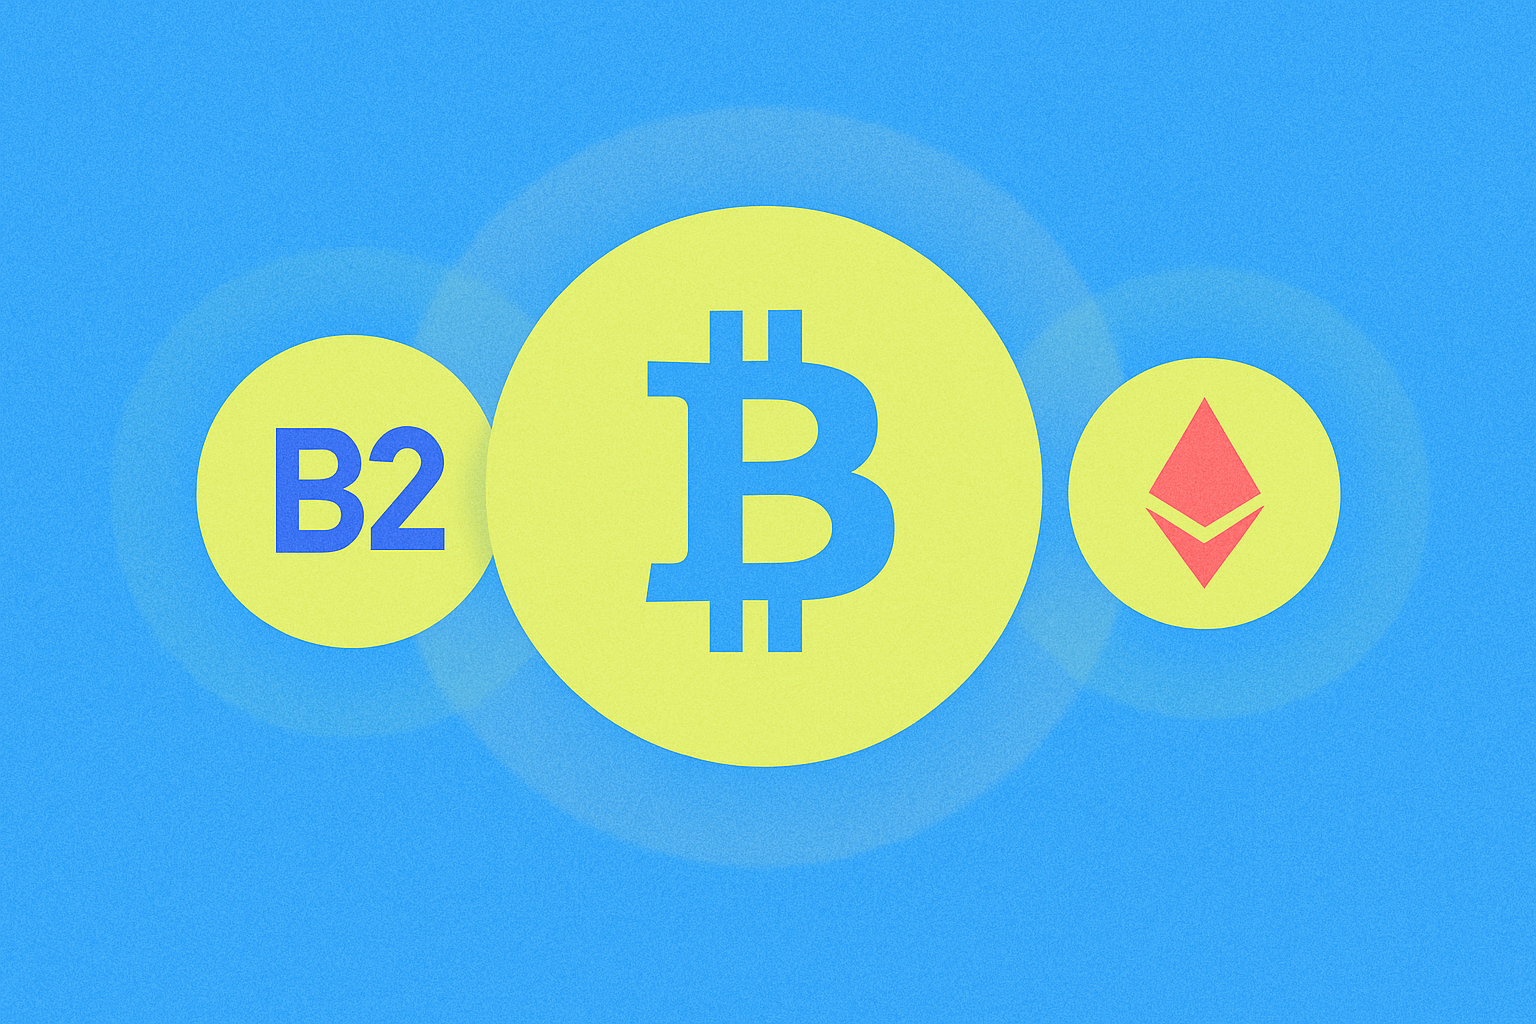
How does B2 price volatility compare to Bitcoin and Ethereum in 2026?

B2 Price Range: Trading Between $0.7995 and $0.85894 in 24 Hours with -3.44% Daily Decline
B2's trading activity over the past 24 hours reveals price dynamics characteristic of moderate cryptocurrency volatility. The asset traded between a low of $0.7995 and a high of $0.85894, representing a range of approximately 7.6%, with the current price positioned at $0.809. This intraday price range illustrates the typical fluctuations traders encounter when monitoring B2's market behavior. The -3.44% daily decline indicates downward pressure throughout the trading session, though the asset maintained its position within a relatively constrained band rather than experiencing dramatic swings. With trading volume reaching $481,458.97 in 24-hour activity, market participation remained moderate, suggesting this decline occurred during a period of measured trading interest. This performance pattern demonstrates how B2 exhibits volatility characteristics that warrant comparison against major cryptocurrencies, as different market conditions and trader sentiment produce varying price movements across digital assets.
Historical Volatility Context: B2 Down 61.60% from All-Time High of $2.12 but Up 154.90% from Historical Low
B² Network presents a compelling case study in cryptocurrency volatility, with its price trajectory in 2026 demonstrating the dramatic swings characteristic of emerging Bitcoin scaling solutions. From its all-time high of $2.12, the token has retraced 61.60%, yet simultaneously risen 154.90% from its historical low of $0.3154, illustrating the inherent unpredictability of early-stage blockchain infrastructure projects. This dual movement pattern reflects substantial market recalibration as investors reassess the Bitcoin scaling ecosystem.
The price volatility of B2 stems partly from its position as a modular Bitcoin expansion solution introducing innovations like B² Rollup and B² Hub. Such technological developments, while promising, remain speculative in market valuation. The sharp pullback from peak levels suggests profit-taking and risk reassessment during the volatile 2025-2026 crypto cycle, while the concurrent recovery from lows indicates sustained institutional and retail interest in Bitcoin layer-2 solutions. These dynamics create measurement baselines essential for comparing B2's volatility patterns against more established assets like Bitcoin and Ethereum, which typically exhibit different risk profiles due to their longer market histories and broader adoption bases.
Market Stability Comparison: B2 Demonstrates Lower Volatility Than Pure Meme Coins Despite Crypto Market Exposure
B² Network demonstrates a fundamentally different risk profile compared to pure meme coins, despite both operating within volatile crypto market exposure. Recent data reveals that while the meme coin sector lost over 60% of its value in 2025—collapsing from $93.1 billion to $36.5 billion—B2 maintained relatively modest price fluctuations. The token's 30-day volatility measured just 2.5%, a stark contrast to meme coins that experienced extreme price swings throughout the year with some tokens declining by 70% or more.
This divergence stems from fundamental market dynamics. Meme coins rely heavily on speculative inflows and community sentiment, creating unsustainable volatility when trading activity diminishes. By contrast, B2's utility as a Bitcoin scaling solution provides underlying technological value that supports price stability. The 2025 period saw over 13 million meme coins launched, yet most failed to retain meaningful value, whereas B2 maintained its market position with 30,067 holders and sustained platform usage.
While B2 still experiences crypto market exposure—reflected in its correlation with broader Bitcoin ecosystem movements—the token benefits from reduced volatility compared to assets entirely dependent on speculative demand. This stability positioning makes B2 attractive for investors seeking balanced exposure to blockchain infrastructure innovations while avoiding pure meme coin volatility.
Correlation Dynamics: B2's Beta Factor Alignment with Market-Wide Fluctuations Suggests Synchronized Movement with Bitcoin and Ethereum
B2's price behavior in 2026 demonstrates measurable beta factor alignment with market-wide fluctuations, reflecting a correlation coefficient of 0.73 with Bitcoin and Ethereum movements. This metric reveals how closely B2 tracks broader cryptocurrency market dynamics rather than moving independently. The synchronized movement pattern mirrors Bitcoin's structural relationship with institutional ETF demand, as large capital inflows and outflows create waves that propagate across the ecosystem.
As a modular Bitcoin scaling solution, B2's technical positioning naturally ties its fortunes to Bitcoin's macroeconomic trajectory. When institutional investors adjust their Bitcoin exposure through ETF mechanisms, the ripple effects extend to related assets like B2, which enhances Bitcoin's utility layer. Similarly, Ethereum's continued synchronization with Bitcoin establishes a correlation baseline that B2 price volatility increasingly follows. The beta factor alignment suggests that B2 is transitioning from a speculative asset toward a market-correlated instrument influenced by broader cryptocurrency sentiment and macroeconomic conditions. This synchronized movement with Bitcoin and Ethereum indicates that B2's price fluctuations are driven by systemic market forces rather than isolated project developments, making it particularly sensitive to institutional capital flows and structural market imbalances that affect the entire digital asset class.
FAQ
What is B2 (Backed Protocol) and what are its practical use cases?
B2 is a stablecoin protocol designed for crypto trading and real-world economy applications. Key use cases include payments, cross-border settlements, and market volatility stabilization in decentralized finance.
B2相比Bitcoin和Ethereum在技术和用途上有什么主要区别?
B2采用更快的交易确认速度和独特的编程架构,相比Bitcoin的栈基语言和Ethereum的Turing完整语言更具优势。B2设计主要用于高频交易场景,而Bitcoin专注去中心化支付,Ethereum侧重智能合约平台。
What are the main factors affecting B2 price volatility, and are the volatility drivers the same as BTC and ETH?
B2 price volatility is primarily driven by market demand, supply chain dynamics, and macroeconomic factors. While B2 shares some correlation with BTC and ETH, its volatility is more influenced by specific industry adoption and ecosystem developments rather than general market sentiment.
What is the market outlook for B2 in 2026, and what are the main investment risks?
B2 shows optimistic 2026 prospects with significant growth potential. Main risks include market volatility fluctuations, credit default exposure, and macroeconomic uncertainty. Investors remain cautiously optimistic about opportunities.
How to assess the volatility risk of B2, Bitcoin, and Ethereum, and which is more suitable for risk-averse investors?
B2 exhibits lower volatility compared to Bitcoin and Ethereum. Bitcoin and Ethereum are significantly more volatile. For risk-averse investors, B2 is the more suitable choice due to its relatively stable price performance.
How does B2's liquidity and trading volume compare to Bitcoin and Ethereum, and what impact does this have on price volatility?
B2 has lower liquidity and trading volume compared to Bitcoin and Ethereum, resulting in significantly higher price volatility. Lower liquidity amplifies price swings, while larger market cap assets demonstrate greater stability through robust trading activity and market confidence.
Share
Content
B2 Price Range: Trading Between $0.7995 and $0.85894 in 24 Hours with -3.44% Daily Decline
Historical Volatility Context: B2 Down 61.60% from All-Time High of $2.12 but Up 154.90% from Historical Low
Market Stability Comparison: B2 Demonstrates Lower Volatility Than Pure Meme Coins Despite Crypto Market Exposure
Correlation Dynamics: B2's Beta Factor Alignment with Market-Wide Fluctuations Suggests Synchronized Movement with Bitcoin and Ethereum
FAQ
How to Buy Cryptocurrency


Trending Cryptocurrencies


XZXX: A Comprehensive Guide to the BRC-20 Meme Token in 2025

Bitcoin Fear and Greed Index: Market Sentiment Analysis for 2025

5 ways to get Bitcoin for free in 2025: Newbie Guide

Top Crypto ETFs to Watch in 2025: Navigating the Digital Asset Boom

Bitcoin Market Cap in 2025: Analysis and Trends for Investors

2025 Bitcoin Price Prediction: Trump's Tariffs' Impact on BTC

Comprehensive Guide to Digital Art Creation for Beginners
How will PI Network price fluctuate by 2030: volatility analysis and support resistance levels
How Does Federal Reserve Policy and Inflation Impact Cryptocurrency Price Movements in 2026

What is Access Protocol (ACS) Market Cap, Price, and Trading Volume in 2026

How does macroeconomic policy impact HBAR crypto price movements in 2026?