Fragmetric (FRAG) is an early-stage DeFi infrastructure token on Solana offering comprehensive investment considerations for 2024-2031. Currently trading at $0.001644 with a $332,088 market cap, FRAG evolved from a liquid staking protocol into the FRAG-22 asset management standard, integrating multi-asset deposits and modular yield strategies. The analysis examines FRAG's price history, revealing volatility from July 2025's peak of $0.189 to February 2026's low of $0.001419. Investment forecasts for 2026-2031 range from conservative scenarios ($0.001155-$0.0018315 by 2026) to optimistic projections ($0.002865 by 2031). With 15,276 holders and 4 exchange listings, FRAG presents both opportunities and substantial risks including market volatility, regulatory uncertainty, and technical vulnerabilities. Recommended allocations vary from 1-2% for conservative investors to 5-10% for aggressive portfolios, emphasizing secure storage and active risk management throughout market cycles.
Introduction: Fragmetric (FRAG) Investment Position and Market Outlook
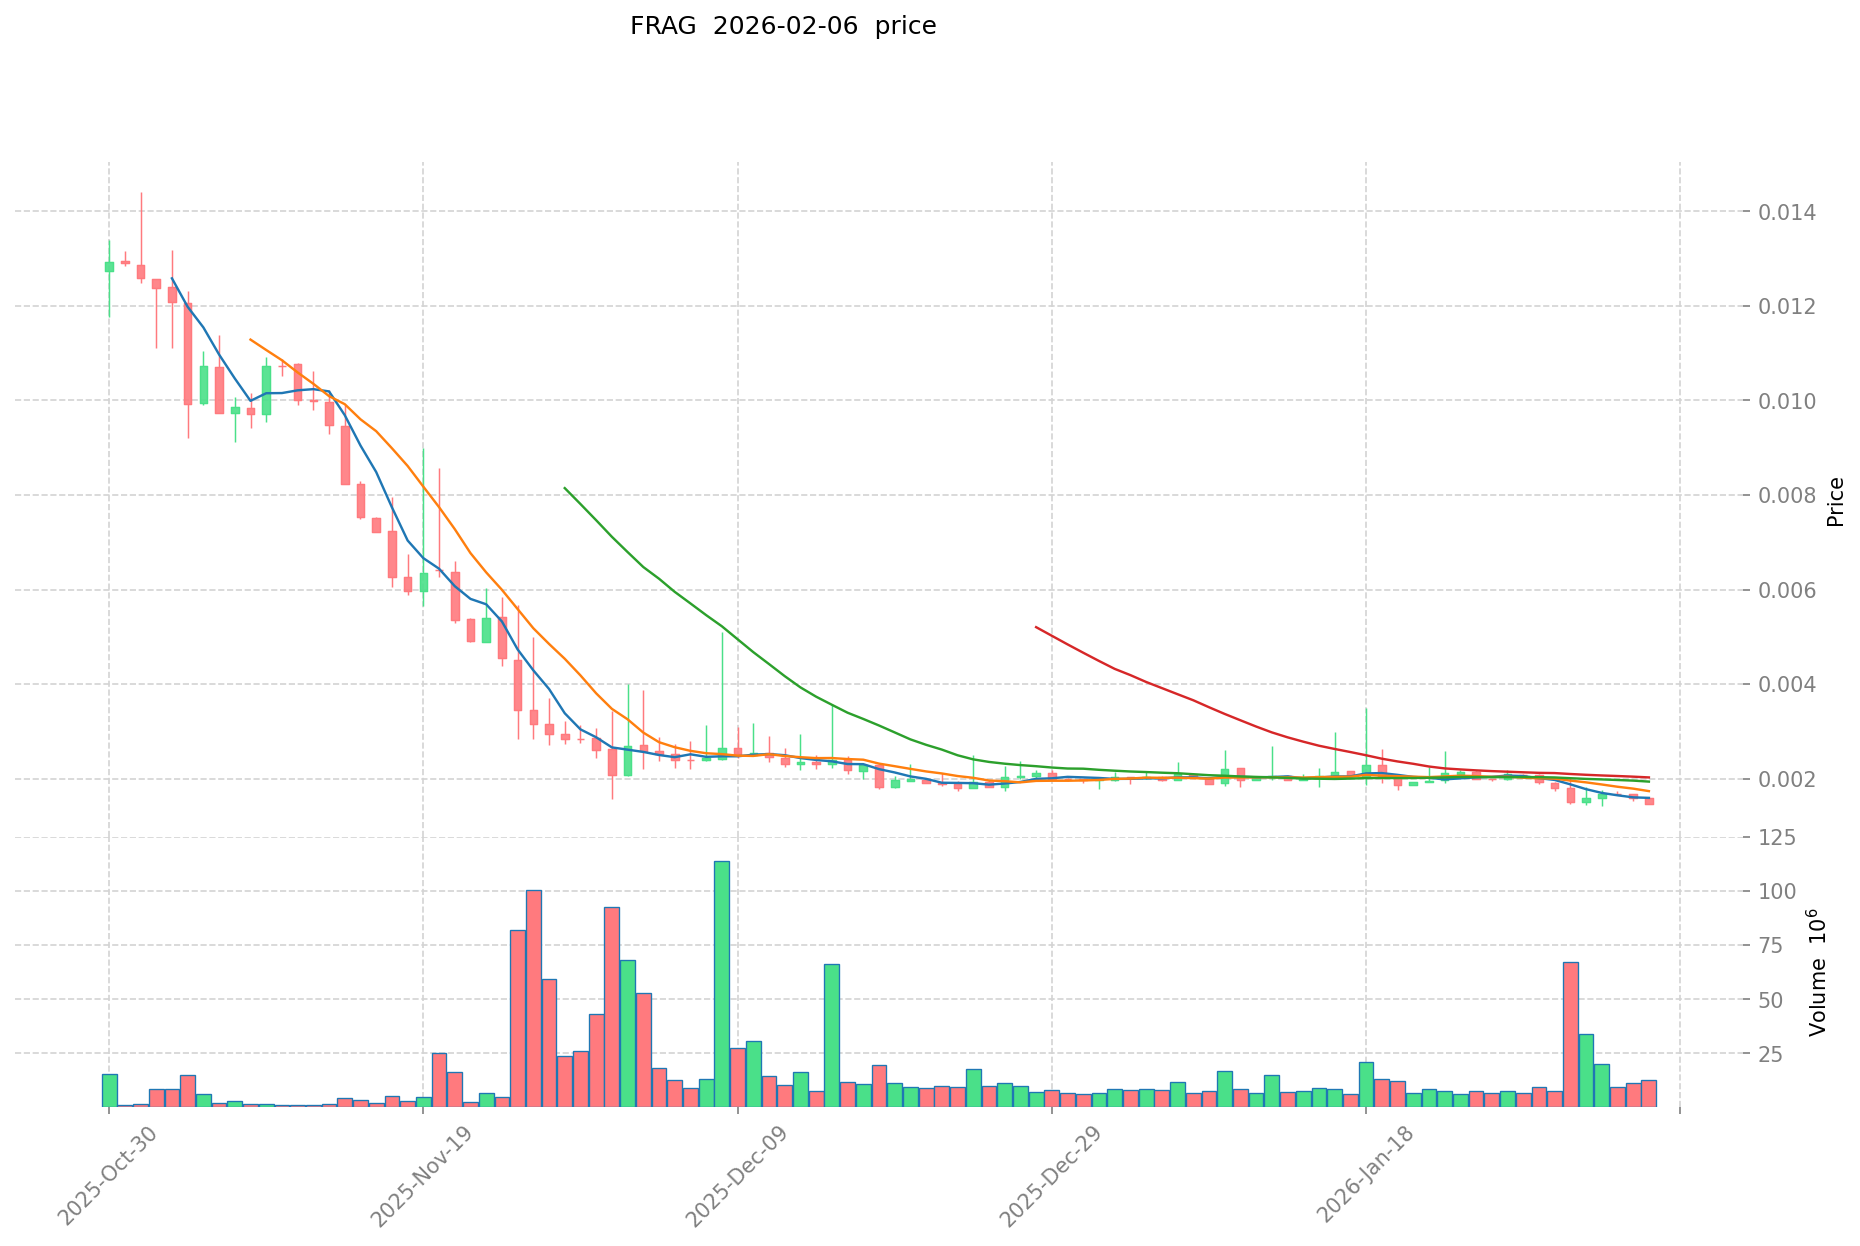
FRAG represents an emerging asset in the cryptocurrency sector, having launched in 2025 with a focus on decentralized finance infrastructure. As of February 7, 2026, Fragmetric holds a market capitalization of approximately $332,088, with a circulating supply of 202,000,000 tokens out of a maximum supply of 1,000,000,000. The current trading price stands at $0.001644, reflecting recent market dynamics.
Originally developed as a native liquid staking protocol for the Solana ecosystem, Fragmetric has evolved into the FRAG-22 asset management standard. This framework integrates multi-asset deposit mechanisms, reward distribution systems, and modular yield generation capabilities, aiming to provide developers and users with access to structured DeFi strategies. The token is held by approximately 15,276 addresses and trades on 4 exchanges.
Recent price movements show volatility across different timeframes: a 12.7% increase over 24 hours, contrasted with declines of 9.42% over 7 days, 18.93% over 30 days, and 97.35% over the past year. The asset reached a notable price level of $0.189 on July 1, 2025, while recording a lower bound of $0.001419 on February 2, 2026. With a market dominance of 0.000065% and a circulating supply representing 20.2% of total supply, FRAG exhibits characteristics typical of early-stage cryptocurrency projects.
This analysis examines Fragmetric's investment considerations, historical price behavior, potential future scenarios, and associated risks, providing information for those evaluating whether Fragmetric (FRAG) aligns with their portfolio objectives.
I. Fragmetric (FRAG) Price History Review and Investment Value Status
- 2025: FRAG launched on Solana as the first native liquid (re)staking protocol → Early adopters experienced significant volatility during initial trading phases
- July 2025: Platform reached a notable price level of $0.189 → FRAG demonstrated early market interest in its FRAG-22 asset management standard
- February 2026: Market correction phase → Price declined from higher levels to $0.001419, reflecting broader market dynamics and ecosystem adjustments
Current FRAG Investment Market Status (February 2026)
- FRAG current price: $0.001644
- Market sentiment (Fear & Greed Index): Data currently unavailable for specific analysis
- 24-hour trading volume: $20,992.93
- Institutional investor holdings: Total holders count stands at 15,276 addresses
Click to view real-time FRAG market price
II. Core Factors Affecting Whether FRAG is a Good Investment
Supply Mechanism and Scarcity (FRAG Investment Scarcity)
- Maximum supply of 1,000,000,000 tokens with 202,000,000 currently circulating (20.2% circulation ratio) → Affects price dynamics and investment valuation
- Circulating supply represents approximately one-fifth of total supply → Potential for gradual token releases may influence future price movements
- Investment significance: The relationship between circulating and maximum supply serves as a fundamental factor in assessing long-term investment positioning
Institutional Investment and Mainstream Adoption (Institutional Investment in FRAG)
- Current holder count stands at 15,276 addresses → Reflects early-stage adoption patterns
- Trading activity across 4 exchanges with 24-hour volume of $20,992.93 → Indicates developing market presence
- Market dominance at 0.000065% → Represents emerging status within the broader cryptocurrency ecosystem
Macroeconomic Environment's Impact on FRAG Investment
- Monetary policy shifts and interest rate adjustments → May alter relative attractiveness of digital asset investments
- Performance during varying economic conditions requires monitoring as the asset class matures
- Geopolitical uncertainties → Could influence demand patterns for alternative digital assets
Technology and Ecosystem Development (Technology & Ecosystem for FRAG Investment)
- Evolution from Solana's liquid staking protocol to the FRAG-22 asset management standard → Enhances functional capabilities and potential use cases
- FRAG-22 standard integrates multi-asset deposits, precise reward distribution, and modular yield sourcing → Supports sophisticated DeFi strategies
- Ecosystem expansion within Solana infrastructure → Provides technical foundation for long-term value considerations
- Developer and user accessibility to complex DeFi strategies through the platform → May contribute to adoption growth potential
III. FRAG Future Investment Forecast and Price Outlook (Is Fragmetric(FRAG) worth investing in 2026-2031)
Short-term Investment Forecast (2026, short-term FRAG investment outlook)
- Conservative forecast: $0.001155 - $0.00165
- Neutral forecast: $0.00165 - $0.0017
- Optimistic forecast: $0.0017 - $0.0018315
Mid-term Investment Outlook (2027-2029, mid-term Fragmetric(FRAG) investment forecast)
- Market stage expectation: The protocol may continue integrating additional liquid staking tokens and establishing new NCN partnerships to expand yield opportunities. The FRAG-22 standard could see further adoption across DeFi strategies during this phase.
- Investment return forecast:
- 2027: $0.0011663025 - $0.00188001
- 2028: $0.0010681242 - $0.0018827952
- 2029: $0.001698860592 - $0.00258522264
- Key catalysts: Protocol expansion, new NCN partnerships, integration of more liquid staking tokens, and broader adoption of the FRAG-22 asset management standard.
Long-term Investment Outlook (Is FRAG a good long-term investment?)
- Base scenario: $0.001729624741416 - $0.002865497705928 (assuming steady protocol development and consistent DeFi market conditions)
- Optimistic scenario: $0.0025815294648 - $0.0029471538096 (assuming accelerated adoption of FRAG-22 standard and favorable market environment)
- Risk scenario: Below $0.001155 (in case of adverse market conditions or protocol setbacks)
Click to view FRAG long-term investment and price prediction: Price Prediction
2026-02-07 - 2031 Long-term Outlook
- Base scenario: $0.001729624741416 - $0.0025815294648 (corresponding to steady progress and gradual mainstream application improvement)
- Optimistic scenario: $0.00221590512 - $0.0029471538096 (corresponding to large-scale adoption and favorable market environment)
- Transformative scenario: Above $0.003 (if ecosystem achieves breakthrough progress and mainstream popularization)
- 2031-12-31 predicted high: $0.002865497705928 (based on optimistic development assumptions)
Disclaimer: Price forecasts are based on historical data analysis and market assumptions. Cryptocurrency markets are highly volatile, and actual performance may differ significantly from predictions. These forecasts do not constitute investment advice, and investors should conduct their own research and consult with financial professionals before making investment decisions.
| Year |
Predicted High Price |
Predicted Average Price |
Predicted Low Price |
Price Change |
| 2026 |
0.0018315 |
0.00165 |
0.001155 |
0 |
| 2027 |
0.00188001 |
0.00174075 |
0.0011663025 |
5 |
| 2028 |
0.0018827952 |
0.00181038 |
0.0010681242 |
10 |
| 2029 |
0.00258522264 |
0.0018465876 |
0.001698860592 |
12 |
| 2030 |
0.0029471538096 |
0.00221590512 |
0.0020829508128 |
34 |
| 2031 |
0.002865497705928 |
0.0025815294648 |
0.001729624741416 |
57 |
IV. Fragmetric Investment Strategy and Risk Management (How to invest in Fragmetric)
Investment Methodology (Fragmetric investment strategy)
Long-term Holding (HODL FRAG)
For conservative investors seeking exposure to Solana's DeFi ecosystem, a long-term holding strategy may be considered. This approach involves acquiring FRAG tokens and maintaining positions through market cycles, potentially benefiting from the development of the FRAG-22 asset management standard. Given FRAG's relatively early stage, with a market capitalization of approximately $332,088 and a circulating supply of 202 million tokens (20.2% of total supply), long-term holders should account for potential dilution as more tokens enter circulation.
Active Trading
Active traders may utilize technical analysis and swing trading strategies to capitalize on FRAG's price movements. Recent data shows notable volatility, with 24-hour fluctuations reaching 12.7% and weekly variations of -9.42%. The token has demonstrated significant price range between its all-time high of $0.189 (July 1, 2025) and all-time low of $0.001419 (February 2, 2026). Current 24-hour trading volume stands at approximately $20,993, which may present liquidity considerations for larger position sizes.
Risk Management (Risk management for FRAG investment)
Asset Allocation Ratios
- Conservative Investors: Limit FRAG allocation to 1-2% of crypto portfolio, focusing on established assets
- Aggressive Investors: May allocate 5-10% to FRAG within a diversified DeFi token portfolio
- Professional Investors: Could consider 3-7% allocation with active monitoring of protocol development and market conditions
Risk Hedging Approaches
Investors should consider diversification across multiple asset classes and blockchain ecosystems. Given FRAG's concentration on Solana infrastructure, portfolio balance with tokens from alternative Layer 1 networks may reduce platform-specific risk. The token's ranking at #3418 and market dominance of 0.000065% suggests higher risk profile compared to established cryptocurrencies.
Secure Storage
- Cold Wallets: Hardware wallets supporting Solana tokens (such as Ledger devices with Solana app) provide enhanced security for long-term holdings
- Hot Wallets: Phantom, Solflare, or other Solana-compatible wallets for active trading, with appropriate security practices including multi-factor authentication
- Custody Considerations: Store only necessary trading amounts in exchange wallets; maintain majority holdings in self-custody solutions
V. FRAG Investment Risks and Challenges (Risks of investing in Fragmetric)
Market Risk
FRAG exhibits substantial volatility, with year-over-year decline of -97.35% from previous levels. The token's 24-hour price range between $0.001439 and $0.001652 demonstrates ongoing price fluctuations. With a relatively low market capitalization and trading volume, FRAG may be susceptible to larger percentage price movements from individual trades. The fully diluted market cap of approximately $1.644 million indicates early-stage valuation status.
Regulatory Risk
As a DeFi protocol token operating on Solana, FRAG faces evolving regulatory frameworks across jurisdictions. Liquid staking and asset management protocols continue to attract regulatory scrutiny in various markets. Changes in securities classification, DeFi regulations, or staking-related policies could impact protocol operations and token utility. Investors should monitor regulatory developments in their respective jurisdictions.
Technical Risk
The protocol's transition from a liquid staking protocol to the FRAG-22 asset management standard introduces implementation risks. Smart contract vulnerabilities, integration challenges with multiple asset types, and reward distribution mechanisms require ongoing security audits. As a Solana-based protocol, FRAG's performance remains connected to the underlying blockchain's network stability and potential technical issues. The protocol's relatively recent launch (published January 1, 2025) means limited operational history for assessing long-term technical resilience.
VI. Conclusion: Is Fragmetric a Good Investment?
Investment Value Summary
Fragmetric represents an early-stage DeFi infrastructure project on Solana, focusing on asset management standardization through its FRAG-22 protocol. The token has experienced considerable price volatility, with substantial decline from its July 2025 peak. The protocol's technical innovation in multi-asset deposits and modular yield strategies may attract interest from DeFi participants, though market adoption remains in early phases with approximately 15,276 holders and limited exchange availability (4 exchanges).
Investor Recommendations
✅ New Investors: Consider minimal allocation only after thorough research; utilize dollar-cost averaging approach; prioritize secure wallet storage; acknowledge high-risk profile
✅ Experienced Investors: Monitor protocol development and FRAG-22 adoption metrics; implement position sizing relative to risk tolerance; consider swing trading strategies with appropriate stop-loss mechanisms
✅ Institutional Investors: Conduct comprehensive due diligence on protocol security audits and development team; assess strategic fit within DeFi infrastructure thesis; implement risk-adjusted position sizing
⚠️ Disclaimer: Cryptocurrency investments involve substantial risk of loss. This analysis is provided for informational purposes only and does not constitute investment advice. Investors should conduct independent research and consult qualified financial advisors before making investment decisions.
VII. FAQ
Q1: What is the current market position of Fragmetric (FRAG) and how has it performed since launch?
As of February 7, 2026, FRAG trades at $0.001644 with a market capitalization of approximately $332,088, representing a 97.35% decline from its peak performance. The token launched in 2025 as Solana's first native liquid staking protocol and reached a notable high of $0.189 on July 1, 2025, before experiencing significant correction to an all-time low of $0.001419 on February 2, 2026. Currently, 202 million tokens circulate (20.2% of the 1 billion maximum supply), with the asset ranking #3418 in market dominance (0.000065%). Trading volume stands at approximately $20,993 over 24 hours across 4 exchanges, with 15,276 holder addresses.
Q2: What are the primary technological innovations behind Fragmetric's investment proposition?
Fragmetric's core value proposition centers on the FRAG-22 asset management standard, which evolved from its original liquid staking protocol foundation. This framework integrates multi-asset deposit mechanisms, precise reward distribution systems, and modular yield generation capabilities, enabling developers and users to access structured DeFi strategies within the Solana ecosystem. The protocol aims to standardize liquid staking token integration and establish partnerships with Node Consensus Networks (NCNs) to expand yield opportunities. The technological infrastructure provides accessibility to complex DeFi strategies that traditionally required specialized knowledge, potentially lowering barriers to participation in advanced yield-generation mechanisms.
Q3: What are the projected price ranges for FRAG from 2026 to 2031?
Short-term forecasts for 2026 range from $0.001155 (conservative) to $0.0018315 (optimistic). Mid-term projections suggest 2027 prices between $0.0011663025 and $0.00188001, while 2028 estimates range from $0.0010681242 to $0.0018827952. For 2029, predictions span $0.001698860592 to $0.00258522264. Long-term outlook for 2030 projects $0.0020829508128 to $0.0029471538096, with 2031 estimates between $0.001729624741416 and $0.002865497705928. These forecasts assume various scenarios including steady protocol development, FRAG-22 adoption rates, and overall DeFi market conditions, though actual performance may differ significantly due to cryptocurrency market volatility.
Q4: What allocation percentages should different investor types consider for FRAG?
Conservative investors should limit FRAG exposure to 1-2% of their cryptocurrency portfolio, prioritizing established assets for the remainder. Aggressive investors may allocate 5-10% to FRAG within a diversified DeFi token portfolio, accepting higher risk for potential returns. Professional investors could consider 3-7% allocation with active monitoring of protocol development milestones and market conditions. These recommendations reflect FRAG's early-stage status, low market capitalization, limited liquidity, and substantial historical volatility. Investors should implement appropriate risk management strategies, including diversification across multiple blockchain ecosystems to reduce platform-specific concentration risk associated with Solana-based protocols.
Q5: What are the primary risk factors investors should evaluate before investing in FRAG?
FRAG presents multiple risk categories requiring careful consideration. Market risk manifests through substantial volatility, evidenced by the 97.35% year-over-year decline and daily fluctuations reaching 12.7%. Low trading volume ($20,993 over 24 hours) and limited exchange availability create liquidity concerns for position entry and exit. Regulatory risk stems from evolving DeFi frameworks and potential securities classification changes affecting liquid staking protocols. Technical risk includes smart contract vulnerabilities inherent in the FRAG-22 standard implementation, integration challenges with multiple asset types, and dependence on Solana blockchain stability. The protocol's recent launch (January 2025) provides limited operational history for assessing long-term resilience and security performance.
Q6: How does FRAG's tokenomics structure affect long-term investment considerations?
FRAG's tokenomics features a maximum supply of 1 billion tokens with only 202 million currently circulating (20.2%), creating potential dilution risk as additional tokens enter circulation. The fully diluted market capitalization stands at approximately $1.644 million, indicating early-stage valuation. This supply structure means future token releases could exert downward price pressure if demand fails to match increased availability. Investors should monitor emission schedules and vesting timelines to anticipate supply dynamics. The relatively low circulating percentage also suggests significant token reserves remain under protocol or team control, requiring transparency regarding release mechanisms and governance structures governing future distributions.
Q7: What storage and security practices should FRAG investors implement?
For long-term holdings, investors should utilize cold wallet solutions such as hardware wallets (Ledger devices with Solana application support) to minimize exposure to online vulnerabilities. Active traders may employ hot wallets including Phantom or Solflare with robust security measures like multi-factor authentication and regular security audits. Best practices include storing only necessary trading amounts on exchange wallets while maintaining majority holdings in self-custody solutions. Investors should verify wallet compatibility with Solana-based tokens, maintain secure backup procedures for recovery phrases, and implement separate wallets for different investment strategies to compartmentalize risk exposure.
Q8: What indicators should investors monitor to assess FRAG's investment viability going forward?
Key monitoring metrics include FRAG-22 standard adoption rates across DeFi protocols, number of integrated liquid staking tokens, and new NCN partnership announcements. Trading volume trends across exchanges indicate liquidity development and market interest evolution. Holder count growth from the current 15,276 addresses signals community expansion. Protocol development milestones, security audit results, and smart contract upgrade implementations provide technical health indicators. Broader market factors including Solana ecosystem growth, DeFi sector performance, regulatory developments affecting staking protocols, and macroeconomic conditions influencing cryptocurrency markets also warrant continuous evaluation for informed investment decision-making.
* The information is not intended to be and does not constitute financial advice or any other recommendation of any sort offered or endorsed by Gate.