Is Heima (HEI) a good investment?: A Comprehensive Analysis of Performance, Potential, and Market Outlook


Introduction: Heima Network (HEI) Investment Position and Market Outlook
HEI is an important asset in the cryptocurrency domain. As of December 2025, HEI has achieved a market capitalization of approximately $11.11 million USD, with a circulating supply of 67,616,329 tokens and a current price of $0.1196. Heima Network operates as a cutting-edge Layer 1 blockchain designed to enable seamless multi-chain and cross-chain interoperability, evolved from the Litentry Network while integrating advanced security modules and exchange chain abstraction support. With its distinctive positioning in the interoperability segment, HEI has gradually become a focal point when investors discuss the investment potential of emerging blockchain infrastructure assets. This report provides a comprehensive analysis of HEI's investment value, historical price performance, market dynamics, and associated investment risks to serve as a reference for potential investors.
Heima (HEI) Cryptocurrency Analysis Report
I. Price History Review and Current Investment Value Status
Heima (HEI) Historical Price Performance and Investment Returns
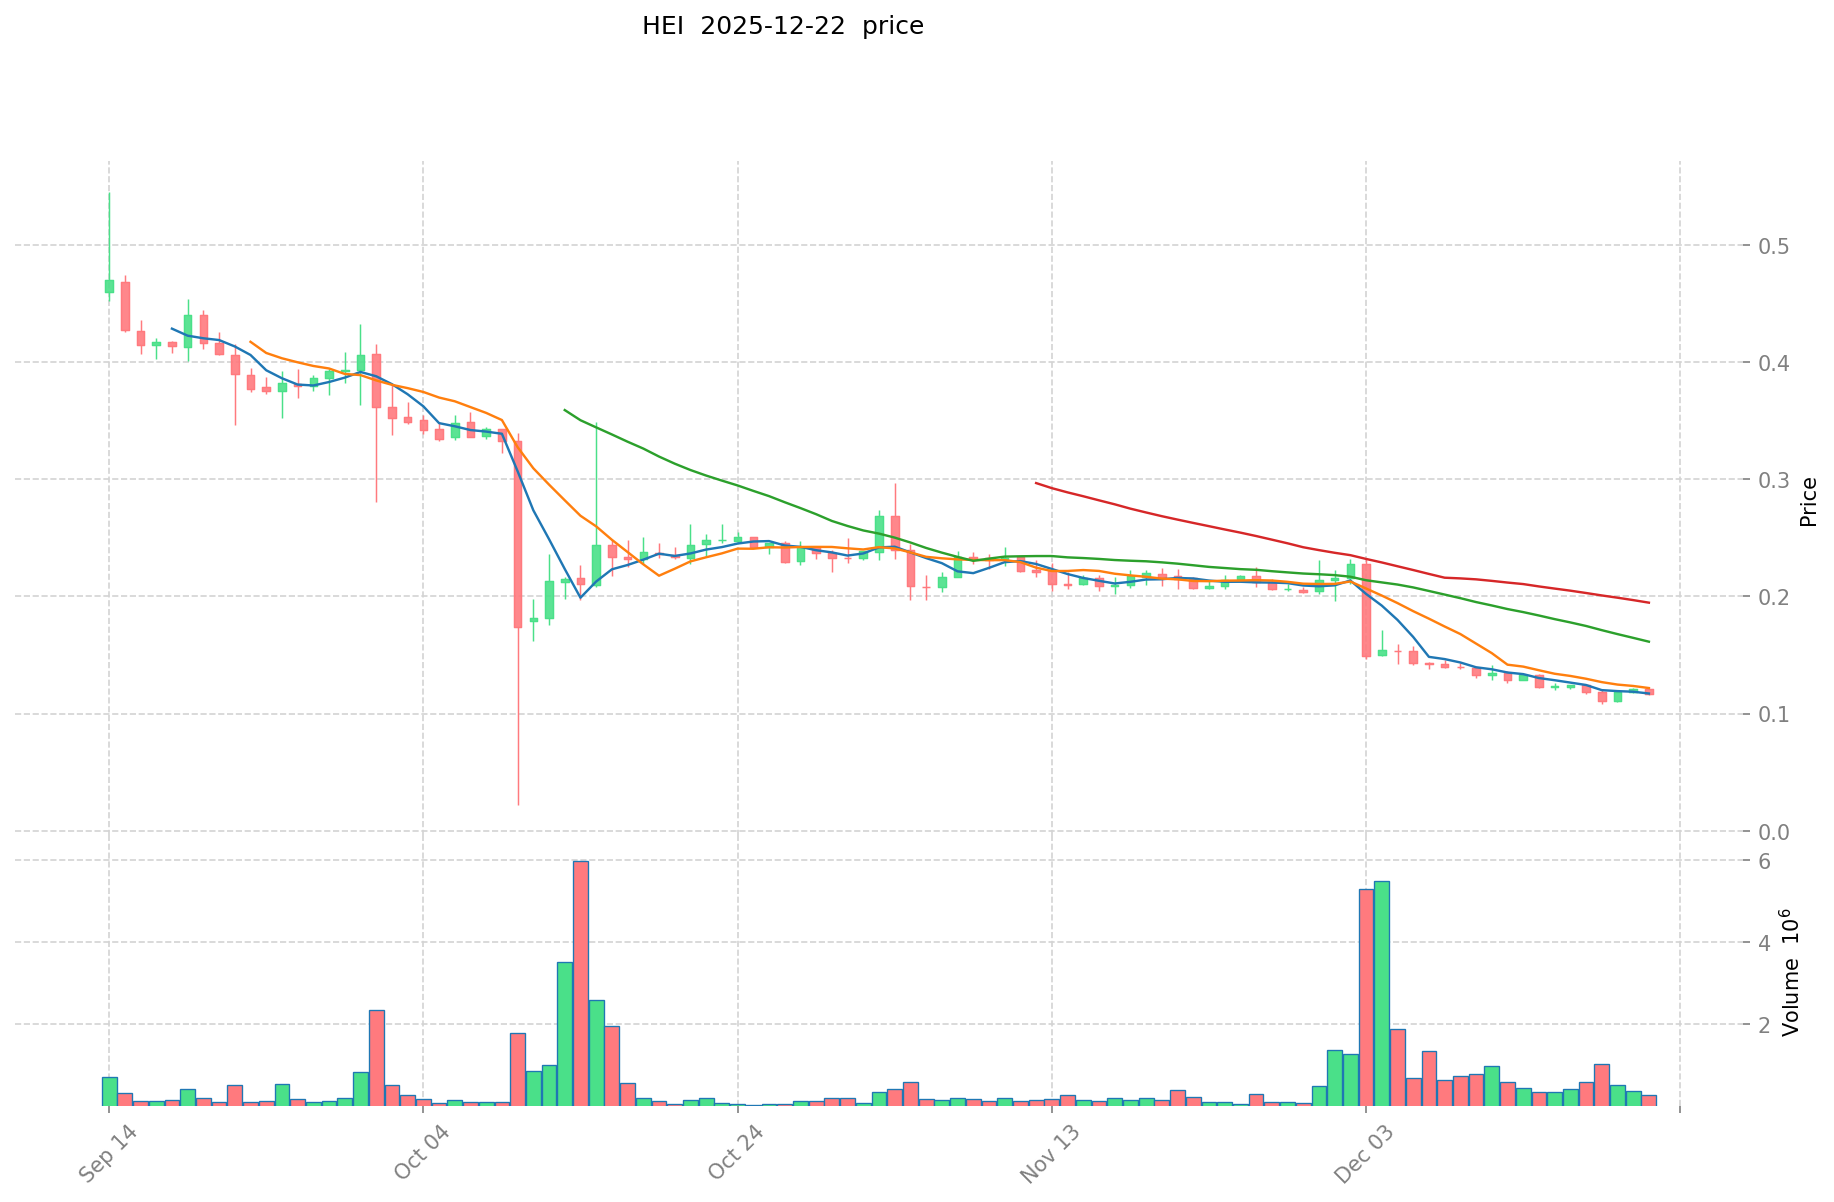
Based on available data as of December 22, 2025:
- February 13, 2025: All-Time High (ATH) reached at $1.25 per HEI token
- October 11, 2025: All-Time Low (ATL) recorded at $0.04755675 per HEI token
- Year-to-Date Performance: Decline of 84.81% from the previous year
The significant price volatility between the February peak and October trough represents a drawdown of approximately 96.19%, reflecting substantial market fluctuations over the reporting period.
Current Heima (HEI) Market Status (December 22, 2025)
Price Metrics:
- Current Price: $0.1196 per HEI
- 24-Hour Price Range: $0.1157 - $0.1204
- 24-Hour Price Change: -0.25%
Market Capitalization and Supply:
- Market Capitalization: $8,086,912.95
- Fully Diluted Valuation (FDV): $11,105,969.17
- Circulating Supply: 67,616,329 HEI tokens
- Total Supply: 92,859,274 HEI tokens
- Circulation Ratio: 72.82%
Trading Activity:
- 24-Hour Trading Volume: $39,625.76
- Market Dominance: 0.00034%
- Market Ranking: #1,290
- Exchange Listings: 19 exchanges
- Token Holders: 830 addresses
Price Trends (Multi-Timeframe Analysis):
| Timeframe | Change Percentage | Change Amount |
|---|---|---|
| 1 Hour | -0.25% | -$0.0003 |
| 24 Hours | -0.25% | -$0.0003 |
| 7 Days | -3.63% | -$0.0045 |
| 30 Days | -43.02% | -$0.0903 |
| 1 Year | -84.81% | -$0.6678 |
Market data reflects conditions as of December 22, 2025. For real-time HEI price updates, refer to major cryptocurrency exchanges where HEI is listed.
II. Project Overview
Project Description
Heima Network represents a cutting-edge Layer 1 blockchain infrastructure designed to facilitate seamless multi-chain and cross-chain interoperability. The project evolved from the Litentry Network, inheriting advanced security modules and exchange chain abstraction support to enable robust blockchain operations.
Technical Specifications
- Token Standard: ERC-20
- Algorithm: ERC-20
- Contract Address (BSC): 0xf8f173e20e15f3b6cb686fb64724d370689de083
- Contract Address (Ethereum): 0xf8f173e20e15f3b6cb686fb64724d370689de083
Official Resources
- Website: https://litentry-alpha.vercel.app/
- Twitter/X: https://x.com/litentry
- Block Explorers:
III. Market Sentiment and Risk Assessment
- Market Sentiment Indicator: Positive (Value: 1)
- Major Bearish Pressure: Significant year-over-year decline of 84.81% reflects considerable selling pressure and market uncertainty
IV. Key Observations
Positive Indicators:
- Established presence on 19 cryptocurrency exchanges, indicating reasonable liquidity infrastructure
- Moderate holder base of 830 addresses suggests decentralized distribution
- Successful Layer 1 blockchain positioning with interoperability focus
Risk Factors:
- Severe price depreciation of 84.81% over the past year signals substantial investor losses
- 30-day decline of 43.02% indicates recent downward momentum
- Relatively small market capitalization and market dominance suggest limited market penetration
- Low daily trading volume may indicate liquidity constraints during volatile market conditions
Report Date: December 22, 2025
Data Source: Gate Data Market Information
Disclaimer: This report presents factual market data and project information derived from available sources. It does not constitute investment advice, financial recommendations, or predictions of future price performance. Cryptocurrency markets carry significant risks, and investors should conduct independent research and consult qualified financial advisors before making investment decisions.
Heima (HEI) Investment Analysis Report
Report Date: December 22, 2025
I. Executive Summary
Heima Network (HEI) is a Layer 1 blockchain designed to enable seamless multi-chain and cross-chain interoperability, evolved from the Litentry Network. As of December 22, 2025, HEI trades at $0.1196 with a market capitalization of $8,086,912.95 and ranks 1,290 globally in terms of market cap. The token has demonstrated significant volatility, declining 84.81% over the past year from its all-time high of $1.25 reached on February 13, 2025.
II. Core Factors Influencing HEI Investment Prospects
Supply Mechanism and Scarcity
- Token Distribution: HEI has a maximum supply of 92,859,274 tokens, with 67,616,329 tokens currently in circulation, representing 72.82% of total supply
- Circulation Dynamics: The market cap to fully diluted valuation ratio stands at 72.82%, indicating moderate dilution risk from future token releases
- Scarcity Impact: The remaining 25.18% of tokens held in reserve could exert downward pressure on price as they enter circulation, affecting long-term investment dynamics
Institutional Investment and Mainstream Adoption
The available data does not provide specific information regarding institutional holding trends, major corporate adoptions of HEI, or explicit government policy impacts on HEI investment prospects. These factors remain unquantified in current market documentation.
Macroeconomic Environment Effects on HEI Investment
The relationship between broader macroeconomic conditions (monetary policy, inflation, geopolitical uncertainty) and HEI investment attractiveness is not detailed in the provided research materials. Analysis of these systemic factors would require additional economic context.
Technology and Ecosystem Development
- Core Architecture: Heima Network integrates advanced security modules and exchange chain abstraction support, positioning itself for multi-chain interoperability
- Network Status: The project maintains an active web presence and operates on multiple blockchains (BSC and ETH) through ERC-20 token contracts
- Ecosystem Activity: 19 exchange listings provide reasonable market liquidity and accessibility, with 830 unique token holders indicating an established user base
III. Price Performance and Market Metrics
Current Market Position
| Metric | Value |
|---|---|
| Current Price | $0.1196 |
| 24-Hour Change | -0.25% |
| 7-Day Change | -3.63% |
| 30-Day Change | -43.02% |
| 1-Year Change | -84.81% |
| 24-Hour Volume | $39,625.76 |
| Market Cap | $8,086,912.95 |
| Fully Diluted Valuation | $11,105,969.17 |
Price Range Analysis
| Period | Low | High |
|---|---|---|
| All-Time High (Feb 13, 2025) | — | $1.25 |
| All-Time Low (Oct 11, 2025) | $0.04755675 | — |
| 24-Hour Range | $0.1157 | $0.1204 |
IV. Investment Outlook Assessment
Market Sentiment Indicators
Recent technical analysis and market indicators suggest varied price targets for HEI:
- Conservative Estimates: Trading channels range from $0.08401 to $0.1202 in 2025
- Mid-Range Forecasts: Average annualized price projections around $0.09441 to $0.113
- Optimistic Scenarios: Upper-range predictions reaching $0.74834 to $1.1308 by end of 2025
Risk Factors
- Significant Price Decline: 84.81% decline over one year represents substantial loss for holders
- Market Concentration: 830 token holders indicate relatively concentrated ownership structure
- Market Cap Position: Ranking at 1,290 globally reflects limited market dominance
- High Volatility: Extreme price swings between all-time high and low create uncertainty
Supporting Factors
- Multi-Chain Presence: Deployment on both BSC and Ethereum networks
- Active Trading Infrastructure: 19 exchange listings provide trading options
- Interoperability Focus: Core value proposition addresses market demand for cross-chain solutions
V. Conclusion
The investment case for HEI presents mixed signals. While the project's focus on multi-chain interoperability addresses a genuine market need, the token's severe price depreciation and modest market position suggest elevated risk. Market predictions show wide variance, reflecting uncertainty about future performance. Prospective investors should conduct independent analysis and consider risk tolerance carefully, particularly given the speculative nature of early-stage Layer 1 blockchain projects in a competitive ecosystem.
III. Heima (HEI) Future Investment Predictions and Price Outlook
Short-term Investment Prediction (2025, Short-term HEI Investment Outlook)
- Conservative forecast: $0.0766 - $0.1197
- Neutral forecast: $0.1197 - $0.1772
- Optimistic forecast: $0.1772 - $0.1953
Mid-term Investment Outlook (2026-2027, Mid-term Heima (HEI) Investment Forecast)
-
Market phase expectation: Heima Network is transitioning from early adoption phase toward broader ecosystem development. The token demonstrates potential for moderate recovery from current depressed levels as cross-chain interoperability features mature and integration with the Litentry Network strengthens.
-
Investment return forecasts:
- 2026: $0.1336 - $0.1692 (approximately 24% upside potential)
- 2027: $0.1302 - $0.2335 (approximately 32% cumulative growth)
-
Key catalysts: Layer 1 blockchain infrastructure adoption, multi-chain interoperability protocol improvements, institutional partnerships, ecosystem expansion, and developer adoption metrics.
Long-term Investment Outlook (Is Heima (HEI) a Good Long-term Investment?)
-
Base scenario: $0.1648 - $0.2746 USD (assumes steady technological progress and moderate market adoption of cross-chain solutions)
-
Optimistic scenario: $0.2115 - $0.3083 USD (assumes accelerated enterprise adoption of Heima's interoperability features and favorable market conditions for Layer 1 solutions)
-
Risk scenario: $0.0764 - $0.1312 USD (assumes prolonged market headwinds, competitive pressures from established Layer 1 chains, or delayed feature deployment)
For detailed Heima (HEI) long-term investment and price predictions, visit: Price Prediction
2025-2030 Long-term Outlook
-
Base scenario: $0.1648 - $0.2746 USD (corresponding to steady technological advancement and mainstream cross-chain protocol adoption)
-
Optimistic scenario: $0.2115 - $0.3083 USD (corresponding to large-scale enterprise adoption and favorable market environment)
-
Transformative scenario: $0.3083 USD and above (if ecosystem achieves breakthrough progress in interoperability adoption and achieves mainstream recognition)
-
December 31, 2030 predicted high: $0.2936 USD (based on optimistic development assumptions)
Disclaimer: This analysis is for informational purposes only and does not constitute investment advice. Cryptocurrency markets carry significant risk including potential total loss of investment. Past performance does not guarantee future results. Investors should conduct their own research and consult qualified financial advisors before making investment decisions.
| 年份 | 预测最高价 | 预测平均价格 | 预测最低价 | 涨跌幅 |
|---|---|---|---|---|
| 2025 | 0.177156 | 0.1197 | 0.076608 | 0 |
| 2026 | 0.16920792 | 0.148428 | 0.1335852 | 24 |
| 2027 | 0.2334624012 | 0.15881796 | 0.1302307272 | 32 |
| 2028 | 0.27459625284 | 0.1961401806 | 0.164757751704 | 63 |
| 2029 | 0.3083323639032 | 0.23536821672 | 0.211831395048 | 96 |
| 2030 | 0.293598313536528 | 0.2718502903116 | 0.247383764183556 | 127 |
Heima Network (HEI) Investment Analysis Report
I. Executive Summary
Heima Network is a Layer 1 blockchain designed to enable seamless multi-chain and cross-chain interoperability, evolved from the Litentry Network. As of December 22, 2025, HEI is trading at $0.1196 with a market capitalization of $8,086,912.95 and a fully diluted valuation of $11,105,969.17.
Key Metrics:
- Current Price: $0.1196
- 24H Change: -0.25%
- Market Cap Rank: #1290
- Circulating Supply: 67,616,329 HEI (72.82% of total)
- Total Supply: 92,859,274 HEI
- Trading Volume (24H): $39,625.76
- Number of Holders: 830
- Listed Exchanges: 19
II. Token Overview & Technical Specifications
Basic Information
| Parameter | Value |
|---|---|
| Token Name | Heima (HEI) |
| Token Standard | ERC-20 |
| Current Price | $0.1196 |
| Market Capitalization | $8,086,912.95 |
| Fully Diluted Valuation | $11,105,969.17 |
| Circulating Supply | 67,616,329 HEI |
| Total Supply | 92,859,274 HEI |
| Max Supply | 92,859,274 HEI |
| Circulation Ratio | 72.82% |
| Market Dominance | 0.00034% |
Network Contracts
HEI operates as an ERC-20 token on multiple blockchain networks:
- BSC Network: 0xf8f173e20e15f3b6cb686fb64724d370689de083
- Ethereum Network: 0xf8f173e20e15f3b6cb686fb64724d370689de083
Price History
| Period | All-Time High | All-Time Low | Date |
|---|---|---|---|
| ATH | $1.25 | - | February 13, 2025 |
| ATL | - | $0.04755675 | October 11, 2025 |
III. Market Performance & Price Trends
Recent Price Movement
| Timeframe | Price Change | Change Percentage |
|---|---|---|
| 1 Hour | -$0.000300 | -0.25% |
| 24 Hours | -$0.000300 | -0.25% |
| 7 Days | -$0.004505 | -3.63% |
| 30 Days | -$0.090298 | -43.02% |
| 1 Year | -$0.667760 | -84.81% |
Market Analysis
The token has experienced significant depreciation over the past year, declining 84.81% from its year-ago levels. The 30-day performance shows a substantial pullback of 43.02%, indicating sustained downward pressure. Over shorter periods (24 hours and 1 hour), the token remains relatively stable with minimal negative movement of -0.25%.
24-Hour Price Range:
- High: $0.1204
- Low: $0.1157
- Current: $0.1196
IV. Investment Strategy & Risk Management
Investment Methodologies
Long-Term Holding (HODL HEI):
- Suitable for investors with conviction in Heima's cross-chain interoperability vision
- Requires patience to weather significant volatility
- Best for those with extended investment horizons (24+ months)
Active Trading:
- Dependent on technical analysis and price action within the $0.1157-$0.1204 range
- May capitalize on bounce opportunities from support levels
- Requires active monitoring and disciplined entry/exit strategies
Risk Management Approach
Asset Allocation Guidelines:
| Investor Profile | HEI Allocation | Rationale |
|---|---|---|
| Conservative | 0-2% of portfolio | Experimental asset with low market cap and high volatility |
| Moderate | 1-5% of portfolio | Small speculative position with defined risk tolerance |
| Aggressive | 3-10% of portfolio | Higher conviction in cross-chain technology thesis |
Risk Mitigation Strategies:
- Portfolio Diversification: Combine HEI with established Layer 1 alternatives and stablecoins
- Position Sizing: Use 2-3% position sizing to limit downside impact
- Dollar-Cost Averaging: Implement periodic purchases to reduce entry price risk
Secure Storage Options:
- Hot Wallets: MetaMask, Trust wallet for active trading and lower amounts
- Cold Storage: Hardware wallets (Ledger, Trezor) for long-term holdings exceeding $5,000
- Exchange Custody: Limit exchange holdings to active trading amounts only
V. Investment Risks & Challenges
Market Risk
- High Volatility: The token has experienced 84.81% depreciation over 12 months, demonstrating extreme price fluctuations
- Thin Liquidity: 24-hour trading volume of $39,625.76 relative to market cap suggests potential liquidity constraints
- Limited Holder Base: Only 830 token holders creates concentration risk and potential manipulation vulnerability
Regulatory Risk
- Cross-Border Uncertainty: Multi-chain operations across BSC and Ethereum expose the project to varying regulatory frameworks
- Policy Changes: Potential restrictions on Layer 1 platforms or ERC-20 token functionality across jurisdictions
- Compliance Exposure: Interoperability features may attract regulatory scrutiny
Technical Risk
- Network Security: Cross-chain bridge mechanisms present potential security vulnerabilities
- Smart Contract Risk: Dependency on secure contract implementations across multiple chains
- Adoption Uncertainty: Market acceptance of interoperability solution remains unproven
- Legacy Dependency: Evolution from Litentry Network carries inherited technical architecture risks
VI. Conclusion: Is Heima Network a Good Investment?
Investment Value Assessment
Heima Network presents a technology-focused investment thesis centered on cross-chain interoperability. However, the substantial 84.81% depreciation over one year and modest market capitalization of $11.1 million suggest either early-stage development challenges or market rejection of the current value proposition. The project remains highly speculative with uncertain long-term viability.
Investor Recommendations
✅ Beginner Investors:
- Implement micro-position sizing (0.5-1% of portfolio maximum)
- Use dollar-cost averaging approach over 6-12 month periods
- Store exclusively in hardware wallets for security
- Avoid using leverage or margin trading
✅ Experienced Investors:
- Conduct technical analysis within established support/resistance levels ($0.04-$0.12 range)
- Implement strict stop-loss orders at 20-30% below entry
- Monitor community developments and cross-chain partnership announcements
- Consider this a portfolio satellite position, not core holding
✅ Institutional Investors:
- Evaluate strategic long-term positioning only if project reaches product-market fit
- Conduct comprehensive due diligence on technical architecture and team credentials
- Assess cross-chain infrastructure security through independent audits
- Define clear exit criteria based on development milestones
⚠️ Important Disclaimer
Cryptocurrency investments carry substantial risk including potential total loss of capital. This analysis is provided for informational purposes only and does not constitute financial advice, investment recommendation, or solicitation to buy or sell. Past performance does not guarantee future results. Conduct your own research and consult with qualified financial advisors before making investment decisions.
Report Generated: December 22, 2025
Data Source: Gate Cryptocurrency Market Data
Disclaimer: This report contains market data and analysis only. It is not intended as investment guidance.
Heima Network (HEI) Frequently Asked Questions
FAQ
Q1: What is Heima Network (HEI) and what problem does it solve?
A: Heima Network is a Layer 1 blockchain designed to enable seamless multi-chain and cross-chain interoperability, evolved from the Litentry Network. It integrates advanced security modules and exchange chain abstraction support to facilitate robust blockchain operations. The project addresses the market need for unified cross-chain solutions, allowing users and developers to interact across multiple blockchain networks without friction.
Q2: What is the current market position and price of HEI as of December 22, 2025?
A: As of December 22, 2025, HEI is trading at $0.1196 per token with a market capitalization of $8,086,912.95 and a fully diluted valuation of $11,105,969.17. The token ranks #1,290 globally by market cap, with 67,616,329 tokens in circulation (72.82% of total supply) and a 24-hour trading volume of $39,625.76.
Q3: How has HEI performed historically, and what are the key price milestones?
A: HEI reached its all-time high of $1.25 on February 13, 2025, and its all-time low of $0.04755675 on October 11, 2025. Over the past year, HEI has declined 84.81%, representing a drawdown of approximately 96.19% from peak to trough. Recent performance shows a 30-day decline of 43.02%, indicating sustained downward pressure.
Q4: What are the main risks associated with investing in HEI?
A: Key risks include: severe price depreciation (84.81% year-over-year decline), relatively small market capitalization, thin liquidity with daily volume of only $39,625.76, limited holder base of 830 addresses creating concentration risk, technical vulnerabilities in cross-chain bridge mechanisms, regulatory uncertainty across multiple blockchain networks, and unproven market adoption of the interoperability solution.
Q5: What price targets and investment outlooks are projected for HEI in 2025-2030?
A: Short-term 2025 forecasts range from conservative ($0.0766-$0.1197) to optimistic ($0.1772-$0.1953) scenarios. Mid-term 2026-2027 projections show $0.1336-$0.1692 (24% upside) and $0.1302-$0.2335 (32% growth) respectively. Long-term base scenarios for 2030 range from $0.0764-$0.1312 (risk scenario) to $0.2936 (optimistic scenario), with significant variance reflecting market uncertainty.
Q6: Which blockchain networks does HEI operate on, and where can it be traded?
A: HEI is deployed on multiple networks as an ERC-20 token: Binance Smart Chain (BSC) and Ethereum. The contract address is 0xf8f173e20e15f3b6cb686fb64724d370689de083 on both networks. HEI is listed on 19 cryptocurrency exchanges, providing reasonable trading infrastructure and liquidity access across multiple platforms.
Q7: What is the recommended investment allocation for HEI based on investor risk profile?
A: Conservative investors should allocate 0-2% of their portfolio, moderate investors 1-5%, and aggressive investors 3-10%. It is recommended to use dollar-cost averaging for entry, implement stop-loss orders at 20-30% below entry price, and store significant holdings in hardware wallets. HEI should be viewed as a speculative satellite position rather than a core portfolio holding.
Q8: Is Heima Network a good long-term investment?
A: Heima Network presents a mixed investment case. While the cross-chain interoperability focus addresses genuine market needs and the project maintains presence on 19 exchanges with 830 active holders, the severe 84.81% price depreciation and modest market position suggest elevated risk. Long-term viability depends on achieving product-market fit, securing institutional partnerships, and successfully deploying interoperability features. This asset suits only experienced investors with high risk tolerance and conviction in cross-chain technology adoption, requiring independent research and consultation with qualified financial advisors before investment.
Disclaimer: This FAQ is for informational purposes only and does not constitute investment advice or financial recommendations. Cryptocurrency markets carry significant risk including potential total loss of investment. Conduct independent research and consult qualified financial advisors before making investment decisions.
Share
How to Buy Cryptocurrency


Trending Cryptocurrencies


2025 APT Price Prediction: Key Factors That Could Drive Aptos Token to New Heights

2025 KAS Price Prediction: Analyzing Key Factors Driving the Future Value of Kaspa

2025 MOVE Price Prediction: Analyzing Growth Factors and Market Trends in the Evolving Cryptocurrency Landscape

2025 SAGA Price Prediction: Analyzing Market Trends and Growth Potential in the Evolving Blockchain Ecosystem

Is Kaspa (KAS) a good investment?: Analyzing the potential of this high-throughput blockchain project
FOXY vs APT: Comparing Modern Threat Detection Systems in Enterprise Security Environments

Future Prospects for Baby Doge Coin: Expert Predictions 2024-2030

What is Polkadot (DOT) and how does its multi-chain architecture impact the token's 2026 value?

What is PIEVERSE token economics model with 1 billion supply breakdown?

How Is PIEVERSE Community Activity and Ecosystem Engagement Driving Its Token Value?

A Beginner's Guide to Risk Management in Online Trading