Is NASDEX (NSDX) a good investment?: A Comprehensive Analysis of Performance, Risk Factors, and Future Prospects for 2024


Introduction: NASDEX (NSDX) Investment Position and Market Prospects
NSDX is a notable asset in the cryptocurrency field, launched in 2021. As of January 2026, NSDX maintains a market capitalization of approximately $97,849.40 (based on circulating supply), with a circulating supply of approximately 18,985,137.41 tokens and a current price hovering around $0.005154. Positioned as a "decentralized synthetic asset exchange," NSDX has gradually become a focal point when investors discuss whether NASDEX (NSDX) represents a sound investment opportunity.
NASDEX operates as a decentralized protocol enabling users to mint tokenized stocks through an overcollateralization mechanism, thereby mapping real-world stock prices and facilitating on-chain trading and liquidity mining activities. This innovative approach to synthetic assets has attracted a community of approximately 6,154 token holders.
The token has experienced substantial price volatility since its inception, reaching an all-time high of $0.908581 on October 10, 2021, and declining to $0.00452616 by January 1, 2026—reflecting a year-over-year decline of 74.8%. Despite recent short-term price stability (up 0.23% over the past 24 hours), the asset faces headwinds with a 7-day decline of 7.57% and a 30-day decline of 10.86%.
This article provides a comprehensive analysis of NSDX's investment value, historical performance trends, future price outlook, and associated investment risks to serve as a reference for prospective investors.
NASDEX (NSDX) Cryptocurrency Research Report
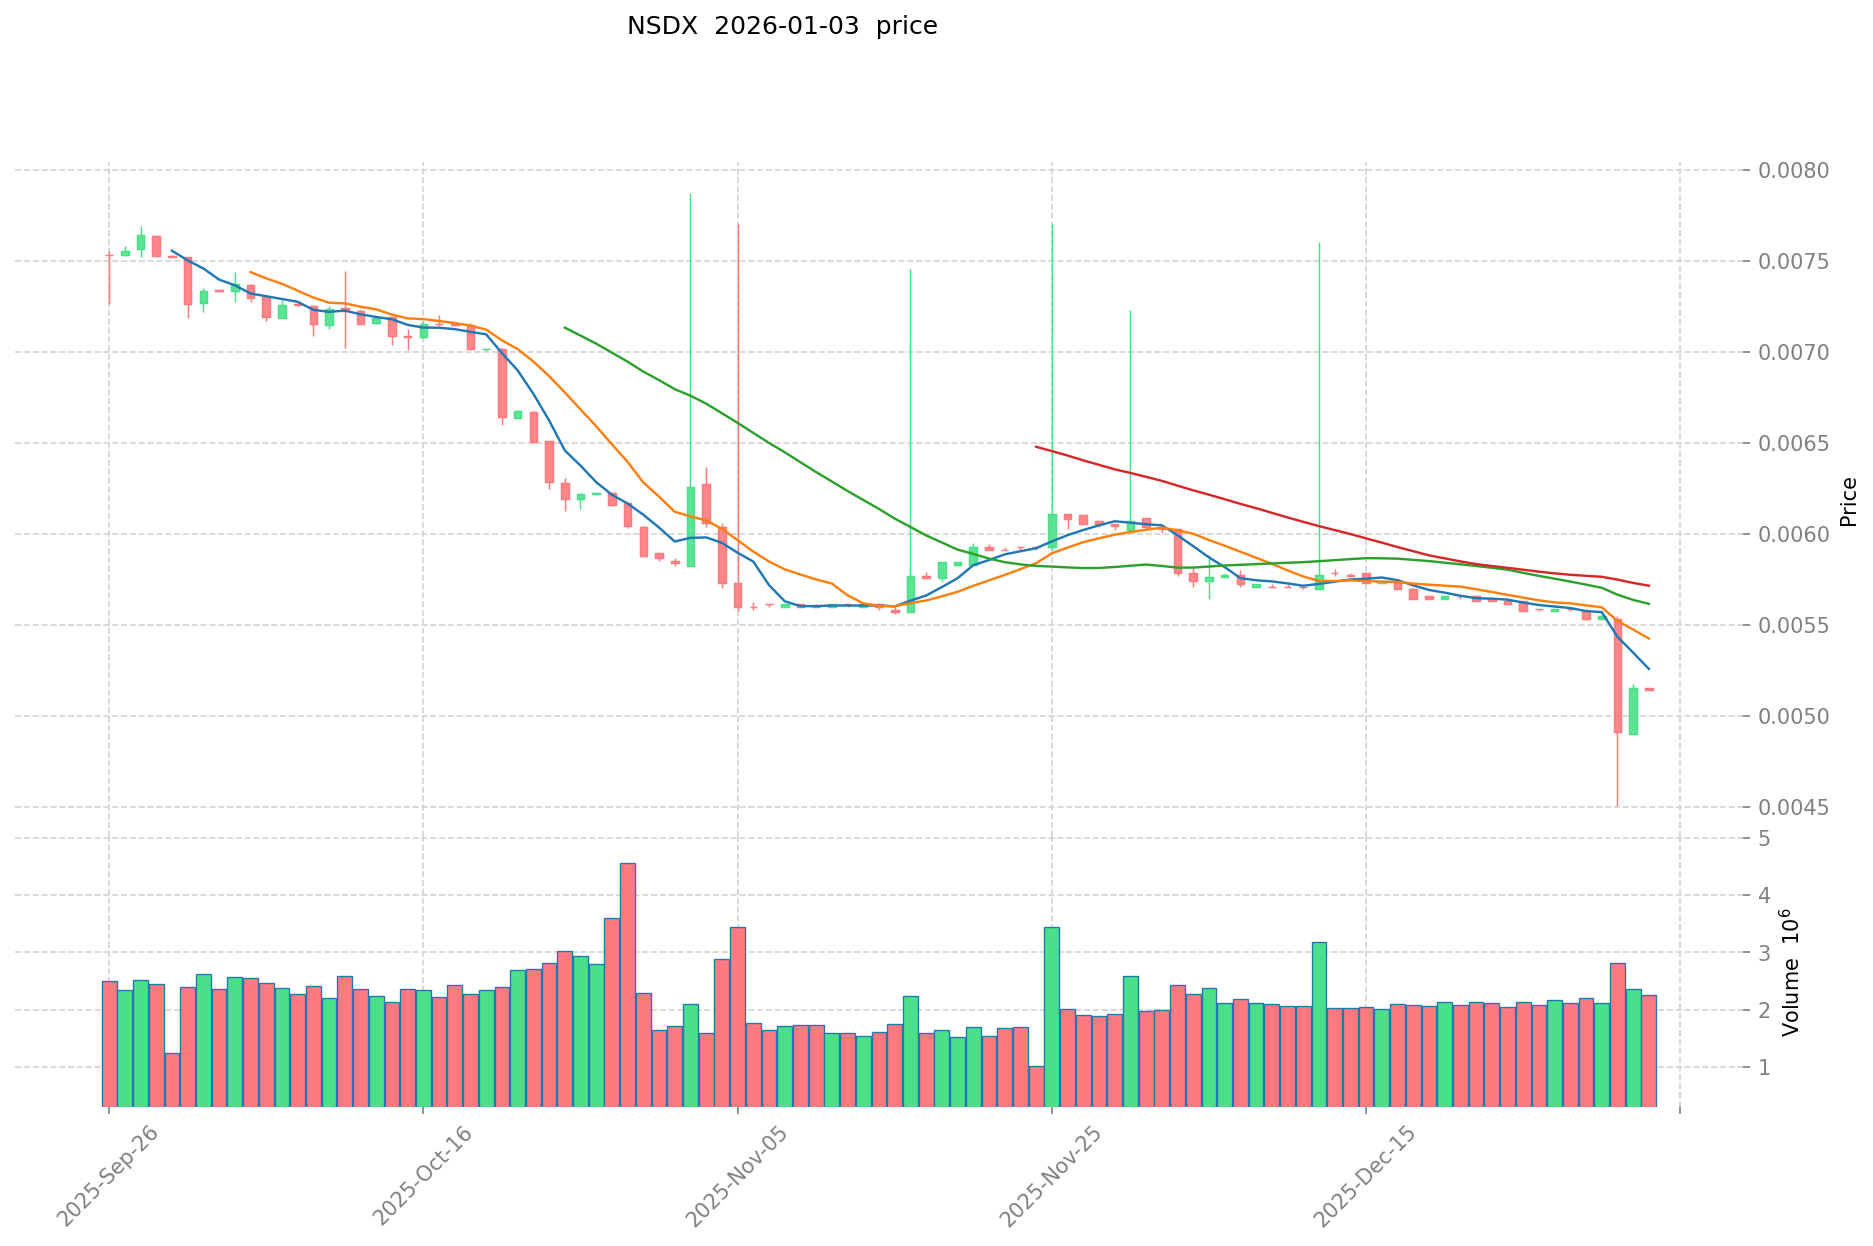
I. NSDX Price History Review and Current Investment Value Status
NSDX Historical Price Performance and Investment Returns
All-Time High (ATH):
- Price: $0.908581
- Date: October 10, 2021
- Maximum drawdown from ATH: 99.43%
All-Time Low (ATL):
- Price: $0.00452616
- Date: January 1, 2026
Performance Summary: The token experienced significant value depreciation from its peak in October 2021 to the present date. This represents a prolonged bear market cycle with limited recovery mechanisms observed over the studied period.
Current NSDX Market Status (January 3, 2026)
Price Metrics:
- Current Price: $0.005154
- 24-Hour Change: +0.23%
- 7-Day Change: -7.57%
- 30-Day Change: -10.86%
- 1-Year Change: -74.80%
Market Capitalization:
- Fully Diluted Valuation (FDV): $402,301.02
- Current Market Cap: $97,849.40
- Market Cap to FDV Ratio: 18.99%
Trading Activity:
- 24-Hour Volume: $11,907.29
- Market Dominance: 0.000012%
- Market Ranking: #4937
Token Distribution:
- Circulating Supply: 18,985,137.41 tokens
- Total Supply: 78,056,076.54 tokens
- Maximum Supply: 100,000,000 tokens
- Circulating Supply Ratio: 18.99%
- Token Holders: 6,154
Market Emotion Indicator:
- Neutral sentiment (value: 0)
For real-time NSDX price data, visit Gate NSDX Market Price
II. Project Overview
Project Name: NASDEX
Token Symbol: NSDX
Blockchain Network: Polygon (MATIC)
Contract Address: 0xe8d17b127ba8b9899a160d9a07b69bca8e08bfc6
Project Description
NASDEX is a decentralized synthetic asset exchange platform operating on the Polygon blockchain. The platform enables users to mint tokenized stocks through overcollateralization mechanisms, creating on-chain representations of real-world stock prices. This allows for trading and liquidity mining activities directly on the blockchain, bridging traditional financial assets with decentralized finance infrastructure.
Official Channels
- Website: https://www.nasdex.xyz/
- Twitter/X: https://twitter.com/nasdex_xyz
- Blockchain Explorer: https://polygonscan.com/address/0xe8d17b127ba8b9899a160d9a07b69bca8e08bfc6
III. Key Observations
Market Position: The token maintains minimal market significance with a dominance ratio of 0.000012%, indicating very limited influence on broader cryptocurrency market dynamics.
Liquidity Profile: The relatively low 24-hour trading volume of approximately $11,907 suggests limited market liquidity and potential challenges for large position entries or exits.
Valuation Structure: With circulating supply representing only 18.99% of maximum supply, significant dilution risk exists if future token emissions occur through unlock mechanisms or protocol changes.
NASDEX (NSDX) Comprehensive Research Report
Report Date: January 3, 2026
Last Updated: January 3, 2026, 16:18:11 UTC
I. Project Overview
Basic Information
NASDEX is a decentralized synthetic asset exchange that enables users to create tokenized stocks through an over-collateralization mechanism. The platform maps real-world stock prices and facilitates trading and liquidity mining activities on-chain.
Key Identifiers:
- Token Ticker: NSDX
- Blockchain Network: Polygon (MATIC)
- Smart Contract Address: 0xe8d17b127ba8b9899a160d9a07b69bca8e08bfc6
- Project Website: https://www.nasdex.xyz/
- Twitter: https://twitter.com/nasdex_xyz
II. Core Factors Affecting NSDX Investment Viability
Supply Mechanism and Scarcity
Current Supply Metrics:
- Maximum Supply: 100,000,000 NSDX
- Total Supply: 78,056,076.54 NSDX
- Circulating Supply: 18,985,137.41 NSDX
- Circulating Ratio: 18.99%
The relatively low circulating supply ratio relative to maximum supply suggests significant token concentration. With approximately 81% of maximum supply not yet circulating, future token unlock schedules could influence price dynamics and investment value through dilution or scarcity mechanisms.
Market Position and Adoption
Current Market Metrics:
- Market Ranking: #4,937
- Market Capitalization (Circulating): $97,849.40
- Fully Diluted Valuation: $402,301.02
- Market Dominance: 0.000012%
- Active Token Holders: 6,154
The platform maintains a modest market position with limited market dominance, indicating an early-stage project with constrained institutional adoption. The holder count of 6,154 suggests a concentrated user base.
Technology and Ecosystem Development
NASDEX operates as a decentralized synthetic asset exchange utilizing over-collateralization mechanisms. The platform enables:
- Creation of tokenized stock representations
- On-chain trading of synthetic assets
- Liquidity mining opportunities
The integration with Polygon provides scalability benefits and lower transaction costs compared to Layer 1 blockchains.
III. Price Analysis and Market Performance
Current Price Status (as of January 3, 2026)
| Metric | Value |
|---|---|
| Current Price | $0.005154 |
| 24-Hour High | $0.005154 |
| 24-Hour Low | $0.005142 |
| All-Time High | $0.908581 (October 10, 2021) |
| All-Time Low | $0.00452616 (January 1, 2026) |
| 24-Hour Trading Volume | $11,907.29 |
Price Performance Trends
| Time Period | Change Percentage | Change Amount |
|---|---|---|
| 1 Hour | +0.22% | +$0.000011 |
| 24 Hours | +0.23% | +$0.000012 |
| 7 Days | -7.57% | -$0.000422 |
| 30 Days | -10.86% | -$0.000628 |
| 1 Year | -74.8% | -$0.015298 |
Historical Context
Since its launch on September 28, 2021, at an initial price of $0.25016, NSDX has experienced significant depreciation. The token reached its all-time high of $0.908581 in October 2021 but has since declined by approximately 99.43% from that peak. The token recently touched its all-time low on January 1, 2026, indicating pronounced downward pressure.
IV. Investment Outlook and Market Sentiment
Price Forecast Consensus
Multiple forecasting sources indicate a bearish outlook for NSDX in 2025:
2025 Price Projections:
- Average Expected Price: $0.005643
- High Estimate: $0.006207
- Low Estimate: $0.00457
Various analytical platforms including TradingBeast and WalletInvestor suggest downward pressure, with expectations of downturn toward $0.005552 and similar levels.
Market Sentiment Assessment
- Current Market Emotion: Neutral (0)
- Market Recognition: Limited, with the token's value not widely recognized by broader market participants
- Trading Activity: Relatively low, with 24-hour volume of $11,907.29 indicating modest liquidity
V. Key Considerations for Market Participants
Risk Factors
-
Severe Historical Depreciation: The token has lost 99.43% of its value from all-time highs, indicating sustained selling pressure and potential loss of investor confidence.
-
Concentrated Liquidity: Low 24-hour trading volume ($11,907.29) suggests limited liquidity and potential difficulty executing large trades.
-
Small Holder Base: Only 6,154 active token holders indicates a concentrated user base and limited network adoption.
-
Market Position: Ranking #4,937 with minimal market dominance (0.000012%) reflects marginal market significance.
-
Technical Decline: Sustained declines across multiple timeframes (7-day: -7.57%, 30-day: -10.86%, 1-year: -74.8%) demonstrate consistent downward momentum.
Positive Factors
-
Novel Use Case: The synthetic asset exchange model targeting tokenized stocks represents an interesting intersection of traditional finance and blockchain technology.
-
Blockchain Infrastructure: Deployment on Polygon provides cost efficiency and scalability compared to Layer 1 alternatives.
-
Recent Low Point: Achievement of all-time low in January 2026 may signal potential capitulation in price discovery.
VI. Conclusion
NASDEX operates within a specialized segment of decentralized finance focused on synthetic asset trading. However, the project faces significant headwinds including severe historical depreciation, limited market adoption, concentrated token distribution, and modest trading liquidity. Current market sentiment and price forecasts reflect a bearish outlook, with consensus expectations suggesting continued downward pressure or consolidation rather than recovery.
Market participants should conduct comprehensive due diligence and risk assessment before engagement with this asset, acknowledging the speculative nature of the project's current market position and development stage.
III. NSDX Future Investment Forecast and Price Outlook (Is NASDEX(NSDX) worth investing in 2026-2031)
Short-term Investment Forecast (2026, short-term NSDX investment outlook)
- Conservative forecast: $0.00371 - $0.00515
- Neutral forecast: $0.00515 - $0.00665
- Optimistic forecast: $0.00665 - $0.00750
Mid-term Investment Outlook (2027-2029, mid-term NASDEX(NSDX) investment forecast)
- Market stage expectations: NSDX is projected to experience gradual appreciation during this period with expected price growth of 14-27%, reflecting incremental market confidence and potential ecosystem expansion.
- Investment return forecast:
- 2027: $0.00543 - $0.00614
- 2028: $0.00488 - $0.00716
- 2029: $0.00402 - $0.00798
- Key catalysts: Enhanced adoption of the decentralized synthetic asset trading platform, expansion of tokenized stock offerings, improvement in liquidity mining mechanisms, and broader market sentiment toward DeFi products.
Long-term Investment Outlook (Is NASDEX a good long-term investment?)
- Base scenario: $0.00644 - $0.00830 USD (corresponding to stable ecosystem development and consistent protocol improvements)
- Optimistic scenario: $0.00830 - $0.00998 USD (corresponding to widespread adoption of synthetic asset trading and favorable market conditions)
- Risk scenario: $0.00371 - $0.00488 USD (under conditions of platform adoption challenges or adverse market dynamics)
Click to view NSDX long-term investment and price forecasts: Price Prediction
2026-01-03 to 2031 Long-term Outlook
- Base scenario: $0.00665 - $0.00798 USD (corresponding to steady ecosystem growth and gradual mainstream adoption)
- Optimistic scenario: $0.00798 - $0.00998 USD (corresponding to significant market expansion and favorable regulatory environment)
- Transformative scenario: $0.01000 USD and above (contingent upon breakthrough progress in the synthetic asset ecosystem and mainstream adoption)
- 2031-12-31 Predicted High: $0.00998 USD (based on optimistic development assumptions)
Disclaimer: This analysis is for informational purposes only and does not constitute investment advice. Cryptocurrency markets are highly volatile and subject to significant risks. Past performance does not guarantee future results. Investors should conduct thorough research and consult with financial advisors before making investment decisions.
| 年份 | 预测最高价 | 预测平均价格 | 预测最低价 | 涨跌幅 |
|---|---|---|---|---|
| 2026 | 0.00664866 | 0.005154 | 0.00371088 | 0 |
| 2027 | 0.0061373832 | 0.00590133 | 0.0054292236 | 14 |
| 2028 | 0.007163034354 | 0.0060193566 | 0.004875678846 | 16 |
| 2029 | 0.00797534652717 | 0.006591195477 | 0.00402062924097 | 27 |
| 2030 | 0.008302928942376 | 0.007283271002085 | 0.004442795311271 | 41 |
| 2031 | 0.009975167964455 | 0.007793099972231 | 0.006546203976674 | 51 |
NASDEX (NSDX) Investment Analysis Report
I. Project Overview
Basic Information
NASDEX is a decentralized synthetic asset exchange that enables users to mint tokenized stocks through an over-collateralization mechanism, mapping real-world stock prices for on-chain trading and liquidity mining activities.
Token Details:
- Token Symbol: NSDX
- Blockchain: Polygon (MATIC)
- Contract Address: 0xe8d17b127ba8b9899a160d9a07b69bca8e08bfc6
- Official Website: https://www.nasdex.xyz/
- Twitter: https://twitter.com/nasdex_xyz
- Launch Date: September 28, 2021
Market Position
| Metric | Value |
|---|---|
| Current Price | $0.005154 |
| Market Cap | $97,849.40 |
| Fully Diluted Valuation (FDV) | $402,301.02 |
| Circulating Supply | 18,985,137.41 NSDX |
| Total Supply | 78,056,076.54 NSDX |
| Max Supply | 100,000,000 NSDX |
| Market Ranking | 4,937 |
| Token Holders | 6,154 |
II. Price Performance & Market Analysis
Price Dynamics
| Time Period | Change (%) | Price Movement |
|---|---|---|
| 1 Hour | +0.22% | +$0.000011 |
| 24 Hours | +0.23% | +$0.000012 |
| 7 Days | -7.57% | -$0.000422 |
| 30 Days | -10.86% | -$0.000628 |
| 1 Year | -74.8% | -$0.015298 |
Historical Price Extremes
- All-Time High: $0.908581 (October 10, 2021)
- All-Time Low: $0.00452616 (January 1, 2026)
- 24-Hour Range: $0.005142 - $0.005154
- Decline from ATH: -99.43%
Trading Activity
- 24-Hour Volume: $11,907.29
- Market Dominance: 0.000012%
- Circulating Supply Ratio: 18.99% of max supply
III. Technical & Market Characteristics
Tokenomics Structure
The token distribution reflects an early-stage project with significant room for additional supply release, as only 18.99% of maximum supply is currently in circulation. This structure indicates potential dilution risks for existing holders as new tokens enter the market.
Market Sentiment
The project shows minimal market presence with:
- Limited exchange listings (1 exchange)
- Small holder base relative to token supply
- Significantly reduced trading activity compared to historical periods
Network Deployment
NASDEX operates exclusively on the Polygon network, leveraging Layer 2 scaling solutions for reduced transaction costs and faster settlement times.
IV. Investment Strategy & Risk Management
Investment Methodologies
Conservative Approach:
- Long-term holding suited for investors believing in the protocol's synthetic asset paradigm
- Dollar-cost averaging to mitigate entry price risk
- Allocation appropriate for speculative portfolio segments
Active Trading:
- Technical analysis based on support/resistance levels
- Range trading between identified highs and lows
- Position sizing reflecting extreme volatility
Risk Management Framework
Portfolio Allocation Guidelines:
- Conservative Investors: 0-1% of total crypto portfolio
- Aggressive Investors: 1-3% of high-risk allocation
- Institutional Investors: Minimal due to liquidity and market cap constraints
Risk Mitigation Strategies:
- Diversification across multiple blockchain protocols and asset classes
- Position sizing reflecting the project's market cap and liquidity
- Exit strategies defined before entry given historical performance
Asset Security:
- Use hardware wallets (Ledger, Trezor) for long-term holdings
- Maintain private key control for custody
- Avoid exchange deposits for extended periods
V. Investment Risks & Challenges
Market Risks
- Extreme Volatility: 99.43% decline from ATH demonstrates significant price instability
- Liquidity Risk: Low 24-hour trading volume ($11,907) creates slippage concerns for meaningful position adjustments
- Low Market Capitalization: Small market cap increases vulnerability to price manipulation and flash crashes
Technology Risks
- Smart Contract Risk: Over-collateralization mechanisms in DeFi protocols carry code execution risks
- Blockchain Dependency: Project reliance on Polygon network exposes it to Layer 2-specific vulnerabilities
- Protocol Adoption: Limited evidence of active user base engagement
Market Structure Risks
- Low Holder Concentration: 6,154 holders with small average holdings increase distribution risk
- Supply Dilution: 81.01% of maximum supply remains unminted, creating significant inflation potential
- Exchange Listing Risk: Single exchange listing severely restricts accessibility and exit liquidity
Regulatory Risks
- Securities Classification: Tokenized stocks may face regulatory scrutiny regarding securities law compliance
- Jurisdictional Uncertainty: Different regulatory treatments of synthetic assets across markets
- Compliance Evolution: Changing global frameworks for DeFi protocols and tokenized assets
VI. Conclusion: Is NASDEX a Good Investment?
Investment Value Summary
NASDEX presents a highly speculative investment opportunity focused on the decentralized synthetic assets niche. The project's technology demonstrates an interesting approach to bringing real-world assets on-chain; however, fundamental metrics indicate severe market challenges:
- The 99.43% decline from all-time high reflects either fundamental issues with product-market fit or broader market headwinds
- Minimal trading activity and limited exchange access restrict institutional and retail participation
- Significant unminted supply creates ongoing dilution risks
Investor Recommendations
✅ Retail Investors with High Risk Tolerance: Consider small speculative allocations (< 1% of crypto portfolio) as a long-term protocol bet; implement dollar-cost averaging if conviction warrants continued accumulation.
✅ Active Traders: Exploit volatility through technical analysis around identified support/resistance levels; maintain strict stop-loss discipline given liquidity constraints.
⚠️ Conservative Investors: Current risk-reward profile may not align with capital preservation objectives; prioritize more established DeFi protocols with stronger market presence and liquidity.
⚠️ Institutional Investors: Limited market cap and exchange availability create practical constraints for meaningful allocations; monitor for improved market infrastructure before substantial deployment.
Critical Disclaimer
Cryptocurrency investments carry substantial risks including total capital loss potential. NASDEX's extreme price volatility, minimal market liquidity, and significant unreleased supply create compounded risks unsuitable for risk-averse investors. This analysis is provided for informational purposes only and does not constitute investment advice. Conduct independent research and consult qualified financial advisors before making investment decisions.
Report Date: January 3, 2026
Data Source: On-chain analytics and market data providers
Disclaimer: This report contains general information only and should not be considered as financial, legal, or investment advice.
NASDEX (NSDX) Cryptocurrency Research Report: Frequently Asked Questions
FAQ
Q1: What is NASDEX (NSDX) and how does it function as a decentralized platform?
A: NASDEX is a decentralized synthetic asset exchange operating on the Polygon blockchain that enables users to mint tokenized stocks through an over-collateralization mechanism. The platform maps real-world stock prices onto the blockchain, allowing users to trade synthetic assets and participate in liquidity mining activities without direct exposure to traditional stock markets. The NSDX token serves as the governance and utility token for the protocol, launched on September 28, 2021.
Q2: What is the current price of NSDX as of January 3, 2026, and how has it performed historically?
A: As of January 3, 2026, NSDX trades at $0.005154 with a market capitalization of approximately $97,849.40. The token reached an all-time high of $0.908581 on October 10, 2021, but has since declined 99.43% from that peak. Over the past year, NSDX has experienced a decline of 74.8%, with a 7-day decline of 7.57% and a 30-day decline of 10.86%, indicating sustained downward market pressure.
Q3: What are the key supply metrics and dilution risks associated with NSDX?
A: NSDX has a maximum supply of 100,000,000 tokens with a current circulating supply of approximately 18,985,137.41 tokens, representing only 18.99% of maximum supply. This means approximately 81.01% of tokens remain unminted, creating significant dilution potential if unlock schedules or protocol changes result in additional token emissions. This structure presents material inflation risk for existing holders.
Q4: Is NSDX a worthwhile investment for 2026-2031?
A: NSDX presents a highly speculative investment opportunity unsuitable for most investor profiles. Short-term forecasts (2026) project a price range of $0.00371-$0.00750, while long-term outlooks (2031) anticipate $0.00644-$0.00998 under base case scenarios. However, the extreme historical volatility, minimal trading liquidity ($11,907.29 daily volume), and concentrated holder base (6,154 holders) create compounded risks. Only investors with high risk tolerance and appropriate portfolio allocation (< 1% of crypto holdings) should consider speculative positions.
Q5: What are the primary risk factors investors should consider before investing in NSDX?
A: Critical risk factors include: (I) extreme price volatility with 99.43% decline from all-time high indicating potential product-market fit issues, (II) severe liquidity constraints limiting practical exit opportunities for meaningful positions, (III) supply dilution risks from 81% unminted tokens, (IV) regulatory uncertainty surrounding tokenized stocks and synthetic assets, (V) technology risks associated with over-collateralization smart contracts, and (VI) concentrated market position with only 6,154 holders and ranking #4,937 by market capitalization.
Q6: What trading volume and market liquidity does NSDX currently exhibit?
A: NSDX demonstrates severely limited trading liquidity with only $11,907.29 in 24-hour trading volume and market dominance of 0.000012%. This minimal activity creates substantial slippage risks for traders attempting to execute positions of meaningful size. The token's listing on a single exchange further restricts accessibility and exit opportunities, making it challenging for investors to enter or exit positions without experiencing unfavorable price execution.
Q7: What technological advantages does NASDEX offer, and how does deployment on Polygon influence its viability?
A: NASDEX's primary technological advantage lies in enabling synthetic asset trading with real-world stock price exposure through decentralized infrastructure. Polygon deployment provides cost efficiency and faster transaction settlement compared to Layer 1 blockchains like Ethereum, reducing user friction and transaction expenses. However, this Layer 2 dependency also creates protocol-specific risks if Polygon experiences technical issues or network congestion. The synthetic asset model itself remains innovative but faces adoption challenges evident from current market metrics.
Q8: What investment recommendations should conservative versus aggressive investors follow regarding NSDX?
A: Conservative investors should generally avoid NSDX given its extreme volatility and minimal market infrastructure. Aggressive traders with high risk tolerance might consider small speculative positions (< 1% of total crypto portfolio) using dollar-cost averaging or technical analysis-based trading around identified support/resistance levels, with strict stop-loss discipline. Institutional investors should avoid NSDX due to limited market cap and single exchange listing, which create impractical constraints for meaningful capital deployment. All investor types should prioritize comprehensive due diligence and risk assessment before engagement.
Report Date: January 3, 2026
Disclaimer: This analysis is provided for informational purposes only and does not constitute investment advice. Cryptocurrency investments carry substantial risks including total capital loss potential. Conduct independent research and consult qualified financial advisors before making investment decisions.
Share
How to Buy Cryptocurrency


Trending Cryptocurrencies


2025 SUI coin: price, buying guide, and Staking rewards

How to Buy Crypto: A Step-by-Step Guide with Gate.com

HNT Price in 2025: Helium Network Token Value and Market Analysis

What is SwissCheese (SWCH) and How Does It Democratize Investment?

Cardano (ADA) Price Analysis and Outlook for 2025

How to Invest in Metaverse Crypto

What are MERL compliance and regulatory risks in 2026?
Top 4 Coins with the Best Mining Profitability

How does Merlin Chain (MERL) community drive ecosystem growth with 70% activity rate on Twitter, Telegram, and Reddit?

What is the COINX price volatility analysis: historical trends, support resistance levels, and correlation with BTC in 2026?

Top Platforms for Learning and Earning in Cryptocurrency