KCT vs GMX: The Battle of Cryptocurrency Trading Platforms Heats Up

Introduction: KCT vs GMX Investment Comparison
In the cryptocurrency market, the comparison between Konnect (KCT) vs GMX (GMX) has been an unavoidable topic for investors. The two not only show significant differences in market cap ranking, application scenarios, and price performance but also represent different positions in the crypto asset landscape.
Konnect (KCT): Since its launch, it has gained market recognition for its aim to build a travel token economy ecosystem by integrating web3 utilities with web2-based membership utilities.
GMX (GMX): Established as a decentralized and sustainable exchange, it has been recognized for its utility and governance token features, which also account for 30% of the platform's fee generation.
This article will comprehensively analyze the investment value comparison between Konnect and GMX, focusing on historical price trends, supply mechanisms, institutional adoption, technological ecosystems, and future predictions, attempting to answer the question investors care about most:
"Which is the better buy right now?"
I. Price History Comparison and Current Market Status
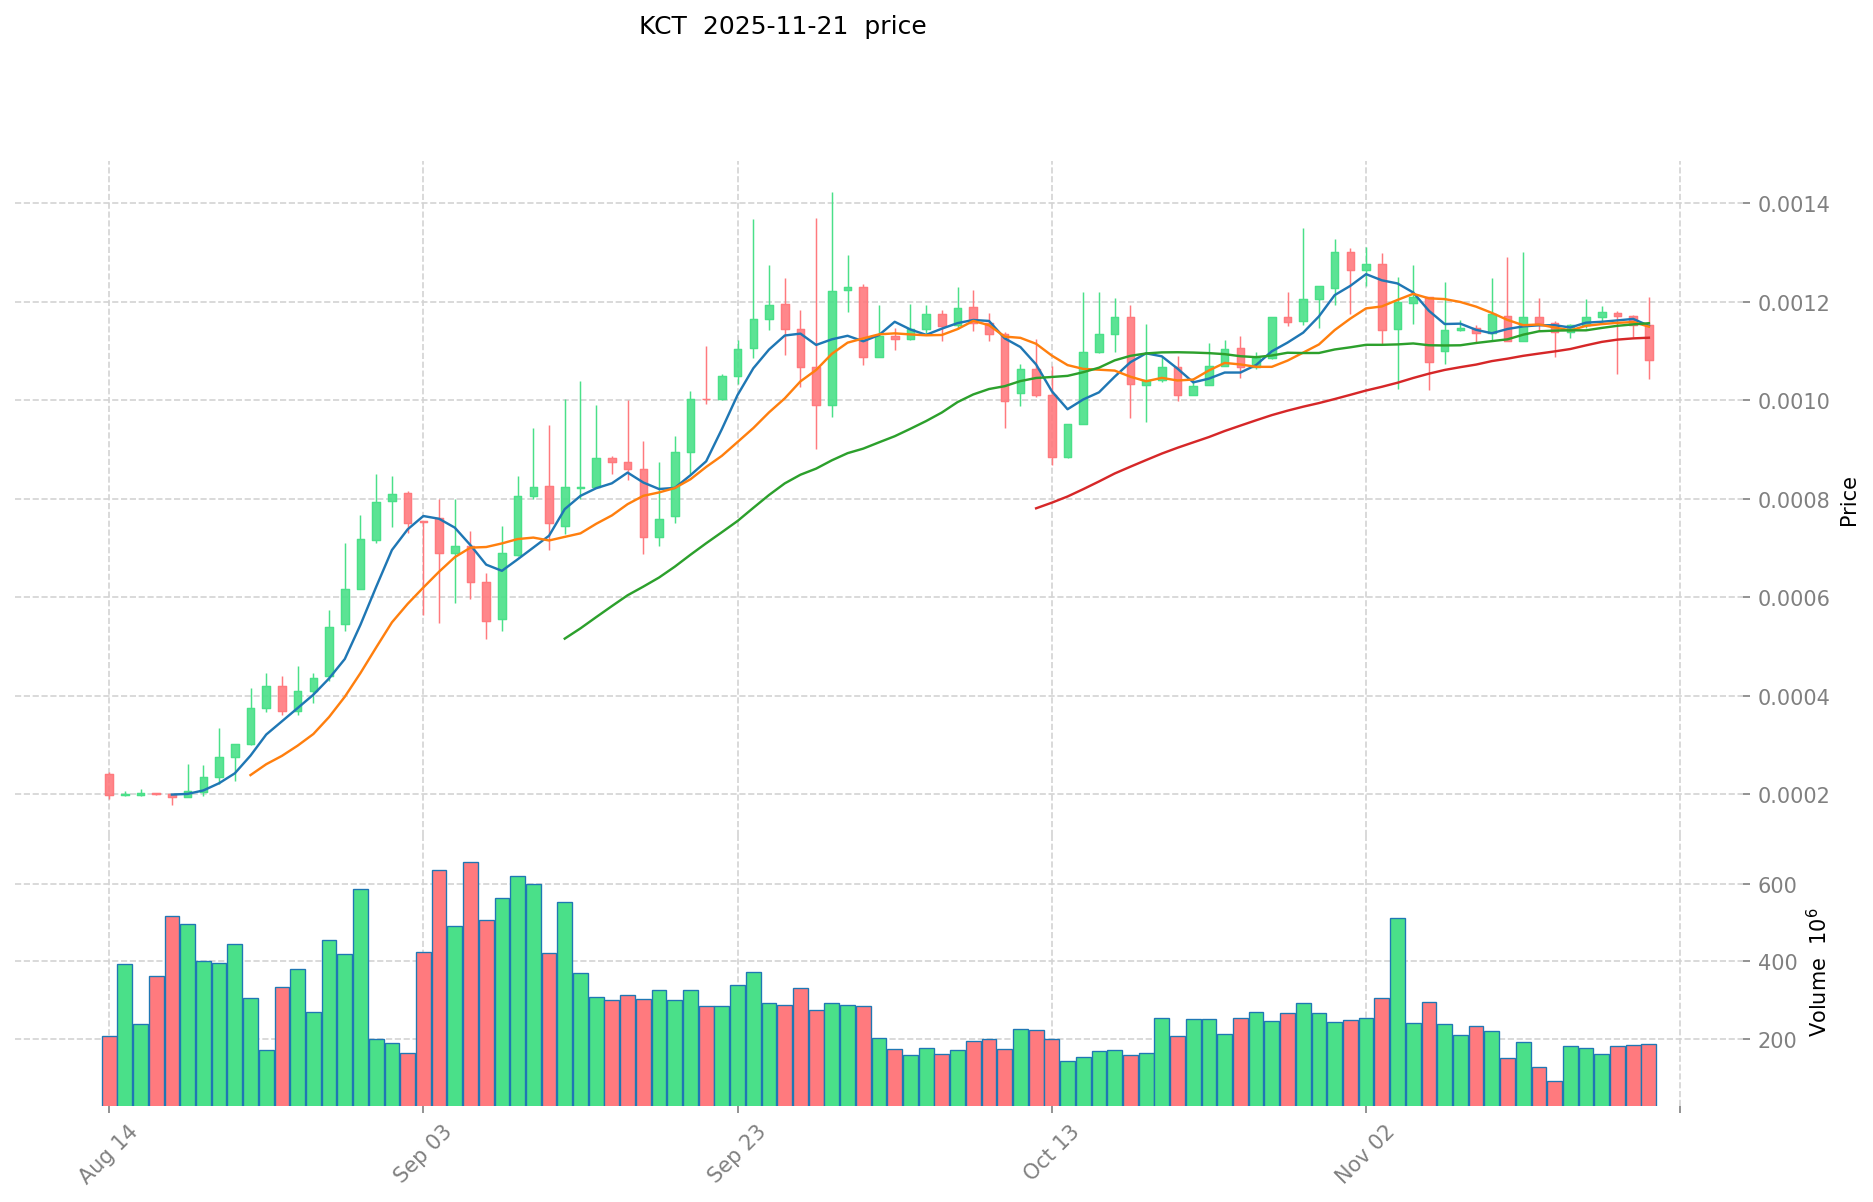
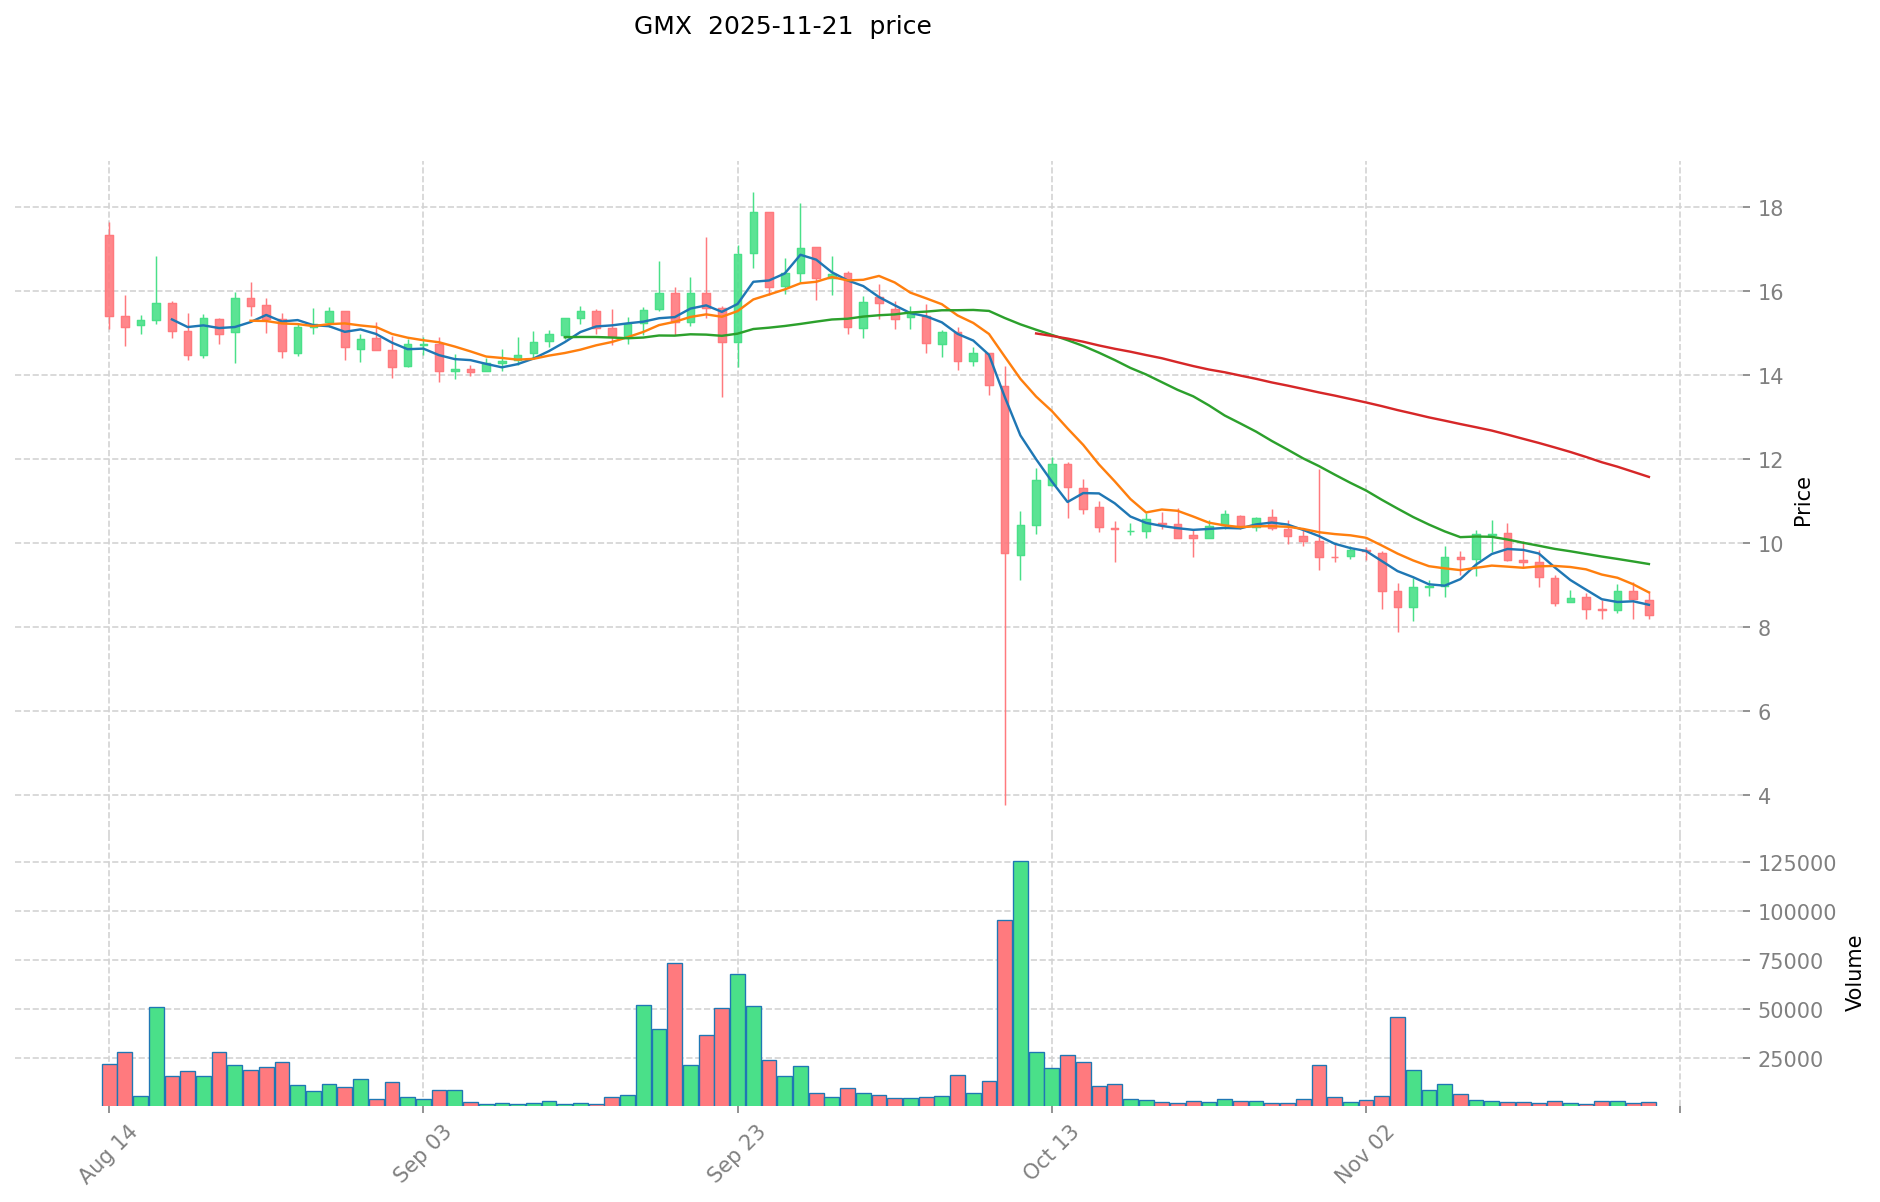
KCT (Coin A) and GMX (Coin B) Historical Price Trends
- 2023: KCT reached its all-time high of $0.04 on December 13, 2023.
- 2023: GMX hit its all-time high of $91.07 on April 18, 2023.
- Comparative analysis: In the recent market cycle, KCT dropped from its high of $0.04 to a low of $0.000088, while GMX declined from $91.07 to $6.92.
Current Market Situation (2025-11-22)
- KCT current price: $0.0010272
- GMX current price: $8.086
- 24-hour trading volume: KCT $198,936.35 vs GMX $44,024.68
- Market Sentiment Index (Fear & Greed Index): 14 (Extreme Fear)
Click to view real-time prices:
- Check KCT current price Market Price
- Check GMX current price Market Price
II. Key Factors Affecting the Investment Value of KCT vs GMX
Supply Mechanisms Comparison (Tokenomics)
- KCT: Employs a deflationary model with token burning mechanisms, creating scarcity over time
- GMX: Features a maximum supply cap with emissions that decrease over time, distributing 30% of platform fees to GMX stakers
- 📌 Historical Pattern: Deflationary tokens like KCT tend to appreciate during bull markets due to supply constraints, while GMX's fee-sharing model provides more consistent value during various market conditions.
Institutional Adoption and Market Applications
- Institutional Holdings: GMX has attracted more institutional interest due to its established track record and fee-sharing model
- Enterprise Adoption: GMX leads in derivatives trading infrastructure adoption, while KCT focuses more on retail applications
- Regulatory Attitudes: Both protocols face similar regulatory scrutiny, though GMX's longer operational history provides more regulatory clarity
Technical Development and Ecosystem Building
- KCT Technical Upgrades: Focus on improving security features and cross-chain functionality
- GMX Technical Development: Advancing its V2 with enhanced liquidity provision and reduced price impact for traders
- Ecosystem Comparison: GMX has a more established DeFi ecosystem with proven revenue generation, while KCT is expanding its integration partnerships
Macroeconomic Factors and Market Cycles
- Performance During Inflation: GMX has demonstrated stronger performance during inflationary periods due to its fee-sharing model that generates real yield
- Monetary Policy Impact: Both tokens are affected by broader crypto market reactions to interest rate changes
- Geopolitical Factors: Cross-border trading demand benefits GMX's decentralized perpetual exchange functionality during periods of financial uncertainty
III. 2025-2030 Price Prediction: KCT vs GMX
Short-term Forecast (2025)
- KCT: Conservative $0.00061716 - $0.0010286 | Optimistic $0.0010286 - $0.001532614
- GMX: Conservative $4.11621 - $8.071 | Optimistic $8.071 - $9.44307
Mid-term Forecast (2027)
- KCT may enter a growth phase, with prices expected in the range of $0.0011592054564 - $0.0023501699664
- GMX may enter a steady growth phase, with prices expected in the range of $5.11367058825 - $12.13243414075
- Key drivers: Institutional capital inflow, ETFs, ecosystem development
Long-term Forecast (2030)
- KCT: Base scenario $0.002223527056119 - $0.002498345006876 | Optimistic scenario $0.002498345006876 - $0.002598278807151
- GMX: Base scenario $7.511350555821601 - $11.922778660034287 | Optimistic scenario $11.922778660034287 - $17.764940203451088
Disclaimer: This forecast is for informational purposes only and should not be considered as financial advice. Cryptocurrency markets are highly volatile and unpredictable. Always conduct your own research before making any investment decisions.
KCT:
| 年份 | 预测最高价 | 预测平均价格 | 预测最低价 | 涨跌幅 |
|---|---|---|---|---|
| 2025 | 0.001532614 | 0.0010286 | 0.00061716 | 0 |
| 2026 | 0.00189529836 | 0.001280607 | 0.00067872171 | 24 |
| 2027 | 0.0023501699664 | 0.00158795268 | 0.0011592054564 | 54 |
| 2028 | 0.002835448305408 | 0.0019690613232 | 0.001555558445328 | 91 |
| 2029 | 0.002594435199448 | 0.002402254814304 | 0.001705600918155 | 133 |
| 2030 | 0.002598278807151 | 0.002498345006876 | 0.002223527056119 | 143 |
GMX:
| 年份 | 预测最高价 | 预测平均价格 | 预测最低价 | 涨跌幅 |
|---|---|---|---|---|
| 2025 | 9.44307 | 8.071 | 4.11621 | 0 |
| 2026 | 11.29657515 | 8.757035 | 5.0790803 | 8 |
| 2027 | 12.13243414075 | 10.026805075 | 5.11367058825 | 24 |
| 2028 | 11.52280439219 | 11.079619607875 | 9.19608427453625 | 37 |
| 2029 | 12.544345320036075 | 11.3012120000325 | 9.832054440028275 | 39 |
| 2030 | 17.764940203451088 | 11.922778660034287 | 7.511350555821601 | 47 |
IV. Investment Strategy Comparison: KCT vs GMX
Long-term vs Short-term Investment Strategy
- KCT: Suitable for investors focused on travel and membership utility ecosystems
- GMX: Suitable for investors seeking stable yield and exposure to decentralized derivatives trading
Risk Management and Asset Allocation
- Conservative investors: KCT: 20% vs GMX: 80%
- Aggressive investors: KCT: 40% vs GMX: 60%
- Hedging tools: Stablecoin allocation, options, cross-token portfolios
V. Potential Risk Comparison
Market Risk
- KCT: Higher volatility due to smaller market cap and newer project status
- GMX: Exposure to derivatives market fluctuations and liquidity risks
Technical Risk
- KCT: Scalability, network stability as the ecosystem grows
- GMX: Smart contract vulnerabilities, potential issues with V2 upgrade implementation
Regulatory Risk
- Global regulatory policies may impact both tokens, with GMX potentially facing more scrutiny due to its derivatives trading focus
VI. Conclusion: Which Is the Better Buy?
📌 Investment Value Summary:
- KCT advantages: Deflationary model, potential for growth in travel token economy
- GMX advantages: Established fee-sharing model, proven track record in DeFi
✅ Investment Advice:
- Novice investors: Consider a smaller allocation to GMX for exposure to DeFi yield
- Experienced investors: Balanced portfolio with both KCT and GMX, adjusting based on risk tolerance
- Institutional investors: Higher allocation to GMX due to its established market position and consistent fee generation
⚠️ Risk Warning: Cryptocurrency markets are highly volatile. This article does not constitute investment advice. None
VII. FAQ
Q1: What are the main differences between KCT and GMX? A: KCT is a travel token economy ecosystem with a deflationary model, while GMX is a decentralized derivatives exchange with a fee-sharing model. KCT focuses on travel and membership utilities, whereas GMX provides exposure to decentralized trading and consistent yield generation.
Q2: Which token has shown better price performance recently? A: GMX has shown better price stability and performance recently. As of November 22, 2025, GMX is trading at $8.086, while KCT is at $0.0010272. GMX has also demonstrated stronger resilience during market downturns.
Q3: How do the supply mechanisms of KCT and GMX differ? A: KCT employs a deflationary model with token burning mechanisms, creating scarcity over time. GMX features a maximum supply cap with emissions that decrease over time, distributing 30% of platform fees to GMX stakers.
Q4: Which token is more suitable for long-term investment? A: Both tokens have long-term potential, but for different reasons. GMX may be more suitable for investors seeking stable yield and exposure to decentralized derivatives trading. KCT might appeal to those interested in the growth of travel token economies and membership utility ecosystems.
Q5: What are the main risks associated with investing in KCT and GMX? A: KCT faces higher volatility due to its smaller market cap and newer project status. GMX is exposed to derivatives market fluctuations and liquidity risks. Both tokens are subject to regulatory risks, with GMX potentially facing more scrutiny due to its focus on derivatives trading.
Q6: How do institutional investors view KCT and GMX? A: Institutional investors have shown more interest in GMX due to its established track record and fee-sharing model. GMX's longer operational history also provides more regulatory clarity, making it potentially more attractive to institutional capital.
Q7: What are the price predictions for KCT and GMX by 2030? A: By 2030, KCT is predicted to reach between $0.002223527056119 and $0.002598278807151 in the base scenario. GMX is forecasted to be between $7.511350555821601 and $17.764940203451088 in the base to optimistic scenarios. However, these predictions are speculative and should not be considered financial advice.
Share
Content
Introduction: KCT vs GMX Investment Comparison
I. Price History Comparison and Current Market Status
II. Key Factors Affecting the Investment Value of KCT vs GMX
III. 2025-2030 Price Prediction: KCT vs GMX
IV. Investment Strategy Comparison: KCT vs GMX
V. Potential Risk Comparison
VI. Conclusion: Which Is the Better Buy?
VII. FAQ
How to Buy Cryptocurrency


Trending Cryptocurrencies


Is Perpetual Protocol (PERP) a Good Investment?: A Comprehensive Analysis of Its Long-term Potential in the DeFi Derivatives Market

Is NASDEX (NSDX) a good investment?: Analyzing the potential of this decentralized derivatives exchange token
What Do Derivatives Market Signals Reveal About MYX's 20% Pullback Risk?

What Are the Key Signals from Crypto Derivatives Markets in 2025?
How Will Derivatives Market Signals Impact HBAR's Price in 2025?

How Do Derivative Market Signals Indicate UNI's Potential Price Recovery in 2025?

Is FreeStyle Classic Token (FST) a good investment?: A Comprehensive Analysis of Risks, Returns, and Market Potential

Understanding Polymarket: A Guide to Decentralized Prediction Markets

Is Arena-Z (A2Z) a good investment?: A Comprehensive Analysis of Risks, Opportunities, and Market Potential

Is Turtle (TURTLE) a good investment?: A Comprehensive Analysis of Risks, Opportunities, and Market Potential in 2024

Is TCOM (TCOM) a good investment?: A comprehensive analysis of China's leading online travel platform's growth potential and market outlook