Master Japanese candlestick analysis to improve your trading strategies in the crypto market. This in-depth guide covers Japanese candlestick patterns, signal interpretation, and reading techniques tailored for traders and newcomers on Gate.
What Are Japanese Candlesticks?
Japanese candlesticks are a time-honored technical analysis tool originating in seventeenth-century Japan, where they were first used to analyze rice markets. Today, candlesticks are among the most powerful methods for forecasting price movements across a range of financial markets, including crypto.
By analyzing Japanese candlestick patterns on charts, traders can interpret market psychology and anticipate potential future trends. This approach focuses on understanding investor behavior and their reactions to price volatility.
The primary objective of candlestick analysis is to grasp investor psychology and actions during market moves. For instance, when prices surge, greed often takes hold, leading investors to keep buying. Conversely, when prices fall sharply, fear sets in, triggering intense selling waves.
These emotional cycles of greed and fear repeat throughout all financial markets, and recognizing them enables traders to make more rational decisions.
How to Read Japanese Candlesticks
Every Japanese candlestick provides key information that helps traders interpret price action for a specific time interval. This includes:
- The highest price reached during the selected period
- The lowest price reached during that period
- The closing price at the end of the period
- The opening price at the start of the period
- The trading volume captured during the candlestick’s lifespan
Understanding these components together allows traders to decipher the price narrative and the ongoing struggle between buyers and sellers.
Candlestick Color and Its Meaning
The first thing that stands out in Japanese candlesticks is color. A green (or white, on some platforms) candlestick means the closing price is higher than the opening price—signaling strong buying pressure. A red (or black) candle indicates the close is below the open, reflecting dominant selling pressure.
The more distinct the candlestick’s color and the larger its body, the stronger the prevailing trend in the market.
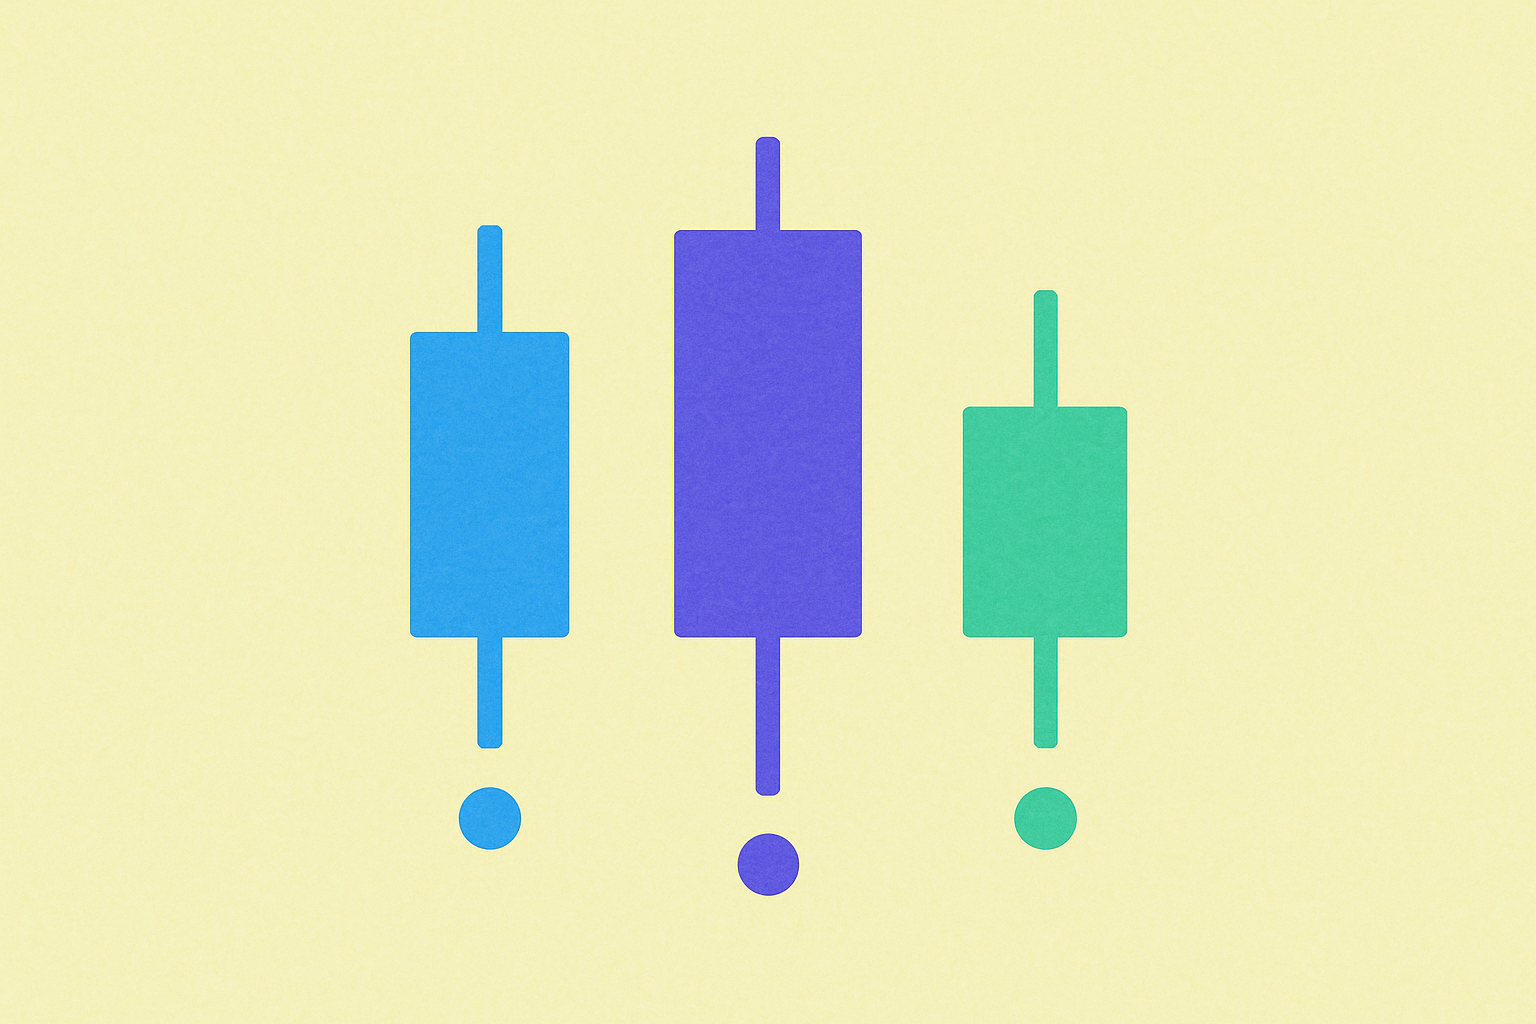
Key Components of a Candlestick
A Japanese candlestick consists of several core parts, each conveying crucial information:
-
Body: The thick portion of the candlestick, representing the distance between the opening and closing prices. In a green candle, a large body signals intense buying. In a red candle, a large body indicates strong selling dominance.
-
Wick: The thin line extending above and below the candlestick body, marking the highest and lowest prices during the period. The wick’s length reflects the intensity of the battle between buyers and sellers.
-
Open: The price where the candlestick begins forming.
-
Close: The price at which the candlestick closes at the end of the time frame.
Recognizing how these elements interact helps traders interpret trend strength and the likelihood of continuation or reversal.
Candlestick Time Frame and Its Significance
Each candlestick represents a defined time frame, ranging from one minute to a month or more. Common intervals include: 1 minute, 5 minutes, 15 minutes, 1 hour, 4 hours, 1 day, 1 week, and 1 month.
The longer the candlestick’s time frame, the greater its impact and reliability in determining the market’s overall trend. For example, a daily candlestick carries far more weight in long-term trading decisions than a one-minute candle.
Mastering Japanese candlestick patterns enables traders to anticipate potential reversal points or confirm ongoing trends. Here are the most essential patterns every trader should recognize:
The hammer is one of the strongest bullish reversal signals. It features a small body near the top and a long lower wick, at least twice the length of the body.
The narrative behind this pattern is compelling: price opens at a certain level, heavy selling pushes it sharply lower, but buyers step in forcefully and drive the price back up, resulting in a close near the open.
This pattern marks a strong rejection of lower prices and often signals the end of a downtrend and the start of an upward move. The pattern is most significant when it appears after a prolonged downtrend and at key support levels.
Bullish Engulfing Candlestick
This pattern consists of two consecutive candles: a small red candle followed by a large green candle that completely engulfs the previous body. It typically appears at the end of a downtrend and signals a powerful reversal.
The substantial green body of the second candle highlights decisive buying power entering the market. This shows buyers have taken control, driving the price higher and overcoming earlier selling pressure.
The larger the green candle and the higher the volume, the more reliable the signal to initiate a buy position.
Bearish Engulfing Candlestick
This is the direct opposite of the bullish engulfing pattern. It features a small green candle followed by a large red candle that fully engulfs the previous green body.
This pattern appears at the end of an uptrend and signals the onset of a bearish reversal. The large red body indicates a strong rejection of higher prices and that sellers now control the market.
This pattern is a solid signal for taking profit on long positions or entering a short position when trading a downtrend.
Morning Star Candle
The morning star is among the strongest bullish reversal patterns, formed by three consecutive candles:
- A large red candle reflecting ongoing bearish momentum
- A small-bodied candle (red or green) signaling market indecision
- A large green candle confirming the bullish reversal
This sequence shows weakening selling pressure and the emergence of buying control. The small middle candle marks a pause and uncertainty, while the final green candle confirms buyers have regained dominance.
This pattern typically appears at the end of a downtrend near major support levels and is a strong buy signal.
Shooting Star Candle
The shooting star is a bearish reversal pattern appearing at the end of an uptrend. It is identified by a small body near the bottom and a long upper wick, resembling a shooting star.
This pattern tells a distinct story: price surges during the period, but sellers aggressively reject higher levels, pushing the price back down so the candle closes near the open.
This indicates waning buying strength and market rejection of higher prices. It is a strong signal to take profits from long positions or to consider short positions.
The Crypto Market: Highly Volatile and Unstable
The crypto market is far more volatile compared to traditional financial markets. This volatility arises from several key factors:
First, crypto trading volume remains much lower than that of traditional markets, making it more sensitive to large orders. Second, the overall crypto market cap is still relatively small, amplifying the impact of news and events on prices.
That’s why it’s critical to learn how to deeply interpret Japanese candlesticks and understand the full market context, rather than relying solely on memorizing patterns. Each pattern must be understood within its proper context and with consideration for surrounding conditions.
Candlesticks Alone Don’t Provide the Whole Picture
While Japanese candlestick analysis is powerful, it should never be used in isolation. You must always consider the broader market landscape and overall context before making any trading decision.
Ask yourself: What’s the prevailing market trend? Are we in a bull or bear market? What are the key support and resistance levels?
Always keep these critical factors in mind:
- Have there been any recent technical updates or new partnerships affecting the crypto asset or its project?
- What are current global economic conditions and their impact on risk markets?
- What geopolitical factors or major events could influence the market?
- What is the regulatory stance on crypto in different countries?
Blending Japanese candlestick analysis with fundamental analysis yields a more comprehensive and accurate market perspective.
Reading Japanese Candlesticks: A Skill Built Through Practice
Mastering Japanese candlestick reading is not an overnight process. Developing this skill takes years of experience and consistent practice before you can confidently and accurately interpret the market.
The best way to enhance your candlestick reading skills is through ongoing chart analysis. Review as many crypto charts as possible, analyze their patterns, and try to interpret the narrative the candlesticks present.
Every chart tells a unique story about the battle between buyers and sellers, and about the emotions of fear and greed that drive market participants. Over time and with practice, you’ll start to recognize these patterns intuitively and improve your ability to forecast market movements.
Remember, Japanese candlesticks are among the most powerful technical indicators available to traders. When you master their interpretation and combine them with other technical analysis tools, you can build a robust trading strategy to protect your capital and achieve sustained profits in the crypto market.
FAQ
What Are Japanese Candlesticks? What Are Their Main Components (Close Price, Open Price, High Price, Low Price)?
Japanese candlesticks illustrate price movement in the market over a given time frame. Each consists of a body showing the open and close prices, and wicks representing the high and low. The color signals upward movement (white) or downward movement (black).
How Do You Distinguish Between Bullish and Bearish Candlesticks? What Do Red and Green Candlesticks Show?
Green candlesticks indicate rising prices, with the close above the open. Red candlesticks show falling prices, with the close below the open. The upper wick marks the highest price, and the lower wick the lowest.
What Are the Most Common Japanese Candlestick Patterns? For Example, Hammer Line, Engulfing Pattern, Isolated Doji Star? How Can You Recognize Them?
The most common patterns are: the hammer line (signals reversal), engulfing pattern (shows trend change), and doji star (delivers strong buy/sell signals). You can identify them by observing the wick and body shapes.
How Can You Assess Market Trends and Potential Buy/Sell Signals Using Japanese Candlestick Patterns?
Use candlestick patterns to spot bullish/bearish trends and reversals. Major patterns include the engulfing pattern for trend reversal and the doji star for signaling uncertainty. Pay attention to the length of wicks and bodies to gauge signal strength.
How Does Japanese Candlestick Analysis Differ in Forex, Stock, and Crypto Markets?
While candlestick analysis is similar across forex, stocks, and crypto, trading frequency and volatility vary. Forex is less volatile, while crypto’s higher volatility demands faster and more responsive pattern analysis.
How Do You Combine Time Frames (Daily, Weekly, Monthly) with Japanese Candlesticks for More Accurate Analysis?
Combine daily, weekly, and monthly charts to identify trends and reversals. Shorter time frames provide trading signals, while longer time frames reveal the broader market trend—delivering a well-rounded and accurate perspective.
What Are the Advantages of Japanese Candlestick Analysis Compared to Other Technical Methods (Like Moving Averages and MACD)?
Candlestick analysis gives an immediate visual snapshot of price and volume, reflecting market psychology more directly than moving averages or MACD. It exposes genuine price patterns and supplies faster, more precise entry and exit signals.
What Common Mistakes Do Beginners Make with Japanese Candlesticks, and How Can They Be Avoided?
The main mistake is focusing on each individual candle instead of the overall trend. Avoid this by watching for larger patterns and broader trends, and concentrate on major support and resistance levels rather than analyzing candles in isolation.
* The information is not intended to be and does not constitute financial advice or any other recommendation of any sort offered or endorsed by Gate.