This comprehensive analysis compares LL and RUNE, two distinct blockchain protocols reshaping the crypto market landscape. LL, an Ethereum Layer 2 solution launched in 2024, delivers gasless transactions for decentralized applications, while RUNE, THORChain's multi-chain liquidity protocol since 2019, enables seamless cross-chain swaps. The article examines historical price trends, current market status, tokenomics, ecosystem development, and institutional adoption to address investors' critical question: which asset offers better investment value? With detailed price forecasts spanning 2026-2031, allocation strategies tailored for conservative and aggressive investors, and thorough risk analysis covering market, technical, and regulatory factors, this guide equips investors with actionable insights. Access real-time prices on Gate and discover which protocol aligns with your investment objectives through data-driven comparisons and expert recommendations.
Introduction: LL vs RUNE Investment Comparison
In the cryptocurrency market, the comparison between LL vs RUNE has consistently been a topic that investors cannot avoid. Both exhibit notable differences in market cap ranking, application scenarios, and price performance, representing distinct positioning within the crypto asset landscape.
LL (LightLink): Launched in 2024, it has gained market recognition through its positioning as an Ethereum Layer 2 blockchain offering instant, gasless transactions for dApps and enterprise users.
RUNE (THORChain): Since its 2019 launch, it has been recognized for its multi-chain liquidity protocol facilitating cross-chain swaps, operating as a decentralized liquidity network with native cross-chain capabilities.
This article will comprehensively analyze the investment value comparison between LL vs RUNE across historical price trends, supply mechanisms, ecosystem development, and future outlook, attempting to address investors' most pressing question:
"Which is the better buy right now?"
I. Historical Price Comparison and Current Market Status
LL (Coin A) and RUNE (Coin B) Historical Price Trends
-
2024: LL reached its all-time high of $0.3 on April 24, 2024. Following this peak, the token experienced significant downward pressure throughout the subsequent period.
-
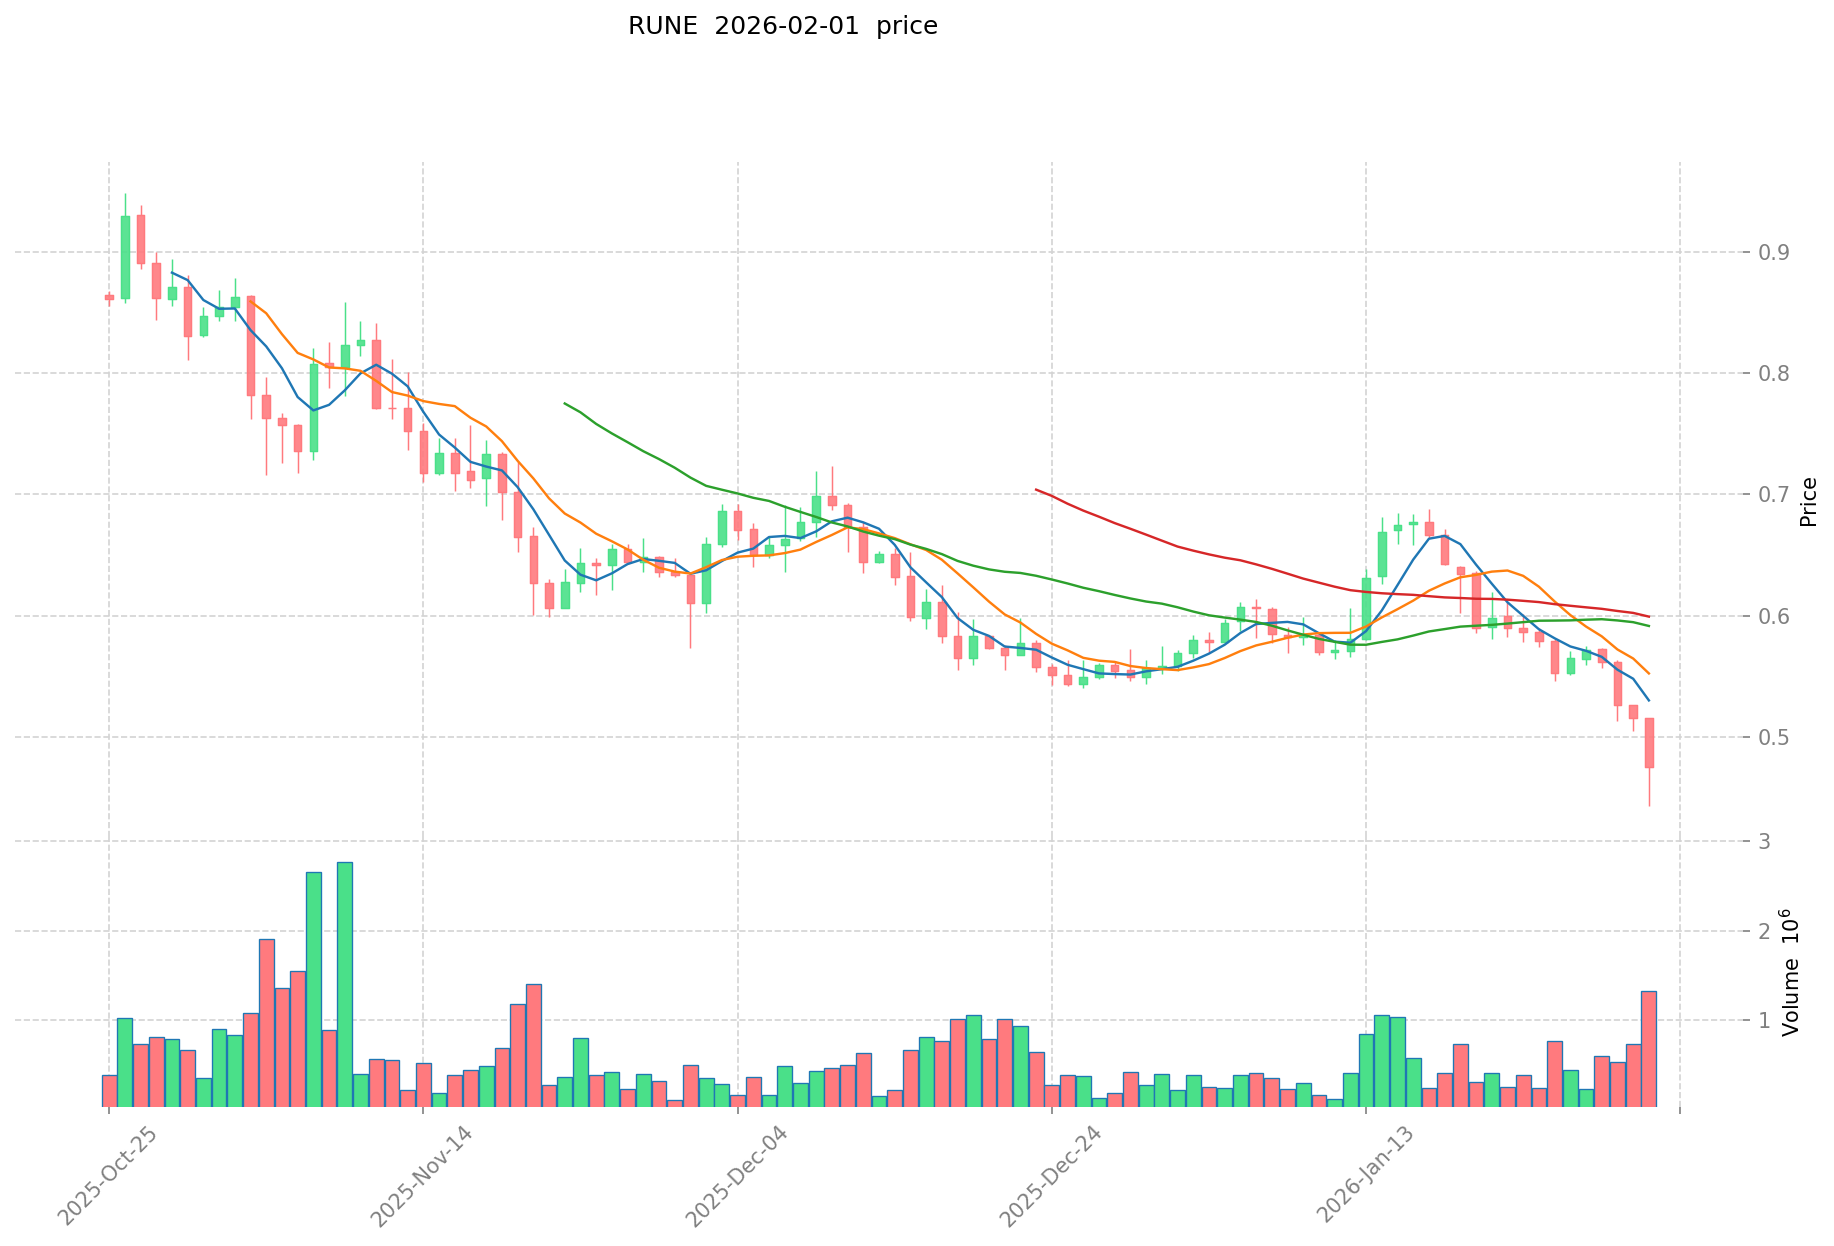
2021: RUNE achieved its historical high of $20.87 on May 19, 2021, driven by increased adoption of cross-chain liquidity protocols. The token has since undergone substantial price corrections.
-
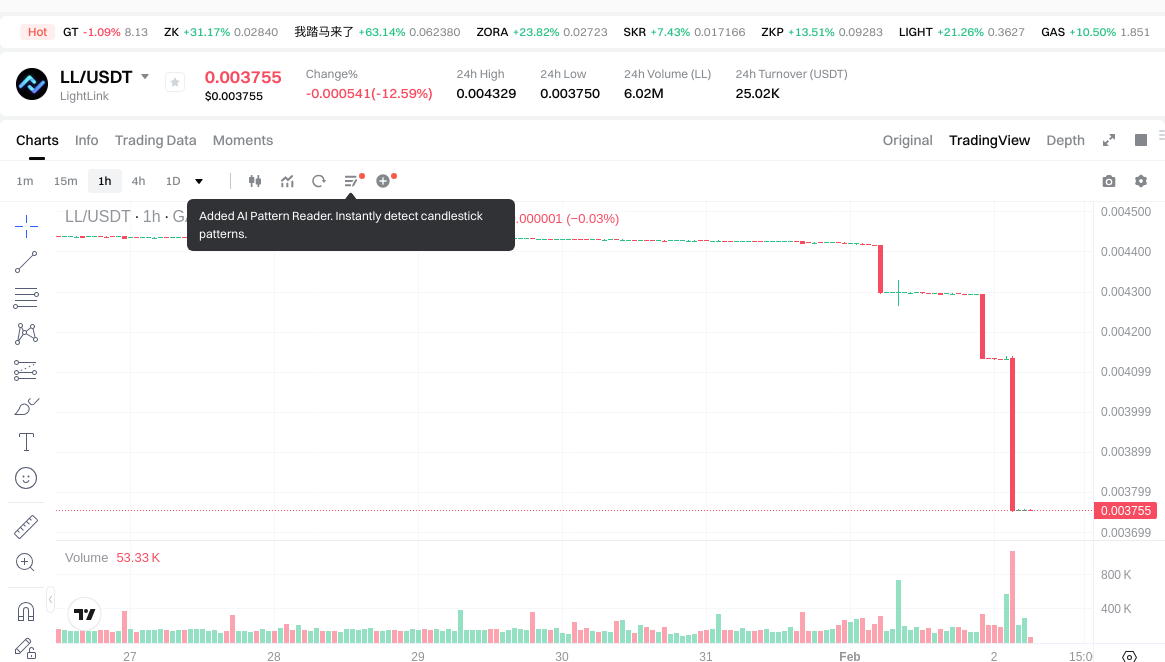
Comparative Analysis: During the recent market cycle, LL declined from its high of $0.3 to its current trading range near $0.00375, representing a substantial decrease. Meanwhile, RUNE experienced a decline from $20.87 to approximately $0.46, reflecting similar market-wide pressures on crypto assets.
Current Market Situation (February 2, 2026)
- LL Current Price: $0.003755
- RUNE Current Price: $0.4603
- 24-Hour Trading Volume: LL recorded $24,985.12 compared to RUNE's $378,319.72
- Market Sentiment Index (Fear & Greed Index): 14 (Extreme Fear)
View Real-Time Prices:
- Check LL Current Price Market Price
- Check RUNE Current Price Market Price
II. Core Factors Influencing LL vs RUNE Investment Value
Supply Mechanism Comparison (Tokenomics)
- LL: Supply mechanism information for LL is not available in the reference materials.
- RUNE: Supply mechanism details for RUNE are not provided in the reference materials.
- 📌 Historical Pattern: The relationship between supply mechanisms and price cycle variations requires specific tokenomics data for accurate analysis.
Institutional Adoption and Market Application
- Institutional Holdings: Available materials do not provide comparative data on institutional preference between LL and RUNE.
- Enterprise Adoption: The reference materials mention RUNE's integration with ThorChain, suggesting its application within decentralized cross-chain liquidity protocols. However, specific adoption metrics for cross-border payments, settlements, or investment portfolios are not available for either token.
- National Policy: Regulatory attitudes toward LL and RUNE in different jurisdictions are not covered in the provided materials.
Technology Development and Ecosystem Building
- LL Technology Upgrades: Technical development information for LL is not available in the reference materials.
- RUNE Technology Development: RUNE operates within the ThorChain ecosystem, which focuses on cross-chain liquidity and decentralized exchange functionality. The materials note security considerations related to user management practices when interacting with ThorChain protocols.
- Ecosystem Comparison: The reference materials mention RUNE's association with ThorChain's DeFi infrastructure. However, comprehensive comparison data regarding DeFi, NFT, payment systems, and smart contract implementation for both tokens is not provided.
Macroeconomic Environment and Market Cycles
- Performance Under Inflation: The materials do not contain specific analysis regarding the inflation-hedging properties of either LL or RUNE.
- Macroeconomic Monetary Policy: The reference materials discuss broader central bank policies and currency swap mechanisms in the context of global financial systems, but do not directly address how interest rates or dollar index movements specifically impact LL or RUNE.
- Geopolitical Factors: While the materials reference international financial cooperation and cross-border liquidity mechanisms in traditional finance, specific geopolitical impacts on LL and RUNE investment value are not detailed.
III. 2026-2031 Price Prediction: LL vs RUNE
Short-term Forecast (2026)
- LL: Conservative $0.00334284 - $0.003756 | Optimistic $0.003756 - $0.00522084
- RUNE: Conservative $0.447558 - $0.4614 | Optimistic $0.4614 - $0.498312
Mid-term Forecast (2028-2029)
- LL may enter a moderate growth phase, with projected price range of $0.00387799488 - $0.00662490792 in 2028, potentially reaching $0.0050446250064 - $0.0065460014964 by 2029
- RUNE may experience gradual appreciation, with projected price range of $0.3159131976 - $0.576666948 in 2028, potentially reaching $0.38273134614 - $0.66304162782 by 2029
- Key drivers: institutional capital flows, ETF developments, ecosystem expansion
Long-term Forecast (2031)
- LL: Baseline scenario $0.007120470180015 - $0.007656419548404 | Optimistic scenario $0.007656419548404 - $0.009187703458084
- RUNE: Baseline scenario $0.536857798288812 - $0.6972179198556 | Optimistic scenario $0.6972179198556 - $1.01096598379062
View detailed price predictions for LL and RUNE
Disclaimer: Price predictions are based on historical data analysis and market trend modeling. Cryptocurrency markets are highly volatile and subject to numerous unpredictable factors including regulatory changes, technological developments, macroeconomic conditions, and market sentiment shifts. These forecasts should not be construed as financial advice or investment recommendations. Past performance does not guarantee future results. Investors should conduct thorough due diligence and consider their risk tolerance before making any investment decisions.
LL:
| Year |
Predicted High Price |
Predicted Average Price |
Predicted Low Price |
Price Change |
| 2026 |
0.00522084 |
0.003756 |
0.00334284 |
0 |
| 2027 |
0.006283788 |
0.00448842 |
0.0037702728 |
19 |
| 2028 |
0.00662490792 |
0.005386104 |
0.00387799488 |
43 |
| 2029 |
0.0065460014964 |
0.00600550596 |
0.0050446250064 |
59 |
| 2030 |
0.009037085368608 |
0.0062757537282 |
0.004581300221586 |
67 |
| 2031 |
0.009187703458084 |
0.007656419548404 |
0.007120470180015 |
103 |
RUNE:
| Year |
Predicted High Price |
Predicted Average Price |
Predicted Low Price |
Price Change |
| 2026 |
0.498312 |
0.4614 |
0.447558 |
0 |
| 2027 |
0.52304304 |
0.479856 |
0.46546032 |
4 |
| 2028 |
0.576666948 |
0.50144952 |
0.3159131976 |
9 |
| 2029 |
0.66304162782 |
0.539058234 |
0.38273134614 |
17 |
| 2030 |
0.7933859088012 |
0.60104993091 |
0.3786614564733 |
30 |
| 2031 |
1.01096598379062 |
0.6972179198556 |
0.536857798288812 |
51 |
IV. Investment Strategy Comparison: LL vs RUNE
Long-term vs Short-term Investment Strategies
-
LL: May appeal to investors focused on Layer 2 scaling solutions and gasless transaction infrastructure, particularly those interested in emerging Ethereum ecosystem technologies with higher risk tolerance for early-stage projects.
-
RUNE: May suit investors seeking exposure to cross-chain liquidity protocols and decentralized exchange infrastructure, particularly those interested in established DeFi protocols with multi-chain interoperability.
Risk Management and Asset Allocation
-
Conservative Investors: LL 10-15% vs RUNE 85-90% allocation may reflect the maturity difference, with RUNE's longer operational history potentially offering relatively more established market positioning.
-
Aggressive Investors: LL 30-40% vs RUNE 60-70% allocation could appeal to those seeking higher exposure to newer Layer 2 technologies while maintaining significant position in cross-chain liquidity protocols.
-
Hedging Tools: Stablecoin allocation for portfolio stability, options strategies for downside protection, and cross-asset diversification across different blockchain infrastructure categories.
V. Potential Risk Comparison
Market Risks
-
LL: As a relatively newer token launched in 2024, LL faces liquidity constraints with 24-hour trading volume of $24,985.12, which may result in higher price volatility and potential execution challenges during market stress periods.
-
RUNE: With higher trading volume of $378,319.72, RUNE demonstrates relatively better liquidity conditions, though remains subject to broader DeFi sector sentiment shifts and cross-chain protocol adoption uncertainties.
Technical Risks
-
LL: Layer 2 scaling solutions face ongoing technical challenges related to network scalability, transaction finality guarantees, and integration complexity with various decentralized applications.
-
RUNE: Cross-chain protocols involve technical complexities including bridge security considerations, multi-chain coordination mechanisms, and potential vulnerabilities in cross-chain asset transfer processes.
Regulatory Risks
- Both tokens operate in evolving regulatory environments where policy changes regarding DeFi protocols, cross-chain transactions, and Layer 2 solutions could materially impact their operational frameworks and market acceptance across different jurisdictions.
VI. Conclusion: Which Is the Better Buy?
📌 Investment Value Summary:
-
LL Advantages: Positioned in the growing Ethereum Layer 2 sector with focus on gasless transaction technology, potentially benefiting from increased demand for scalable blockchain infrastructure solutions.
-
RUNE Advantages: Established presence in cross-chain liquidity provision with operational history since 2019, integrated within the ThorChain ecosystem offering multi-chain interoperability functionality.
✅ Investment Recommendations:
-
Novice Investors: Consider starting with smaller allocations to understand market dynamics, prioritize fundamental research over short-term price movements, and maintain diversification across multiple asset categories.
-
Experienced Investors: May evaluate technical differentiation between Layer 2 solutions and cross-chain protocols, assess ecosystem development trajectories, and implement structured position sizing based on individual risk parameters.
-
Institutional Investors: Consider conducting comprehensive due diligence on protocol security audits, team backgrounds, technological roadmaps, and regulatory compliance frameworks before making allocation decisions.
⚠️ Risk Warning: The cryptocurrency market exhibits extreme volatility. This article does not constitute investment advice. Market conditions, regulatory environments, and technological developments can change rapidly and unpredictably. Investors should conduct independent research, carefully assess their risk tolerance, and consider consulting qualified financial advisors before making any investment decisions. Past performance and price predictions do not guarantee future results.
VII. FAQ
Q1: What are the main differences between LL and RUNE in terms of their core technology and use cases?
LL is an Ethereum Layer 2 blockchain focused on providing instant, gasless transactions for decentralized applications and enterprise users, while RUNE operates as a multi-chain liquidity protocol enabling cross-chain swaps through the ThorChain network. The fundamental distinction lies in their architectural approach: LL addresses Ethereum's scalability challenges by offering a Layer 2 scaling solution with zero gas fees, whereas RUNE facilitates decentralized liquidity across multiple blockchain networks through cross-chain bridge technology. This makes LL more suitable for applications requiring high-frequency, cost-free transactions within the Ethereum ecosystem, while RUNE serves users seeking to exchange assets across different blockchain networks without relying on centralized exchanges.
Q2: Why is RUNE's trading volume significantly higher than LL's despite both experiencing substantial price declines?
RUNE's 24-hour trading volume of $378,319.72 compared to LL's $24,985.12 reflects the maturity and market recognition gap between the two projects. RUNE, launched in 2019, has established a longer operational history and deeper integration within the DeFi ecosystem through ThorChain, attracting more active traders and liquidity providers. The higher trading volume indicates greater market depth, which typically translates to better price discovery mechanisms and lower slippage during transactions. LL, as a 2024 launch, is still in its early market penetration phase with fewer exchange listings, lower brand recognition, and a smaller community of active traders, resulting in constrained liquidity that may pose execution challenges during periods of market volatility.
Q3: How do the price prediction models suggest different growth trajectories for LL versus RUNE through 2031?
The predictive models indicate divergent growth patterns: LL shows a projected price increase of approximately 103% from 2026 to 2031 (from $0.003756 to $0.007656), while RUNE demonstrates a 51% projected increase (from $0.4614 to $0.6972) over the same period. This differential reflects several factors including LL's lower starting price base offering greater percentage growth potential, the emerging nature of Layer 2 technologies creating speculative upside, and RUNE's more mature market position leading to potentially steadier but more moderate appreciation. However, these projections should be interpreted cautiously as they are based on historical data modeling and do not account for unpredictable market disruptions, regulatory changes, technological breakthroughs, or shifts in investor sentiment that could materially alter actual outcomes.
Q4: What are the primary risk factors investors should consider when comparing LL versus RUNE?
For LL, the primary risks include liquidity constraints due to low trading volume, technical challenges associated with Layer 2 scaling implementations, limited operational track record since its 2024 launch, and potential integration complexities with decentralized applications. For RUNE, key risk factors involve cross-chain bridge security vulnerabilities, dependencies on ThorChain's multi-chain coordination mechanisms, exposure to DeFi sector sentiment volatility, and potential asset transfer process complications across different blockchain networks. Both tokens face common regulatory uncertainties as authorities worldwide continue developing frameworks for DeFi protocols, cross-chain transactions, and Layer 2 solutions. Additionally, the extreme fear sentiment (Fear & Greed Index of 14) in the current market environment suggests heightened volatility risk that could impact both assets disproportionately during market stress periods.
Q5: What allocation strategies might different investor types consider when evaluating LL versus RUNE?
Conservative investors might consider a 10-15% allocation to LL and 85-90% to RUNE, reflecting RUNE's longer operational history and relatively more established market positioning as a safer option within this comparison. Aggressive investors seeking higher exposure to emerging technologies might allocate 30-40% to LL and 60-70% to RUNE, balancing potential upside from Layer 2 adoption with the stability of cross-chain liquidity protocols. These allocations should be viewed within the context of a broader portfolio strategy that includes hedging mechanisms such as stablecoin reserves for portfolio stability, options strategies for downside protection, and diversification across different blockchain infrastructure categories. Institutional investors should conduct comprehensive due diligence on protocol security audits, team credentials, technological roadmaps, and regulatory compliance frameworks before determining appropriate position sizes aligned with their specific investment mandates and risk parameters.
Q6: How does the current extreme fear market sentiment (Index: 14) affect the LL vs RUNE investment decision?
The extreme fear sentiment indicates widespread market pessimism that historically correlates with both heightened risk and potential opportunity depending on investor time horizons and risk tolerance. In such environments, both LL and RUNE face elevated selling pressure that may not reflect their fundamental value propositions, potentially creating entry points for long-term investors who believe in the underlying technology and ecosystem development. However, extreme fear conditions also signal increased probability of further price declines, higher volatility, and potential liquidity challenges, particularly for lower-volume assets like LL. Investors should recognize that fear-driven markets can persist longer than anticipated and that attempting to time market bottoms carries substantial risk. A disciplined approach involving dollar-cost averaging, strict position sizing, and maintaining adequate capital reserves for potential additional downside may be more prudent than concentrated positions during extreme sentiment conditions.
* The information is not intended to be and does not constitute financial advice or any other recommendation of any sort offered or endorsed by Gate.