MDAO vs ARB: The Battle for DeFi Supremacy in the Ethereum Ecosystem

Introduction: MDAO vs ARB Investment Comparison
In the cryptocurrency market, MarsDAO vs Arbitrum has always been a topic that investors cannot avoid. The two not only have significant differences in market cap ranking, application scenarios, and price performance, but also represent different positioning in crypto assets.
MarsDAO (MDAO): Since its launch in 2022, it has gained market recognition for its focus on bringing transparent profits to token holders in the cryptocurrency market.
Arbitrum (ARB): Since its introduction in 2023, it has been hailed as an Ethereum scaling solution, enabling high-throughput, low-cost smart contracts while maintaining trustless security.
This article will comprehensively analyze the investment value comparison between MDAO and ARB, focusing on historical price trends, supply mechanisms, institutional adoption, technical ecosystems, and future predictions, and attempt to answer the question investors care most about:
"Which is the better buy right now?"
I. Price History Comparison and Current Market Status
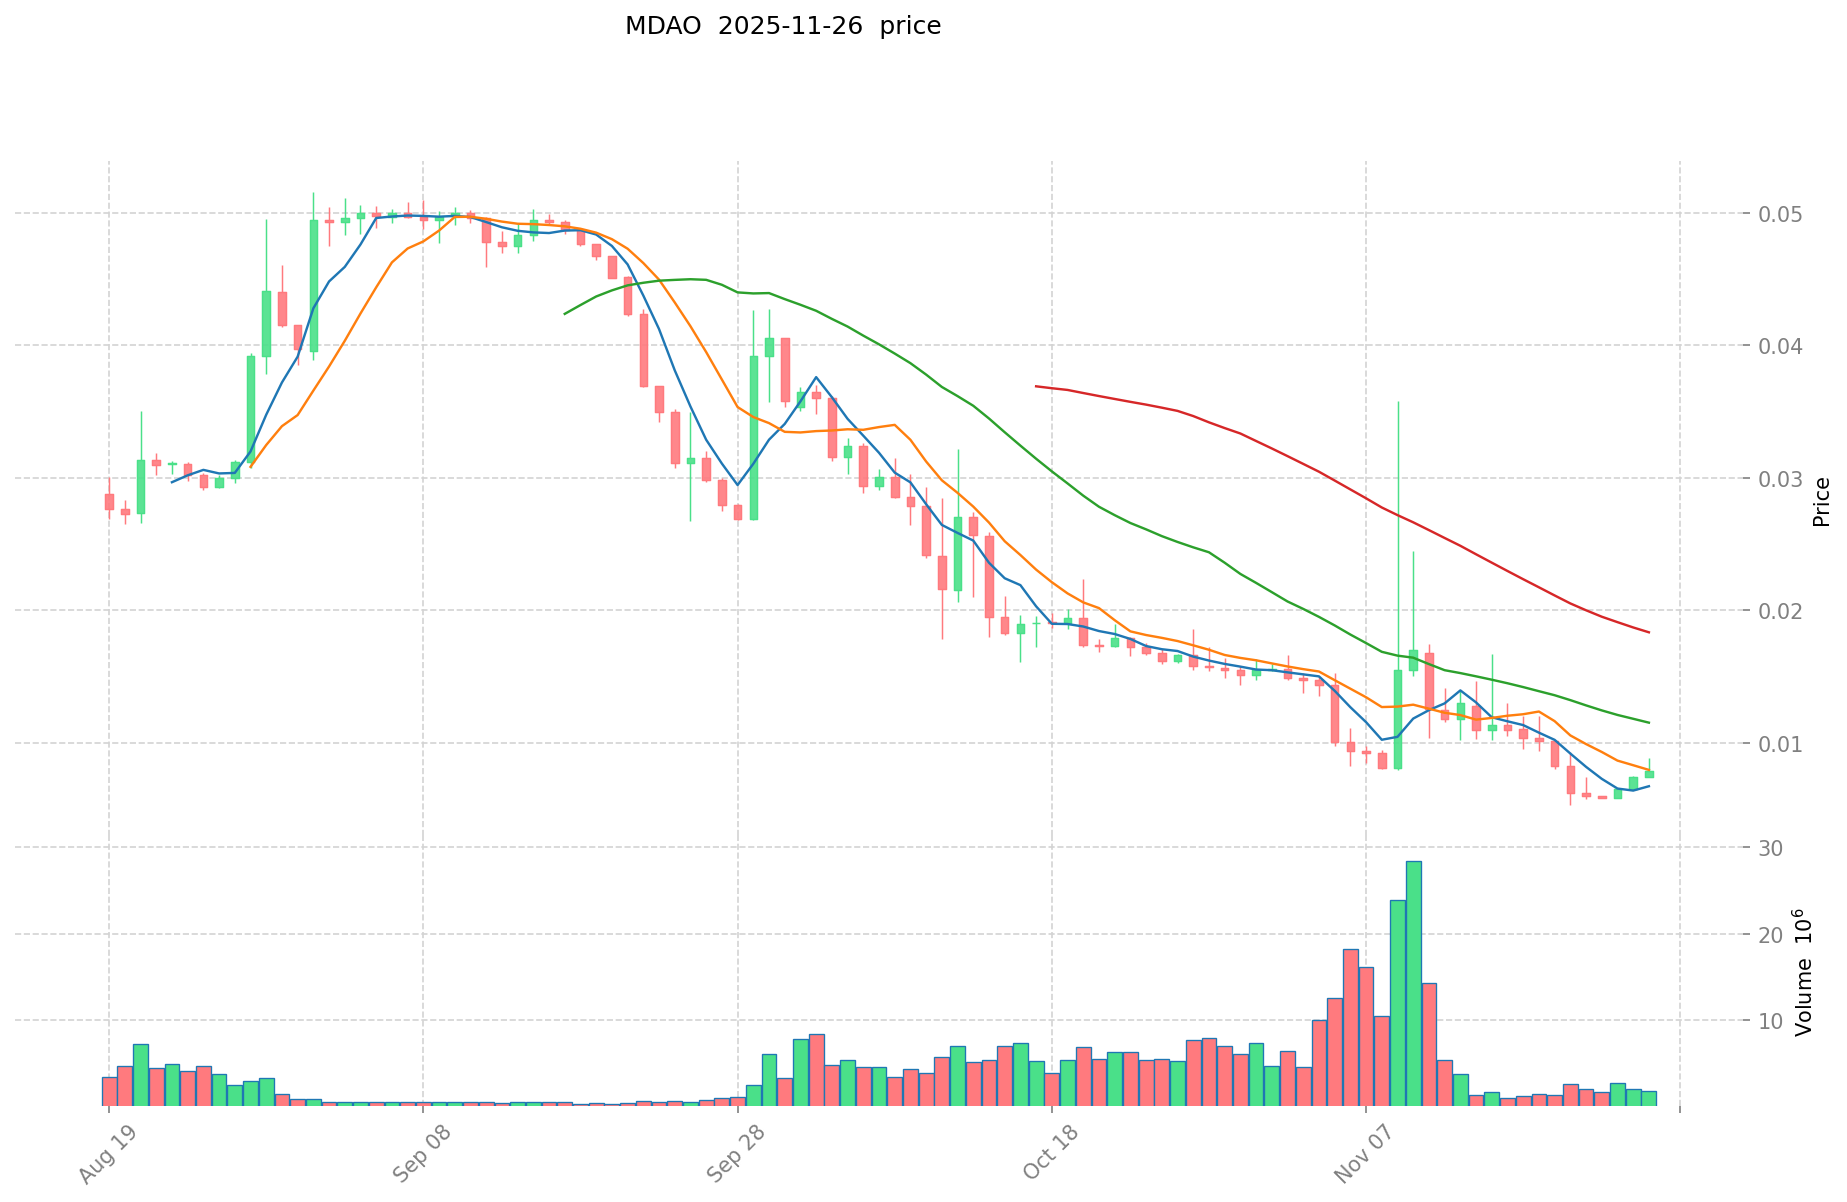
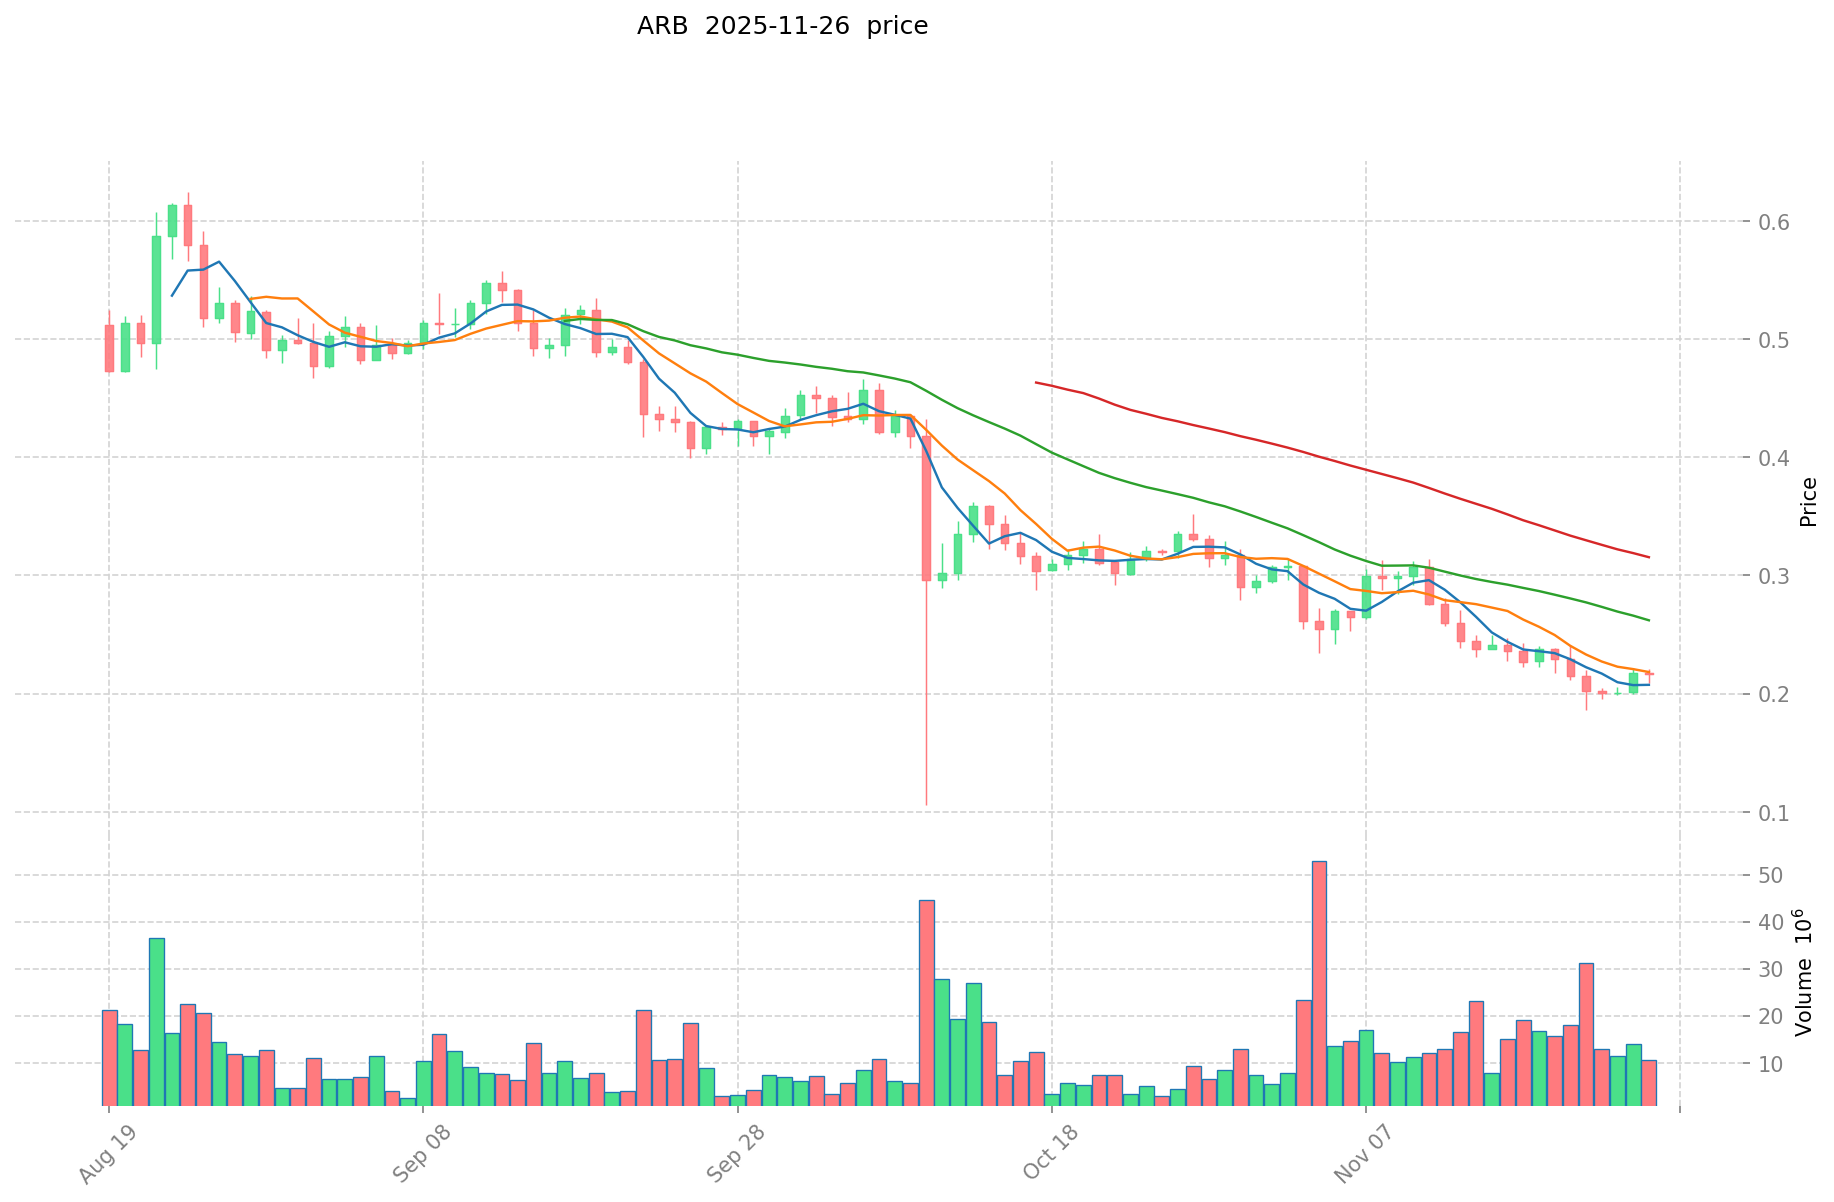
MDAO (Coin A) and ARB (Coin B) Historical Price Trends
- 2023: ARB launched and reached its all-time high of $4.00 on March 23, 2023.
- 2025: MDAO hit its all-time low of $0.00545195 on November 20, 2025.
- Comparative analysis: In the current market cycle, MDAO has fallen from its all-time high of $0.636821 to its current price of $0.00818, while ARB has declined from its peak of $4.00 to $0.2112.
Current Market Situation (2025-11-26)
- MDAO current price: $0.00818
- ARB current price: $0.2112
- 24-hour trading volume: MDAO $17,874.41 vs ARB $2,050,455.99
- Market Sentiment Index (Fear & Greed Index): 20 (Extreme Fear)
Click to view real-time prices:
- View MDAO current price Market Price
- View ARB current price Market Price
II. Core Factors Affecting MDAO vs ARB Investment Value
Supply Mechanism Comparison (Tokenomics)
- MDAO: Fixed supply of 100 million tokens with 34% allocated to community participants, 20% to seed investors, and 46% to the DAO community treasury and core team members.
- ARB: Total supply of 10 billion tokens with 42.1% allocated to the Arbitrum DAO treasury, 26.9% to the Offchain Labs team and future team members, 17.5% to investors, and 11.5% to users of the Arbitrum platform.
- 📌 Historical Pattern: Fixed supply tokens like MDAO tend to have higher price volatility when demand changes, while ARB's larger supply and gradual distribution may provide more stability but potentially slower appreciation.
Institutional Adoption and Market Applications
- Institutional Holdings: ARB has gained more institutional interest due to Arbitrum's established position as the leading Ethereum Layer 2 scaling solution with over $2.17 billion in Total Value Locked (TVL).
- Enterprise Adoption: ARB has wider adoption in DeFi applications with hundreds of protocols built on Arbitrum One, while MDAO has focused on expanding to mainstream business use cases with partnerships in industries like supply chain management.
- Regulatory Attitudes: Both tokens face similar regulatory uncertainties as governance tokens, but ARB benefits from greater regulatory clarity due to its established position in the market.
Technical Development and Ecosystem Building
- MDAO Technical Upgrades: Implementation of a cross-chain infrastructure to allow seamless integration with multiple blockchain networks, improving interoperability.
- ARB Technical Development: Continuing to enhance the Arbitrum Nitro stack with improvements to its fraud proofs and data compression technologies, maintaining its position as a leading L2 solution.
- Ecosystem Comparison: ARB has a more developed ecosystem with hundreds of dApps across DeFi, gaming, and NFTs, while MDAO has focused on targeted business applications and is still building out its DeFi ecosystem.
Macroeconomic Factors and Market Cycles
- Inflation Environment Performance: ARB may offer better inflation protection due to its broader utility and established ecosystem, while MDAO's limited supply could theoretically provide scarcity value.
- Macroeconomic Monetary Policy: Rising interest rates have generally placed downward pressure on both tokens, with ARB showing more resilience due to its utility value.
- Geopolitical Factors: Increasing global digital asset adoption benefits both tokens, with ARB currently enjoying wider global recognition and usage. III. 2025-2030 Price Prediction: MDAO vs ARB
Short-term Prediction (2025)
- MDAO: Conservative $0.0067479 - $0.00813 | Optimistic $0.00813 - $0.011382
- ARB: Conservative $0.159904 - $0.2104 | Optimistic $0.2104 - $0.296664
Mid-term Prediction (2027)
- MDAO may enter a growth phase, with prices expected in the range of $0.0082613808 - $0.0141462
- ARB may enter a bullish market, with prices expected in the range of $0.2380411948 - $0.391897089
- Key drivers: Institutional fund inflows, ETF developments, ecosystem growth
Long-term Prediction (2030)
- MDAO: Base scenario $0.0163807691175 - $0.0235883075292 | Optimistic scenario $0.0235883075292+
- ARB: Base scenario $0.49305371075975 - $0.65083089820287 | Optimistic scenario $0.65083089820287+
Disclaimer: The above predictions are based on historical data and market trends. Cryptocurrency markets are highly volatile and subject to various unpredictable factors. This information should not be considered as financial advice. Always conduct your own research before making investment decisions.
MDAO:
| 年份 | 预测最高价 | 预测平均价格 | 预测最低价 | 涨跌幅 |
|---|---|---|---|---|
| 2025 | 0.011382 | 0.00813 | 0.0067479 | 0 |
| 2026 | 0.01287792 | 0.009756 | 0.00868284 | 19 |
| 2027 | 0.0141462 | 0.01131696 | 0.0082613808 | 38 |
| 2028 | 0.0151505802 | 0.01273158 | 0.0123496326 | 55 |
| 2029 | 0.018820458135 | 0.0139410801 | 0.008643469662 | 70 |
| 2030 | 0.0235883075292 | 0.0163807691175 | 0.00950084608815 | 100 |
ARB:
| 年份 | 预测最高价 | 预测平均价格 | 预测最低价 | 涨跌幅 |
|---|---|---|---|---|
| 2025 | 0.296664 | 0.2104 | 0.159904 | 0 |
| 2026 | 0.32705628 | 0.253532 | 0.15465452 | 20 |
| 2027 | 0.391897089 | 0.29029414 | 0.2380411948 | 37 |
| 2028 | 0.494588641025 | 0.3410956145 | 0.180780675685 | 61 |
| 2029 | 0.568265293757 | 0.4178421277625 | 0.346808966042875 | 97 |
| 2030 | 0.65083089820287 | 0.49305371075975 | 0.27611007802546 | 133 |
IV. Investment Strategy Comparison: MDAO vs ARB
Long-term vs Short-term Investment Strategies
- MDAO: Suitable for investors focused on niche business applications and potential for high volatility
- ARB: Suitable for investors looking for established ecosystem and Layer 2 scaling potential
Risk Management and Asset Allocation
- Conservative investors: MDAO: 10% vs ARB: 90%
- Aggressive investors: MDAO: 30% vs ARB: 70%
- Hedging tools: Stablecoin allocation, options, cross-currency combinations
V. Potential Risk Comparison
Market Risks
- MDAO: Higher volatility due to lower market cap and trading volume
- ARB: Susceptible to overall Ethereum ecosystem performance
Technical Risks
- MDAO: Scalability, network stability
- ARB: Centralization of validators, potential security vulnerabilities in Layer 2 technology
Regulatory Risks
- Global regulatory policies may impact both tokens differently, with ARB potentially facing more scrutiny due to its wider adoption
VI. Conclusion: Which Is the Better Buy?
📌 Investment Value Summary:
- MDAO advantages: Fixed supply, potential for high returns in bullish markets
- ARB advantages: Established ecosystem, strong institutional adoption, Layer 2 scaling solution
✅ Investment Advice:
- New investors: Consider a small allocation to ARB as part of a diversified portfolio
- Experienced investors: Balanced approach with higher weight on ARB, small speculative position in MDAO
- Institutional investors: Focus on ARB for its established ecosystem and institutional adoption
⚠️ Risk Warning: Cryptocurrency markets are highly volatile. This article does not constitute investment advice. None
VII. FAQ
Q1: What are the main differences between MDAO and ARB? A: MDAO is a fixed supply token focused on business applications, while ARB is a larger supply token serving as Ethereum's Layer 2 scaling solution with a more developed ecosystem.
Q2: Which token has shown better price performance historically? A: ARB has shown more resilience in price performance, declining from $4.00 to $0.2112, while MDAO has fallen from $0.636821 to $0.00818.
Q3: How do the supply mechanisms of MDAO and ARB differ? A: MDAO has a fixed supply of 100 million tokens, while ARB has a larger total supply of 10 billion tokens with a more gradual distribution plan.
Q4: Which token has greater institutional adoption? A: ARB has gained more institutional interest due to Arbitrum's established position as the leading Ethereum Layer 2 scaling solution with over $2.17 billion in Total Value Locked (TVL).
Q5: What are the key technical developments for each token? A: MDAO is implementing cross-chain infrastructure for improved interoperability, while ARB is enhancing the Arbitrum Nitro stack with improvements to fraud proofs and data compression technologies.
Q6: How do the long-term price predictions compare for MDAO and ARB? A: By 2030, MDAO's base scenario predicts a range of $0.0163807691175 - $0.0235883075292, while ARB's base scenario predicts $0.49305371075975 - $0.65083089820287.
Q7: What investment strategies are recommended for MDAO and ARB? A: Conservative investors might allocate 10% to MDAO and 90% to ARB, while aggressive investors might consider 30% MDAO and 70% ARB. ARB is generally recommended for new and institutional investors due to its established ecosystem and adoption.
Share
Content
How to Buy Cryptocurrency


Trending Cryptocurrencies


What is BOBA: A Complete Guide to Understanding the Popular Bubble Tea Phenomenon
Is Boba Network (BOBA) a good investment?: A Comprehensive Analysis of Technology, Market Potential, and Risk Factors for 2024

What is ARB: Understanding the Arbitrum Governance Token and Its Role in Ethereum Scaling Solutions
2025 LRC Price Prediction: Analyzing Market Trends, Tokenomics and Growth Potential in the Layer 2 Ecosystem
What is KNC: A Comprehensive Guide to Kyber Network Crystal Token

What is AURORA: Understanding the Natural Light Phenomenon of the Northern Skies

What is Tether Gold (XAUT) market overview with $1.63B market cap and $38.13M 24-hour trading volume?

How Will HYPE's Technical Indicators Like MACD, RSI, and Bollinger Bands Predict Its Next Price Move?
How Does ARTX Price Volatility Compare to Bitcoin and Ethereum in 2025?

What is token economics model: PEPE's deflationary design with 93.1% liquidity allocation explained
How do MACD, RSI, and KDJ indicators signal NEAR price movements in 2025?