MDT vs SAND: A Comprehensive Comparison of Two Leading Sandbox and Metaverse Platforms


Introduction: MDT vs SAND Investment Comparison
In the cryptocurrency market, the comparison between MeasurableDataToken (MDT) and Sandbox (SAND) remains a relevant topic for investors. The two assets differ significantly in market capitalization ranking, application scenarios, and price performance, representing distinct positioning within the crypto asset landscape.
MeasurableDataToken (MDT): Launched in January 2018, MDT operates as a decentralized big data value economic ecosystem that quantifies data value and facilitates transactions between users, data purchasers, and data suppliers through blockchain technology.
Sandbox (SAND): Introduced in August 2020, SAND functions as a utility token powering a virtual game world where players can create, own, and monetize digital assets and gaming experiences through a decentralized platform.
This article will provide a comprehensive analysis of MDT vs SAND by examining historical price trends, tokenomics and supply mechanisms, market positioning, ecosystem development, and performance metrics to help address the key question investors face:
"Which is the better investment opportunity at this time?"
Comparative Analysis Report: Measurable Data Token (MDT) vs The Sandbox (SAND)
I. Historical Price Comparison and Current Market Status
MDT and SAND Price Trends
Historical Performance:
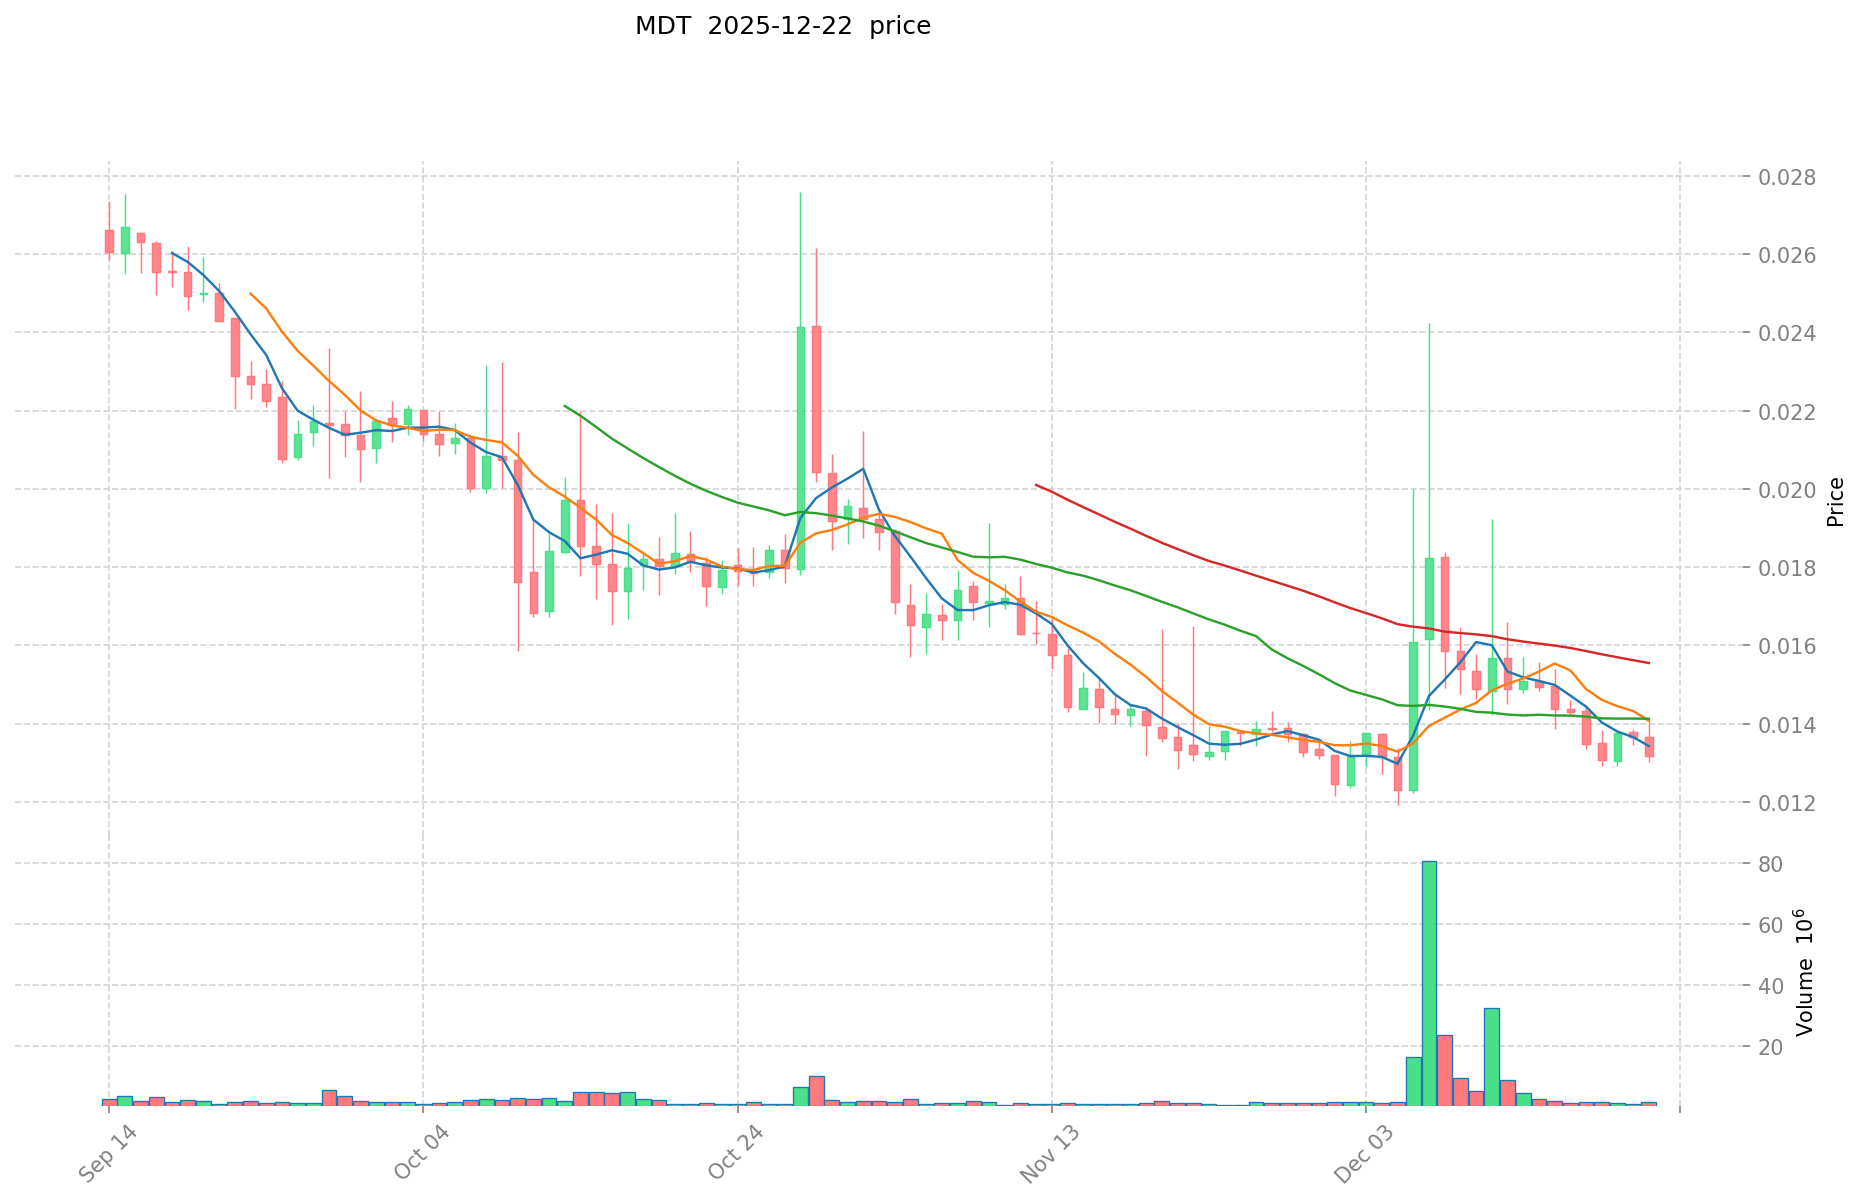
- MDT reached its all-time high of $0.168053 on December 26, 2021, and fell to its all-time low of $0.00173261 on December 18, 2018.
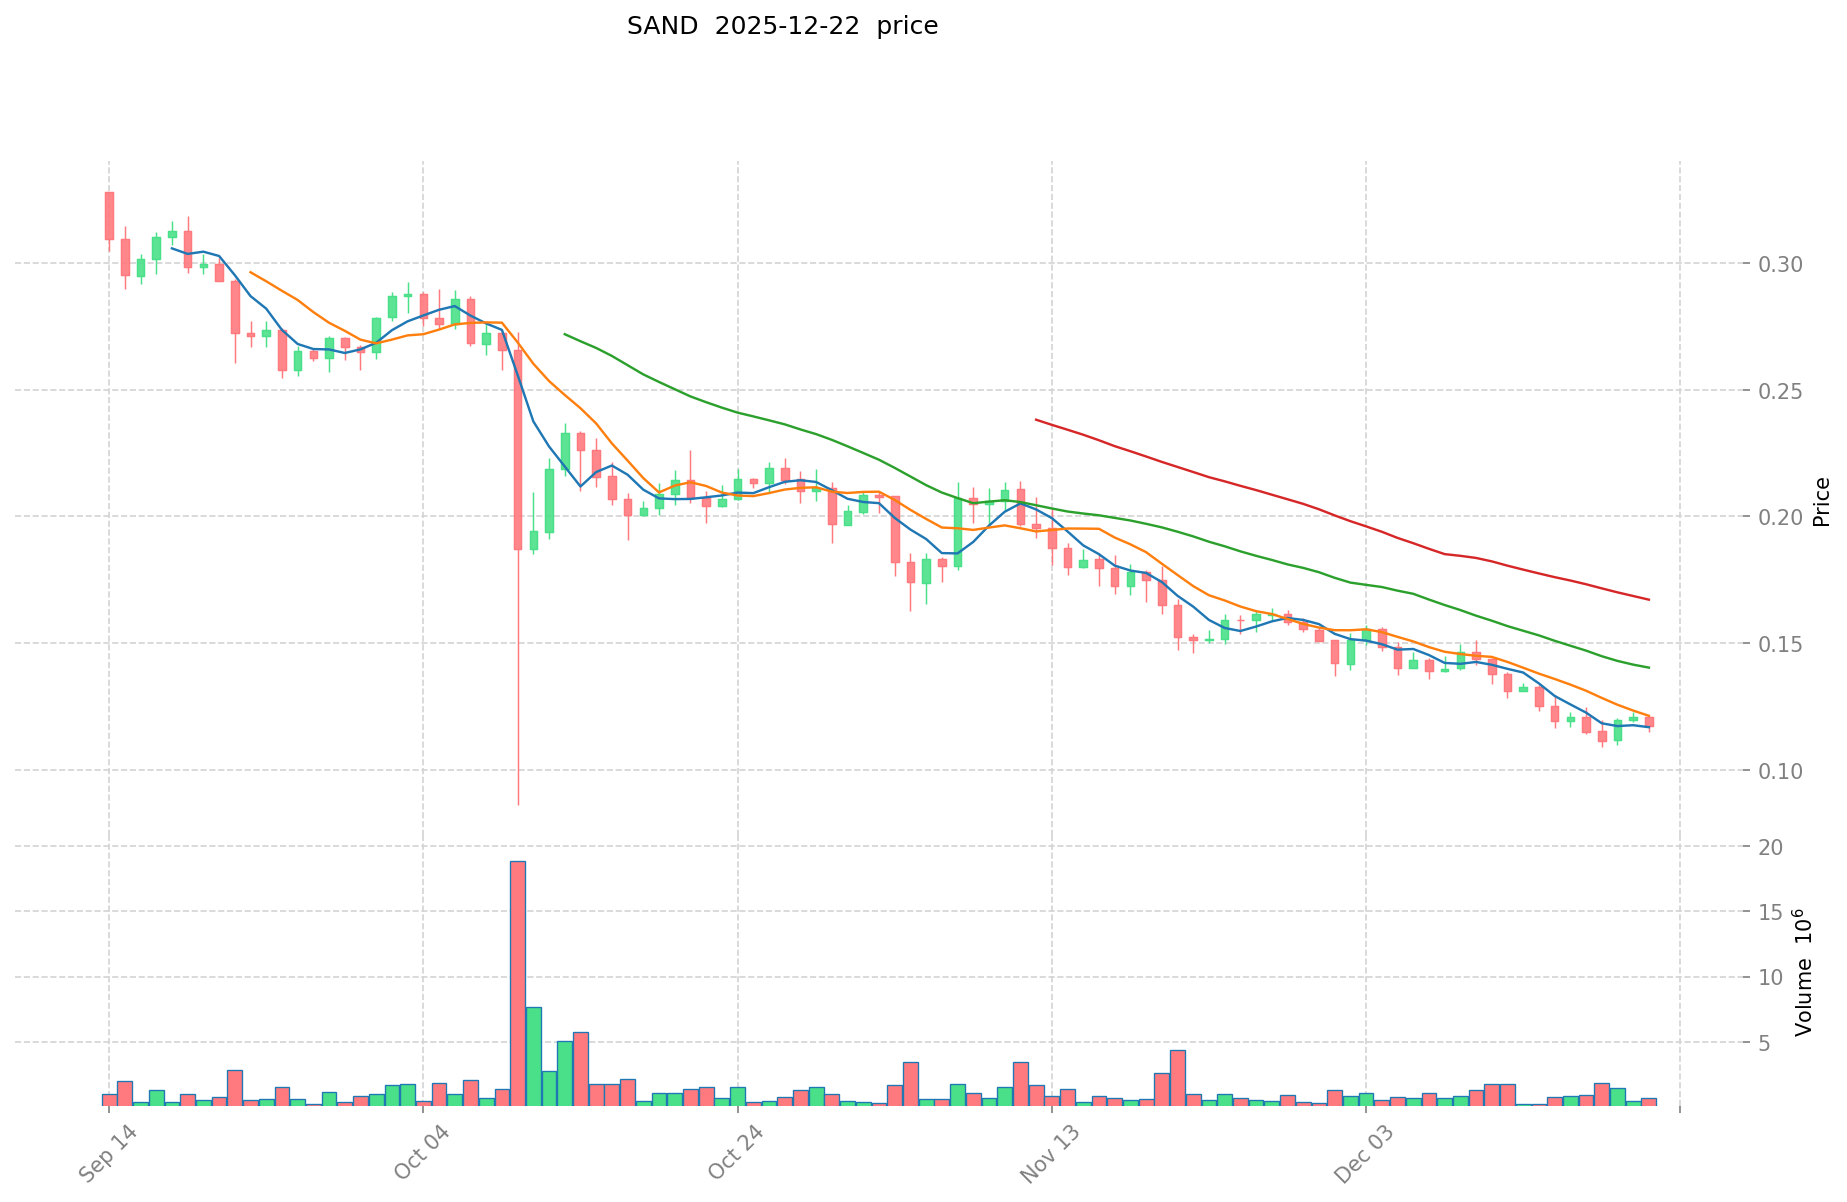
- SAND reached its all-time high of $8.4 on November 25, 2021, and fell to its all-time low of $0.02897764 on November 4, 2020.
Comparative Analysis: Both tokens experienced significant declines from their 2021 peaks. MDT has depreciated by approximately 91.95% from its historical high, while SAND has depreciated by approximately 86.0% from its peak. Both assets demonstrate the volatile nature of the cryptocurrency market during the post-2021 correction period.
Current Market Status (December 22, 2025)
Price Information:
- MDT current price: $0.013519
- SAND current price: $0.1171
- MDT 24-hour trading volume: $17,343.67
- SAND 24-hour trading volume: $99,628.68
Short-term Price Movements:
- MDT 24-hour change: -1.76%
- SAND 24-hour change: -3.22%
- MDT 7-day change: -10.54%
- SAND 7-day change: -8.52%
- MDT 1-year change: -76%
- SAND 1-year change: -79.31%
Market Sentiment Index: The Crypto Fear & Greed Index stands at 25, indicating "Extreme Fear" in the broader cryptocurrency market as of December 22, 2025.
Check Real-Time Prices:
II. Project Overview and Ecosystem
Measurable Data Token (MDT)
Project Description: MDT is a decentralized big data value economic ecosystem built on blockchain technology. It functions as a communication unit among users, data purchasers, and data suppliers. The platform quantifies data value through the MDT token and incentivizes users to share anonymous data while providing data buyers with more efficient consumption solutions.
Key Features:
- Fair and transparent data trading environment
- User incentive mechanism for anonymous data contribution
- Decentralized architecture
- Token utility: Exchange unit for data transactions
Market Position:
- Market cap ranking: #1281
- Fully diluted market cap: $13,519,000
- Total supply: 1,000,000,000 MDT
- Circulating supply: 606,319,736.12 MDT (60.63% of total)
- Market dominance: 0.00041%
- Number of holders: 30,316
The Sandbox (SAND)
Project Description: The Sandbox is a decentralized virtual world and gaming platform built on blockchain technology. Players can purchase, build, govern, earn, and own digital items using SAND tokens. The platform enables creation of digital assets (NFTs) and supports play-to-earn mechanics.
Key Features:
- Decentralized metaverse environment
- NFT creation and trading capabilities
- Play-to-earn gaming model
- Community governance through SAND holdings
- Game Maker tool for creating virtual experiences
Market Position:
- Market cap ranking: #177
- Fully diluted market cap: $351,300,000
- Total supply: 3,000,000,000 SAND
- Circulating supply: 2,613,289,192.22 SAND (87.11% of total)
- Market dominance: 0.010%
- Number of holders: 207,106
III. Tokenomics and Supply Dynamics
MDT Token Structure:
- Total supply: 1,000,000,000
- Circulating supply: 606,319,736.12 (60.63%)
- Circulating ratio: 60.63%
- Maximum supply: Unlimited (∞)
SAND Token Structure:
- Total supply: 3,000,000,000
- Circulating supply: 2,613,289,192.22 (87.11%)
- Circulating ratio: 87.11%
- Maximum supply: 3,000,000,000
Supply Analysis: MDT maintains a lower circulation ratio (60.63%), suggesting potential room for token release, though it carries an unlimited maximum supply. SAND has a high circulation ratio (87.11%) with a fixed maximum supply, indicating most tokens are already in circulation.
IV. Market Liquidity and Trading Activity
MDT Trading Metrics:
- 24-hour trading volume: $17,343.67
- Number of trading pairs: 18 exchanges
- Market cap to volume ratio: High concentration
- Liquidity assessment: Limited trading activity
SAND Trading Metrics:
- 24-hour trading volume: $99,628.68
- Number of trading pairs: 61 exchanges
- Market cap to volume ratio: Moderate concentration
- Liquidity assessment: Significantly higher than MDT
Comparative Liquidity Analysis: SAND demonstrates substantially higher trading volume and broader exchange coverage, indicating greater market liquidity. MDT shows more limited liquidity with fewer trading pairs available across exchanges.
V. Blockchain Infrastructure
MDT Network:
- Blockchain: Ethereum (ETH)
- Token standard: ERC-20
- Contract address: 0x814e0908b12A99FeCf5BC101bB5d0b8B5cDf7d26
SAND Network:
- Primary blockchain: Ethereum (ETH)
- Secondary blockchain: Base EVM
- Token standard: ERC-20
- Ethereum contract: 0x3845badAde8e6dFF049820680d1F14bD3903a5d0
- Base contract: 0xac531eb26ca1d21b85126de8fb87e80e09002dcf
VI. Market Performance Summary
Price Action Overview:
| Metric | MDT | SAND |
|---|---|---|
| Current Price | $0.013519 | $0.1171 |
| 24h Change | -1.76% | -3.22% |
| 7d Change | -10.54% | -8.52% |
| 30d Change | +2.53% | -20.79% |
| 1y Change | -76% | -79.31% |
| ATH | $0.168053 | $8.4 |
| ATL | $0.00173261 | $0.02897764 |
| From ATH decline | -91.95% | -86.0% |
Key Observations: Both tokens have experienced severe depreciation from their 2021 peaks. SAND shows marginally better 30-day performance (+2.53% for MDT vs -20.79% for SAND), but displays more negative short-term momentum. The extreme fear sentiment in the broader market suggests ongoing price pressure for both assets.
VII. Disclaimer
This report provides factual market data and analytical information current as of December 22, 2025. It is intended for informational purposes only and does not constitute investment advice, recommendations, or solicitation to buy or sell any cryptocurrency. Cryptocurrency markets are highly volatile and unpredictable. Past performance does not guarantee future results. Investors should conduct their own research and consult with qualified financial advisors before making any investment decisions. All data presented is based on available market information and may be subject to change.
Report on Core Investment Value Factors: MDT vs SAND
I. Executive Summary
Based on available reference materials, this report examines the investment value factors for MDT (Measurable Data Token) and SAND tokens. The analysis reveals that MDT's primary utility centers on its role within a decentralized data exchange ecosystem, while information regarding SAND's specific characteristics is limited in the provided materials.
II. Core Factors Influencing MDT Investment Value
Utility and Ecosystem Architecture
MDT Token Fundamentals:
- MDT functions as a core utility token within the Measurable Data ecosystem
- Built on the Ethereum blockchain using the ERC-20 standard
- Operates as the economic mechanism foundation for a decentralized data exchange protocol
- Enables secure and anonymous transactions between data providers and data buyers
Strategic Partnerships and Funding
Capital Support and Development:
- Strategic investments from external entities provide additional funding for product line development
- Partnership support strengthens the foundation for ecosystem expansion and innovation
Market Positioning
Current Market Status:
- Circulating market cap: approximately 45.5 million USD
- Positioned within the emerging AI data economy sector
- Addresses the market need for blockchain-based data exchange mechanisms
III. Data Limitations and Scope Constraints
The reference materials provided contain insufficient verified information regarding:
- Specific tokenomics details (supply mechanisms, inflation/deflation models, vesting schedules)
- Comparative analysis with SAND token characteristics and utility
- Institutional adoption rates and holdings data
- Regulatory treatment across different jurisdictions
- Technical development roadmap and upcoming upgrades
- Macroeconomic sensitivity metrics
IV. Conclusion
MDT's investment value hinges primarily on:
- Ecosystem Adoption: Expansion of the data exchange protocol user base
- Utility Realization: Increased transaction volume and active participation from data providers and purchasers
- Strategic Partnerships: Continued support and collaborations enhancing product development
- Technological Advancement: Evolution of the underlying blockchain infrastructure
A comprehensive investment analysis would require additional data regarding market fundamentals, technical specifications, competitive positioning, and regulatory developments not fully covered in the available reference materials.
III. 2025-2030 Year Price Predictions: MDT vs SAND
Short-term Prediction (2025)
- MDT: Conservative $0.0126-$0.0136 | Optimistic $0.0194
- SAND: Conservative $0.0657-$0.1173 | Optimistic $0.1419
Mid-term Prediction (2027-2028)
- MDT could enter consolidation phase with potential growth drivers, expected price range $0.0167-$0.0284
- SAND could enter recovery and accumulation phase, expected price range $0.1041-$0.2479
- Key Drivers: Institutional capital inflows, ETF approvals, ecosystem development
Long-term Prediction (2029-2030)
- MDT: Base case $0.0129-$0.0257 | Optimistic scenario $0.0326
- SAND: Base case $0.1559-$0.2828 | Optimistic scenario $0.2698
- Projected growth trajectory shows potential +83-86% upside for MDT and +81-111% upside for SAND by 2030
Disclaimer: Price predictions are based on historical data analysis and market models. Actual prices may deviate significantly from forecasts due to market volatility, regulatory changes, technological developments, and macroeconomic factors. This analysis does not constitute investment advice. Investors should conduct independent research and consult with financial professionals before making investment decisions.
MDT:
| 年份 | 预测最高价 | 预测平均价格 | 预测最低价 | 涨跌幅 |
|---|---|---|---|---|
| 2025 | 0.01941654 | 0.013578 | 0.01262754 | 0 |
| 2026 | 0.0201266694 | 0.01649727 | 0.009898362 | 22 |
| 2027 | 0.02380556061 | 0.0183119697 | 0.016663892427 | 35 |
| 2028 | 0.02842933295925 | 0.021058765155 | 0.02000582689725 | 55 |
| 2029 | 0.02573381101941 | 0.024744049057125 | 0.012866905509705 | 83 |
| 2030 | 0.032558219749365 | 0.025238930038267 | 0.014890968722577 | 86 |
SAND:
| 年份 | 预测最高价 | 预测平均价格 | 预测最低价 | 涨跌幅 |
|---|---|---|---|---|
| 2025 | 0.141933 | 0.1173 | 0.065688 | 0 |
| 2026 | 0.159428295 | 0.1296165 | 0.09073155 | 10 |
| 2027 | 0.209557476375 | 0.1445223975 | 0.1040561262 | 23 |
| 2028 | 0.2478559117125 | 0.1770399369375 | 0.16995833946 | 51 |
| 2029 | 0.28255573935225 | 0.212447924325 | 0.19757656962225 | 81 |
| 2030 | 0.269776996704101 | 0.247501831838625 | 0.155926154058333 | 111 |
Comparative Investment Analysis Report: MDT vs SAND
I. Investment Strategy Comparison: MDT vs SAND
Long-term vs Short-term Investment Strategies
MDT: Suited for investors focusing on emerging data economy sectors and blockchain-based decentralized data exchange infrastructure. MDT's utility centers on facilitating anonymous data transactions, making it relevant for those bullish on enterprise data monetization trends.
SAND: Suited for investors seeking exposure to virtual world and gaming metaverse ecosystems. SAND's positioning in play-to-earn gaming and NFT creation appeals to those targeting the broader gaming industry convergence with blockchain technology.
Risk Management and Asset Allocation
Conservative Investors:
- MDT: 15% allocation
- SAND: 25% allocation
- Remaining allocation: 60% in stablecoins and established cryptocurrencies
Aggressive Investors:
- MDT: 25% allocation
- SAND: 35% allocation
- Remaining allocation: 40% in alternative altcoins and diversified positions
Hedging Instruments: Stablecoin reserves (USDC/USDT), derivatives on major exchanges, cross-asset diversification incorporating Ethereum and other Layer-1 blockchains
II. Comparative Risk Analysis
Market Risk
MDT:
- Extremely low trading volume ($17,343.67 in 24-hour volume) creates significant liquidity risk
- Limited exchange availability (18 trading pairs) restricts exit opportunities
- 76% year-over-year decline indicates persistent negative market sentiment
- Micro-cap positioning (#1281 market cap ranking) amplifies price volatility
SAND:
- Substantial depreciation from historical highs (86% decline from ATH)
- 79.31% one-year decline reflects severe market correction
- Higher trading volume ($99,628.68) provides better liquidity than MDT but remains moderate
- Broader exchange coverage (61 trading pairs) enables more flexible trading
Technology Risk
MDT:
- Ethereum-based ERC-20 token dependency exposes it to Ethereum network congestion
- Limited information regarding protocol upgrades and technical roadmap
- No data available on smart contract audits or security assessments
- Ecosystem scalability concerns given the data transaction requirements
SAND:
- Multi-chain deployment (Ethereum and Base EVM) provides redundancy and reduces single-chain dependency
- Reliance on metaverse and gaming adoption rates, subject to technological execution risks
- Smart contract security depends on underlying platform updates and governance decisions
- Network effects critical to platform viability
Regulatory Risk
MDT:
- Data privacy regulations (GDPR, CCPA) may impact decentralized data exchange operations
- Anonymous data transaction mechanisms could face regulatory scrutiny in certain jurisdictions
- Limited historical regulatory precedent for data-focused blockchain protocols
SAND:
- Gaming and NFT regulatory frameworks remain uncertain across jurisdictions
- Virtual economy taxation policies under development in multiple countries
- Play-to-earn mechanics subject to potential gaming and gambling regulations
- Broader metaverse regulations continue evolving globally
III. Potential Opportunities and Growth Drivers
MDT Growth Catalysts
- Expansion of institutional adoption for data monetization solutions
- Integration with AI and machine learning platforms requiring decentralized data sources
- Strategic partnerships with data analytics firms
- Increasing enterprise demand for privacy-preserving data exchanges
SAND Growth Catalysts
- Mainstream adoption of virtual worlds and gaming metaverses
- Institutional investment in NFT and virtual real estate markets
- Expansion of Game Maker ecosystem and third-party developer adoption
- Enterprise partnerships for virtual experiences and brand activations
IV. Investment Recommendation Summary
📌 Investment Value Overview:
MDT Advantages:
- Emerging data economy positioning addresses growing AI infrastructure needs
- Decentralized data exchange model offers differentiation in privacy-conscious markets
- Potential upside trajectory of 83-86% by 2030 based on available price projections
- Lower circulation ratio (60.63%) suggests additional token release potential
SAND Advantages:
- Established gaming metaverse platform with active user base
- Multi-chain infrastructure provides technical resilience
- Higher market liquidity (61 trading pairs, $99,628.68 daily volume)
- Stronger market positioning (#177 ranking) with larger user base (207,106 holders)
- Projected upside of 81-111% by 2030 based on available forecasts
✅ Investment Recommendations:
For New Investors:
- Allocate smaller positions in either asset given extreme market fear sentiment (Fear & Greed Index: 25)
- Prioritize SAND if seeking established ecosystem with broader adoption metrics
- Build positions gradually through dollar-cost averaging rather than lump-sum investment
- Maintain 60%+ of portfolio in stablecoins during elevated volatility
For Experienced Investors:
- Consider MDT for contrarian value positioning given severely depressed valuations and limited liquidity
- SAND offers moderate liquidity for active trading and technical analysis opportunities
- Implement stop-loss orders at 20-25% below entry points given volatility
- Monitor tokenomics release schedules: MDT carries unlimited maximum supply while SAND has fixed 3-billion cap
- Utilize cross-asset hedging strategies incorporating both positions within broader portfolio framework
For Institutional Investors:
- SAND presents more suitable entry point given superior liquidity metrics and market positioning
- MDT requires extensive due diligence on tokenomics sustainability and regulatory compliance for data operations
- Both assets show significant drawdowns from cycle highs, potentially indicating accumulation opportunities for long-term holders
- Evaluate partnership potential with respective teams for strategic ecosystem participation
📊 Comparative Valuation Metrics:
| Metric | MDT | SAND | Winner |
|---|---|---|---|
| Market Cap | $13.52M | $351.3M | SAND |
| Trading Volume | $17.34K | $99.63K | SAND |
| Exchange Pairs | 18 | 61 | SAND |
| Holder Count | 30,316 | 207,106 | SAND |
| Circulation Ratio | 60.63% | 87.11% | MDT |
| 30-day Performance | +2.53% | -20.79% | MDT |
⚠️ Disclaimer and Risk Notice
This report presents factual market data and comparative analysis current as of December 22, 2025, intended for informational purposes only. This analysis does not constitute investment advice, financial recommendations, or solicitation to buy or sell any cryptocurrency.
Critical Risk Factors:
- Cryptocurrency markets demonstrate extreme volatility; price predictions are subject to significant deviation from actual outcomes
- Both MDT and SAND have experienced severe depreciation (75-79%) within the past year
- Current market fear sentiment (Fear & Greed Index: 25) indicates elevated risk conditions
- Past performance does not guarantee future results
- Regulatory changes, technological disruptions, or ecosystem failures could render investments worthless
- Investors should conduct independent research and consult qualified financial advisors before making any investment decisions
Investors assume full responsibility for their financial decisions and potential losses in cryptocurrency markets. None
FAQ: MDT vs SAND Cryptocurrency Investment Comparison
I. What are the fundamental differences between MDT and SAND tokens?
Answer: MDT (Measurable Data Token) is a decentralized big data value economic ecosystem launched in January 2018 that enables anonymous data transactions between users, data purchasers, and data suppliers. SAND (The Sandbox) is a virtual gaming platform and metaverse token introduced in August 2020 where players create, own, and monetize digital assets through play-to-earn mechanics. MDT focuses on data monetization and privacy-preserving exchanges, while SAND emphasizes gaming experiences and NFT creation.
II. Which token has better market liquidity and trading activity?
Answer: SAND demonstrates significantly superior market liquidity compared to MDT. SAND maintains a 24-hour trading volume of $99,628.68 across 61 trading pairs, while MDT shows only $17,343.67 in daily volume across 18 trading pairs. SAND's higher liquidity makes it more suitable for active trading, while MDT's limited liquidity presents higher slippage risks and restricted exit opportunities during market downturns.
III. How have MDT and SAND performed relative to their historical peaks?
Answer: Both tokens have experienced severe depreciation from their 2021 peaks. MDT has declined approximately 91.95% from its all-time high of $0.168053 (December 26, 2021) to the current price of $0.013519. SAND has depreciated approximately 86.0% from its peak of $8.4 (November 25, 2021) to $0.1171. Over the past year, MDT has declined 76% while SAND has fallen 79.31%, indicating both face persistent negative market sentiment.
IV. What are the differences in tokenomics and supply structures?
Answer: MDT has a total supply of 1 billion tokens with 606.3 million in circulation (60.63% circulation ratio) and an unlimited maximum supply. SAND has a fixed total supply of 3 billion tokens with 2.61 billion in circulation (87.11% circulation ratio) and a maximum supply capped at 3 billion. MDT's unlimited maximum supply carries inflation risk, while SAND's fixed cap provides supply certainty, making SAND more favorable from a tokenomics perspective.
V. What are the main investment risks associated with each token?
Answer: MDT faces extreme liquidity risk due to minimal trading volume, limited exchange availability, and micro-cap positioning (#1281 ranking). SAND presents moderate liquidity risk but suffers from severe market depreciation and metaverse adoption uncertainty. Both tokens are vulnerable to regulatory changes—MDT faces data privacy regulation risks (GDPR, CCPA), while SAND faces uncertain gaming and NFT regulatory frameworks. The broader cryptocurrency market's extreme fear sentiment (Fear & Greed Index: 25) amplifies risks for both assets.
VI. Which token offers better growth potential according to price predictions?
Answer: Based on available price projections, SAND demonstrates higher absolute upside potential with predicted 81-111% growth by 2030, compared to MDT's projected 83-86% upside. However, these predictions are subject to significant deviation given market volatility. By 2030, MDT is forecast in the $0.0129-$0.0326 range while SAND is projected in the $0.1559-$0.2828 range. These forecasts should not be viewed as guarantees and depend on ecosystem adoption rates and macroeconomic conditions.
VII. Which token is more suitable for different investor profiles?
Answer: For conservative investors, SAND is preferable given its superior market position (#177 ranking), broader adoption metrics (207,106 holders), and established gaming ecosystem. MDT suits contrarian investors seeking undervalued positions in emerging data economy sectors. New investors should prioritize dollar-cost averaging through SAND given better liquidity, while experienced investors may consider MDT for speculative value positions. Institutional investors should prioritize SAND due to superior trading infrastructure and market adoption, reserving MDT evaluation for specialized data monetization strategies.
VIII. What blockchain infrastructure supports each token and what are the implications?
Answer: MDT operates exclusively on Ethereum as an ERC-20 token, creating single-chain dependency and exposure to network congestion risks. SAND operates on both Ethereum and Base EVM, providing multi-chain redundancy and reduced reliance on any single blockchain. SAND's multi-chain deployment offers technical resilience advantages, while MDT's Ethereum-only positioning simplifies integration but introduces higher operational risk from Ethereum network limitations or potential future migrations.
⚠️ Disclaimer: This FAQ provides factual market information current as of December 22, 2025, for informational purposes only. This analysis does not constitute investment advice or recommendations to buy/sell cryptocurrency. Cryptocurrency markets are highly volatile. Past performance does not guarantee future results. Investors must conduct independent research and consult qualified financial advisors before making investment decisions. All investors assume full responsibility for potential losses.
Share
How to Buy Cryptocurrency


Trending Cryptocurrencies


Is BRN Metaverse (BRN) a good investment?: Analyzing the potential and risks of this virtual world token

Is Loaded Lions (LION) a good investment?: Evaluating the potential of this new NFT project in a volatile crypto market

GEMS vs SAND: A Comparison of Two Popular Metaverse Tokens in the Digital Landscape
Is Binamon (BMON) a good investment?: Analyzing the potential of this NFT gaming token in the evolving metaverse landscape

Is Race Kingdom (ATOZ) a good investment?: Analyzing the Potential and Risks of this NFT Gaming Project
Is Lootex (LOOT) a good investment?: Analyzing the potential and risks of this NFT marketplace token

What is PIEVERSE token economics model with 1 billion supply breakdown?

How Is PIEVERSE Community Activity and Ecosystem Engagement Driving Its Token Value?

A Beginner's Guide to Risk Management in Online Trading
What is Official Trump (TRUMP) market overview: price, market cap, and 24-hour trading volume?
Bitcoin Dips Under 115,000 USD: Long-Term Bull Market Prospects