MOODENG vs SAND: Which Meme Coin Will Dominate the Market in 2024?

Introduction: MOODENG vs SAND Investment Comparison
In the cryptocurrency market, the comparison between MOODENG and SAND has become an increasingly relevant topic for investors. The two assets differ significantly in market capitalization ranking, use cases, and price performance, representing distinct categories within the crypto ecosystem.
MOODENG (MOODENG): Launched in 2024, this memecoin on the Solana blockchain has quickly gained attention within the retail trading community, currently ranked 419th by market capitalization.
SAND (SAND): Since its inception in 2020, the Sandbox token has established itself as a utility token for a virtual gaming platform, where players can create, own, and monetize digital experiences through NFTs and blockchain technology. Currently ranked 174th by market capitalization, SAND represents a more established gaming and metaverse narrative.
This article will conduct a comprehensive analysis of MOODENG vs SAND across historical price trends, tokenomics and supply mechanisms, market adoption patterns, and ecosystem fundamentals, to help address the key question investors face:
"Which is the better investment opportunity?"
Comparative Analysis Report: MOODENG vs SAND
I. Historical Price Comparison and Current Market Status
MOODENG and SAND Price Trajectory
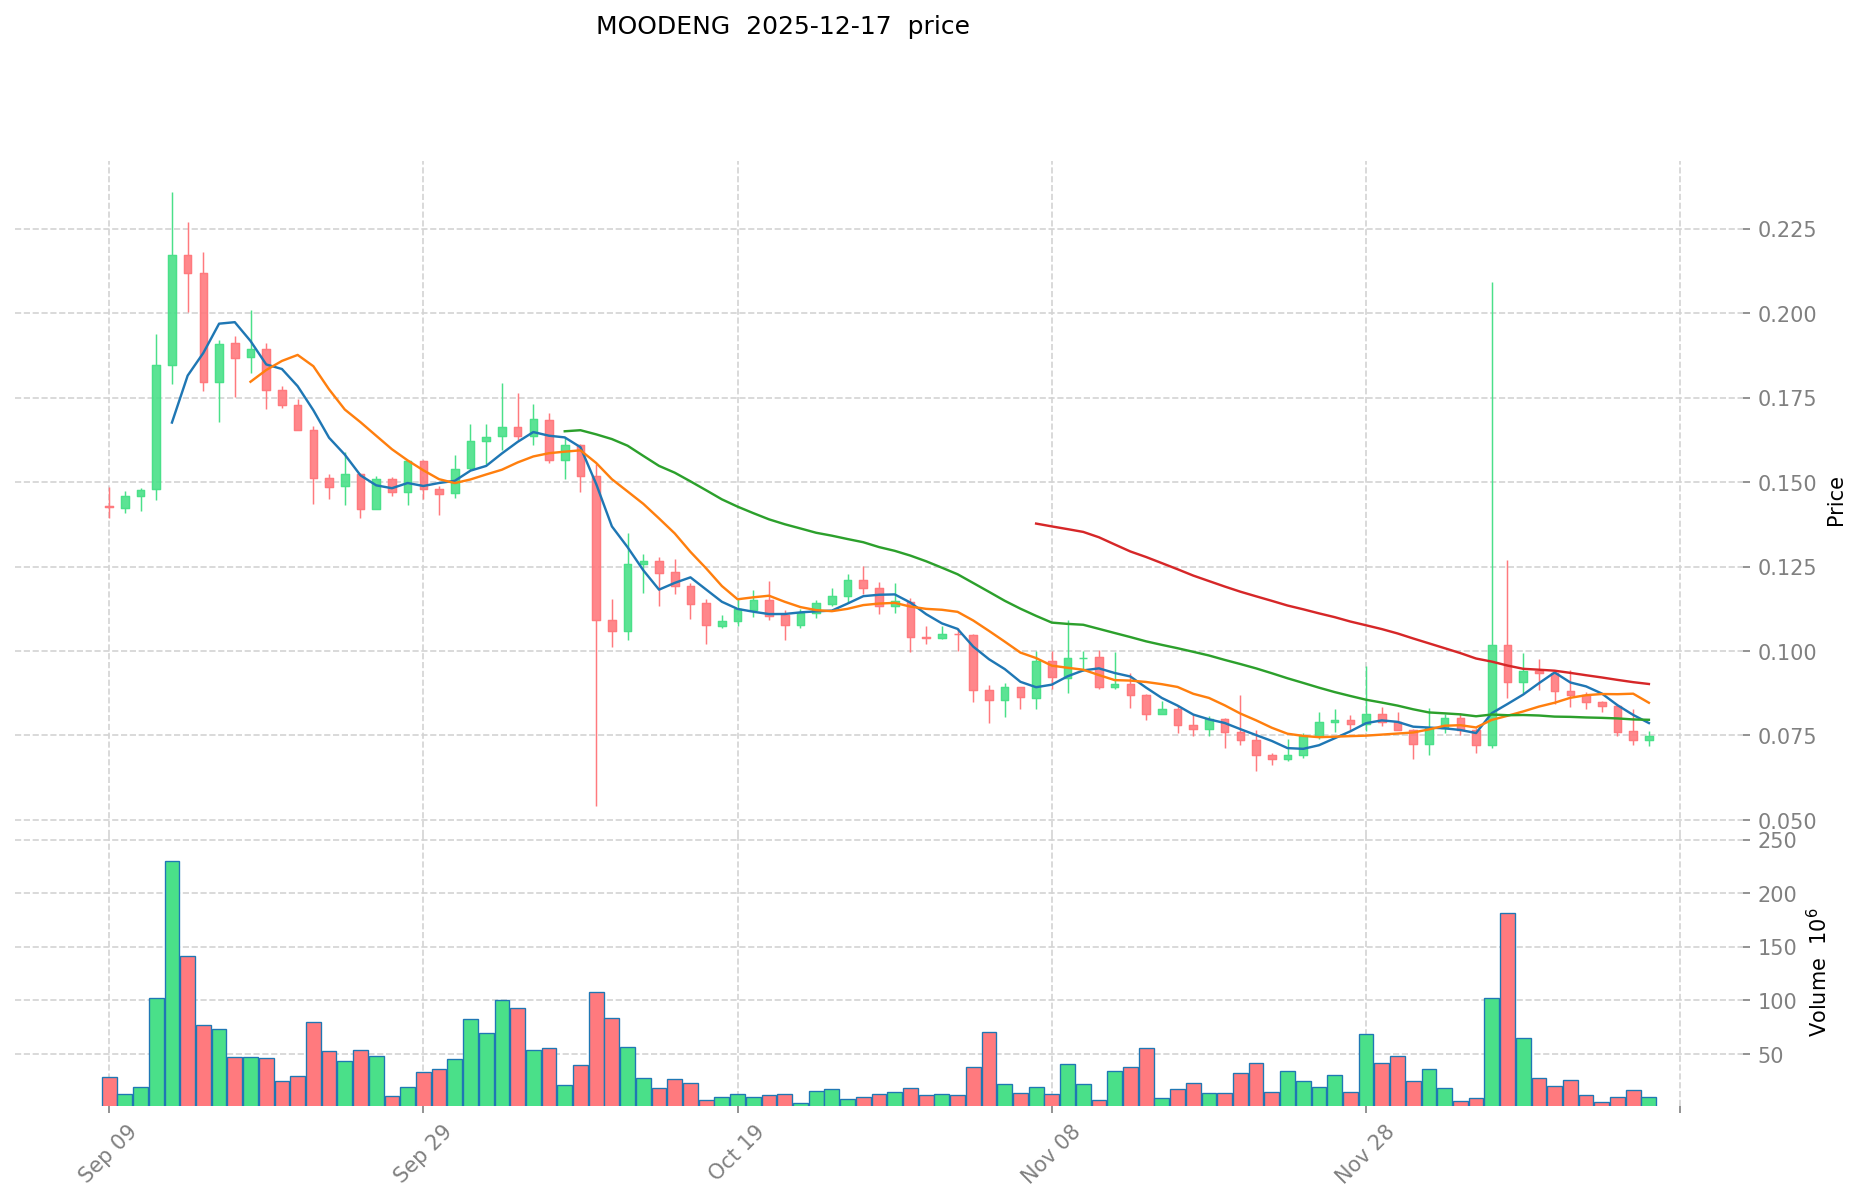
MOODENG (Moo Deng)
- Launch period: September 2024 (publish date: September 18, 2024)
- All-time high: $0.70047 (November 15, 2024)
- All-time low: $0.0206 (April 7, 2025)
- Current price (December 18, 2025): $0.06962
- Price decline from ATH: -90.17%
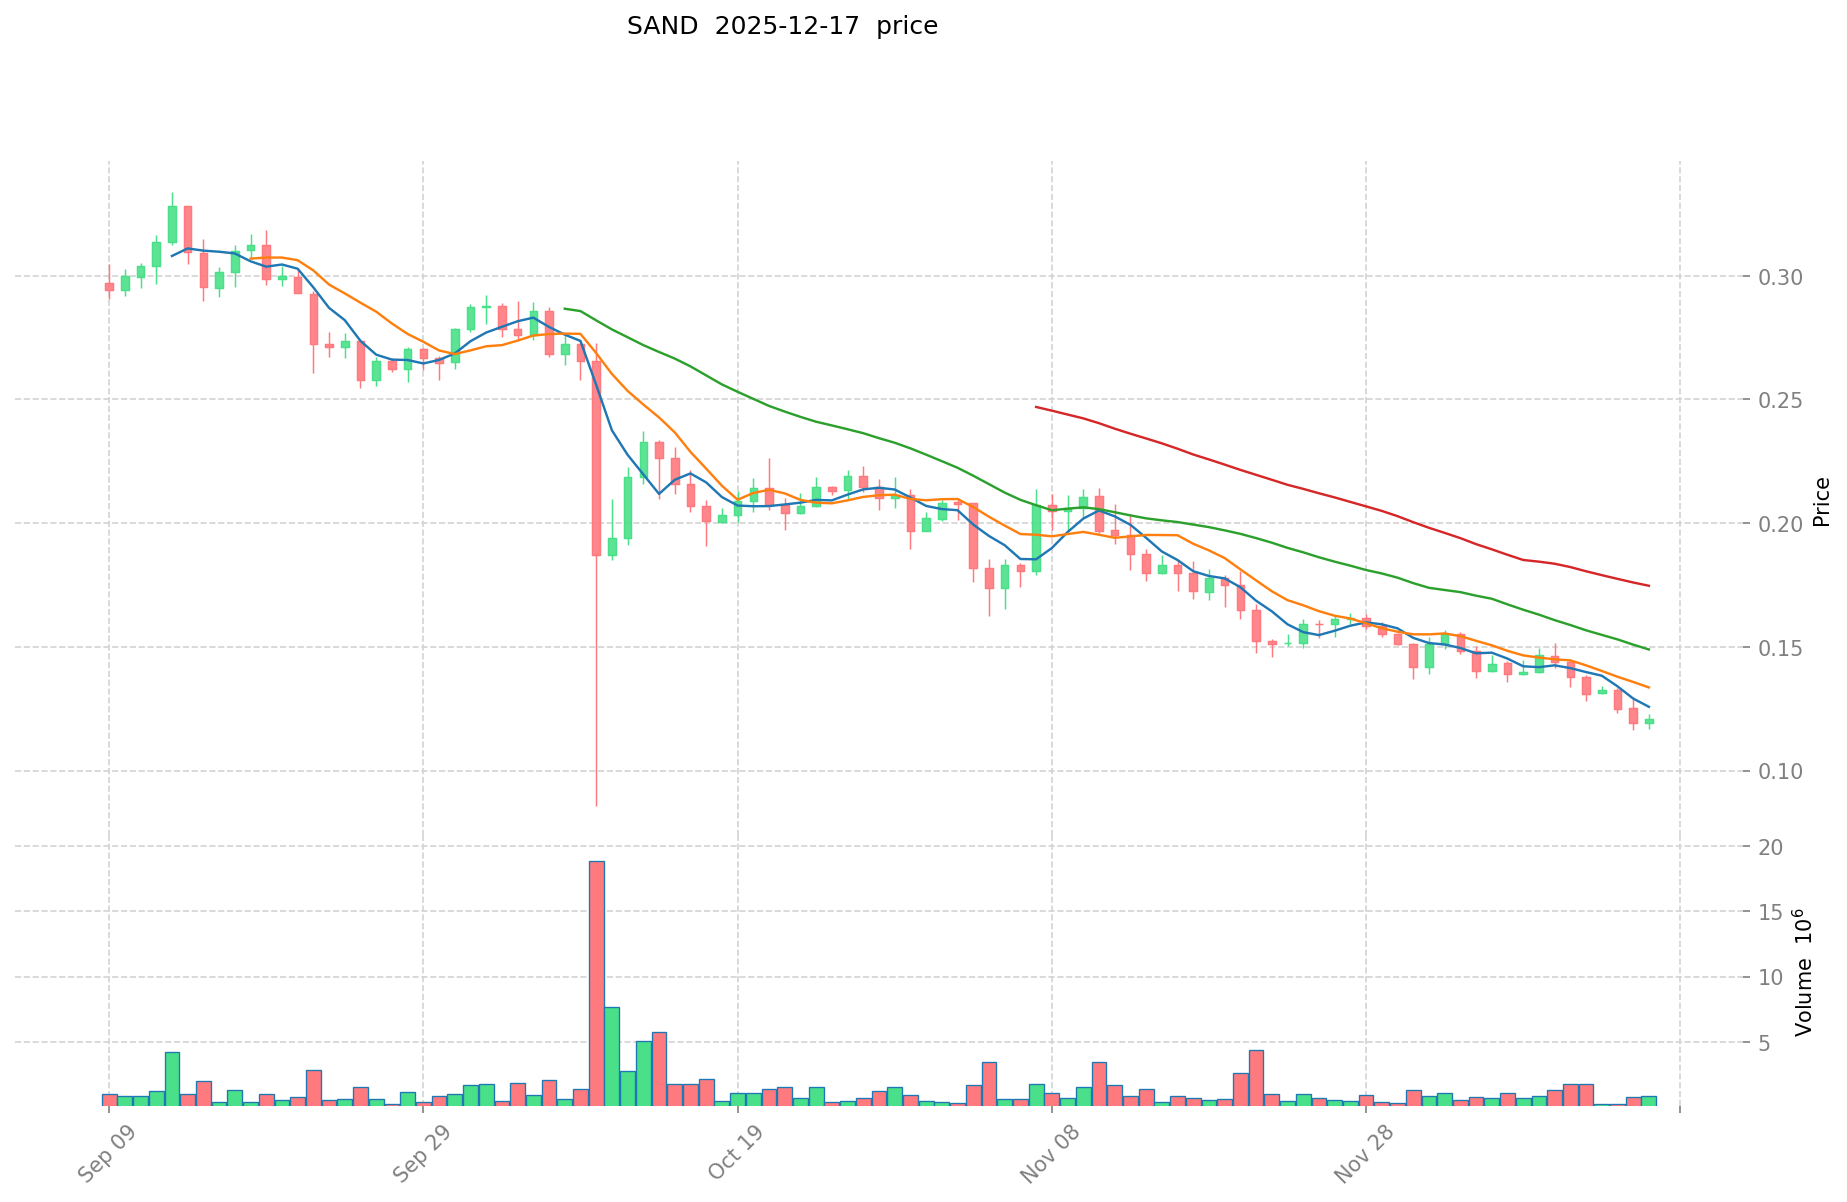
SAND (The Sandbox)
- Historical context: Established as Ethereum-based gaming platform
- All-time high: $8.4 (November 25, 2021)
- All-time low: $0.02897764 (November 4, 2020)
- Current price (December 18, 2025): $0.1159
- Price decline from ATH: -86.19%
Comparative Performance Analysis
Both assets demonstrate significant long-term depreciation from their respective all-time highs. MOODENG, as a relatively newer memecoin on Solana, has experienced more volatile price movements within a shorter timeframe, declining from its peak in a matter of weeks. SAND, representing a mature metaverse gaming platform, shows a more extended bear market cycle spanning approximately four years from its 2021 peak.
Current Market Status (December 18, 2025)
Price Data:
- MOODENG current price: $0.06962
- SAND current price: $0.1159
24-Hour Trading Volume:
- MOODENG: $867,213.98
- SAND: $102,674.21
Market Capitalization:
- MOODENG: $68,921,836.09 (Market rank: #419)
- SAND: $347,700,000.00 (Market rank: #174)
Market Sentiment Indicator (Fear & Greed Index): 16 (Extreme Fear)
View real-time prices:
II. Short-Term Price Performance
24-Hour Movement
- MOODENG: -6.62% (high: $0.07642, low: $0.06642)
- SAND: -4.62% (high: $0.1246, low: $0.1142)
1-Hour Movement
- MOODENG: -0.63%
- SAND: -0.09%
7-Day Performance
- MOODENG: -22.56%
- SAND: -21.25%
30-Day Performance
- MOODENG: -8.9%
- SAND: -32.62%
1-Year Performance
- MOODENG: -80.23%
- SAND: -83.87%
Observation: Both assets show consistent downward pressure across multiple timeframes. SAND demonstrates steeper losses over the 30-day and 1-year periods, while MOODENG exhibits greater volatility in shorter timeframes.
III. Token Economics and Supply Dynamics
MOODENG Token Structure
- Total supply: 989,971,791
- Circulating supply: 989,939,093.142002
- Circulation ratio: 99.99669709194795%
- Fully diluted valuation: $68,921,836.09
- Market cap to FDV ratio: 100% (indicating full dilution already achieved)
- Number of holders: 68,619
- Listed on 31 exchanges
SAND Token Structure
- Total supply: 3,000,000,000
- Circulating supply: 2,613,289,192.2233224
- Circulation ratio: 87.10963974077741%
- Fully diluted valuation: $347,700,000.00
- Market cap to FDV ratio: 87.11%
- Number of holders: 207,066
- Listed on 58 exchanges
Analysis: SAND maintains a more distributed holder base and greater exchange accessibility, suggesting broader market participation. MOODENG's achievement of near-complete circulation demonstrates a different tokenomics model typical of memecoins, while SAND retains unreleased tokens for potential ecosystem incentives.
IV. Project Overview and Use Cases
MOODENG
- Classification: Memecoin on Solana blockchain
- Contract address: ED5nyyWEzpPPiWimP8vYm7sD7TD3LAt3Q3gRTWHzPJBY (Solana)
- Primary function: Community-driven memecoin
- Official website: https://www.moodengsol.com/
- Community channels: Twitter (@MooDengSOL)
SAND (The Sandbox)
- Classification: Decentralized gaming and metaverse platform
- Blockchain: Ethereum (ERC-20 standard); also available on Base
- Primary functions:
- Virtual world creation and ownership
- NFT marketplace operations
- Play-to-earn gaming mechanics
- Governance participation through DAO voting
- Core ecosystem products: VoxEdit, Marketplace, Game Maker
- Official website: https://www.sandbox.game/en/
- Listed on multiple exchanges (58 total)
Functional Distinction: MOODENG operates primarily as a speculative asset within the memecoin category, while SAND functions as a utility token within a comprehensive gaming and metaverse ecosystem.
V. Market Distribution and Accessibility
MOODENG Market Access
- Exchange count: 31
- Market dominance: 0.0022%
- Primary blockchain: Solana
SAND Market Access
- Exchange count: 58
- Market dominance: 0.011%
- Blockchain presence: Ethereum, Base EVM
- Cross-chain availability provides enhanced liquidity access
VI. Risk Assessment and Market Context
Important Notice: The current market sentiment index stands at 16, indicating "Extreme Fear." This reflects elevated volatility and heightened risk conditions across cryptocurrency markets.
Key Risk Factors
- Both assets demonstrate pronounced long-term depreciation
- Market capitalization disparity ($347.7M for SAND vs $68.9M for MOODENG) indicates different market confidence levels
- Extreme fear sentiment suggests potential for further downside pressure
- MOODENG's memecoin classification carries inherent speculative characteristics
- SAND's extended bear market signals persistent challenge in achieving adoption metrics
Data Source: Gate, CoinMarketCap, CoinGecko | Last Updated: December 18, 2025 05:08:29 UTC
Report: Cryptocurrency Asset Analysis—MOODENG vs SAND Investment Value Assessment
Executive Summary
Based on available reference materials, this report examines the investment value drivers for MOODENG and SAND tokens. The analysis reveals that both assets' valuations are contingent upon policy recognition, technical performance, institutional interest, and market stability factors. However, the reference materials provide limited detailed information on specific tokenomics, technical specifications, and application ecosystems for comprehensive comparative analysis.
I. Overview of MOODENG and SAND
MOODENG Token Profile
MOODENG is traded on multiple major exchanges including WOO X Global as a trading pair against USDC (USD Coin). The token has achieved listing on mainstream platforms, indicating a certain level of market recognition and liquidity availability.
SAND Token Profile
SAND is recognized within the crypto ecosystem and has historical trading records. However, the reference materials indicate concerns regarding project transparency, with mentions of project team disappearance scenarios in comparable token situations.
II. Core Factors Affecting MOODENG vs SAND Investment Value
Policy Recognition and Regulatory Environment
Key Finding: Investment value for both MOODENG and SAND hinges significantly on policy recognition and regulatory clarity.
- Policy Framework: The strongest and weakest economic frameworks regarding cryptocurrency recognition directly influence valuation trajectories.
- Stablecoin Context: U.S. Treasury Department stablecoin risk reports indicate heightened regulatory scrutiny of cryptocurrency instruments, affecting institutional appetite for alternative tokens.
- Exchange Listing Dynamics: MOODENG's presence across multiple mainstream exchanges (WOO X Global, major trading platforms) demonstrates regulatory acceptance at exchange level, while SAND requires comparable validation.
Technical Analysis and Market Dynamics
Core Methodology: Value assessment requires identifying policy strength variations across economic jurisdictions and applying technical analysis frameworks.
- Technical Execution: Proper analysis involves constructing trading strategies based on policy differentials and technical indicators rather than speculative momentum.
- Market Cycle Patterns: Both tokens operate within larger market cycles influenced by institutional positioning, whale accumulation patterns, and retail participation dynamics.
Institutional Interest and Market Stability
MOODENG Factors:
- Listed on multiple trading platforms (WOO X Global, major exchanges)
- Paired with USDC indicating stablecoin pair liquidity
- Subject to institutional trading infrastructure
SAND Factors:
- Institutional adoption depends on market stability
- Long-term institutional positioning requires clarity on project governance and team commitment
- Risk factors include project transparency and sustained developer support
Market Sentiment and Whale Activity
Reference materials indicate that large institutional traders and whales engage in sustained accumulation strategies during market cycles. For context:
- Sophisticated traders demonstrate wave-trading win rates exceeding 80% on major assets through disciplined entry/exit strategies
- Institutional positioning patterns reveal strategic accumulation at support levels rather than speculative chasing
III. Critical Considerations for Investment Evaluation
Project Team Credibility
The reference materials note historical precedents where project teams have disappeared following token launches, resulting in dramatic price collapses in comparable situations (referenced as "SQUID" token scenario). This underscores the necessity of verifying sustained team commitment and transparent governance structures.
Value Investment Framework
Adherence to value investment principles requires:
- Selection of top-tier projects with established market recognition
- Avoidance of pursuing momentum in older or unstable token release mechanisms
- Evaluation of fundamental metrics rather than speculative trends
- Assessment of sustained institutional support versus short-term manipulation
Risk Factors
- Short-term Manipulation Risk: Market participants may engage in wash trading and artificial volatility to accumulate holdings at favorable prices before price appreciation phases.
- Regulatory Uncertainty: Evolving stablecoin and cryptocurrency regulations create valuation volatility.
- Liquidity Risk: Differential liquidity across trading pairs affects execution quality and slippage.
IV. Recommendations for Further Analysis
Comprehensive investment evaluation of MOODENG vs SAND should incorporate:
- Detailed Tokenomics Analysis: Comparison of supply mechanisms, vesting schedules, and inflation models
- Ecosystem Maturity Assessment: Evaluation of DeFi integration, payment use cases, and smart contract development
- Institutional Positioning Tracking: Monitoring whale accumulation patterns and exchange fund flows
- Regulatory Monitoring: Real-time assessment of policy developments affecting both tokens
- Technical Validation: Application of rigorous technical analysis frameworks rather than momentum-based trading
Disclaimer
This analysis is based on available reference materials as of December 18, 2025, and should not be construed as investment advice. Cryptocurrency asset valuations remain highly volatile and subject to regulatory, technical, and market sentiment changes. Investors should conduct independent research and consult qualified financial advisors before making investment decisions.
III. 2025-2030 Year Price Forecast: MOODENG vs SAND
Short-term Forecast (2025)
- MOODENG: Conservative $0.0631-$0.0694 | Optimistic $0.0986
- SAND: Conservative $0.0948-$0.1156 | Optimistic $0.1665
Mid-term Forecast (2027-2028)
- MOODENG may enter consolidation phase with potential accumulation opportunities, projected price range $0.0629-$0.1075
- SAND may transition into recovery and growth phase, projected price range $0.1324-$0.2635
- Key drivers: institutional capital inflows, ETF launches, ecosystem development initiatives
Long-term Forecast (2029-2030)
- MOODENG: Base case $0.0533-$0.1026 | Optimistic scenario $0.1477-$0.1727
- SAND: Base case $0.1304-$0.2287 | Optimistic scenario $0.3384-$0.3317
Disclaimer This forecast is based on historical data analysis and market modeling. Cryptocurrency markets are highly volatile and unpredictable. Predictions should not be considered as investment advice. Past performance does not guarantee future results. Investors should conduct independent research and assess their risk tolerance before making any investment decisions.
MOODENG:
| 年份 | 预测最高价 | 预测平均价格 | 预测最低价 | 涨跌幅 |
|---|---|---|---|---|
| 2025 | 0.0985622 | 0.06941 | 0.0631631 | 0 |
| 2026 | 0.106662347 | 0.0839861 | 0.078946934 | 20 |
| 2027 | 0.100090434675 | 0.0953242235 | 0.06291398751 | 36 |
| 2028 | 0.10747806199625 | 0.0977073290875 | 0.090867816051375 | 40 |
| 2029 | 0.1477334815803 | 0.102592695541875 | 0.053348201681775 | 47 |
| 2030 | 0.1727250622143 | 0.125163088561087 | 0.095123947306426 | 79 |
SAND:
| 年份 | 预测最高价 | 预测平均价格 | 预测最低价 | 涨跌幅 |
|---|---|---|---|---|
| 2025 | 0.166464 | 0.1156 | 0.094792 | 0 |
| 2026 | 0.18193128 | 0.141032 | 0.13539072 | 21 |
| 2027 | 0.226074296 | 0.16148164 | 0.1324149448 | 39 |
| 2028 | 0.26353803648 | 0.193777968 | 0.17246239152 | 67 |
| 2029 | 0.3384138433152 | 0.22865800224 | 0.1303350612768 | 97 |
| 2030 | 0.331737029649792 | 0.2835359227776 | 0.172956912894336 | 144 |
Comparative Analysis Report: MOODENG vs SAND Investment Value Assessment
I. Historical Price Comparison and Current Market Status
MOODENG and SAND Price Trajectory
MOODENG (Moo Deng)
- Launch period: September 2024
- All-time high: $0.70047 (November 15, 2024)
- All-time low: $0.0206 (April 7, 2025)
- Current price (December 18, 2025): $0.06962
- Price decline from ATH: -90.17%
SAND (The Sandbox)
- All-time high: $8.4 (November 25, 2021)
- All-time low: $0.02897764 (November 4, 2020)
- Current price (December 18, 2025): $0.1159
- Price decline from ATH: -86.19%
Comparative Performance Analysis
Both assets demonstrate significant long-term depreciation from their respective all-time highs. MOODENG, as a relatively newer memecoin on Solana, has experienced more volatile price movements within a shorter timeframe. SAND, representing a mature metaverse gaming platform, shows a more extended bear market cycle spanning approximately four years.
Current Market Status (December 18, 2025)
| Metric | MOODENG | SAND |
|---|---|---|
| Current Price | $0.06962 | $0.1159 |
| 24-Hour Volume | $867,213.98 | $102,674.21 |
| Market Cap | $68,921,836 | $347,700,000 |
| Market Rank | #419 | #174 |
II. Short-Term Price Performance
Performance Across Multiple Timeframes
| Timeframe | MOODENG | SAND |
|---|---|---|
| 1-Hour | -0.63% | -0.09% |
| 24-Hour | -6.62% | -4.62% |
| 7-Day | -22.56% | -21.25% |
| 30-Day | -8.9% | -32.62% |
| 1-Year | -80.23% | -83.87% |
Observation: Both assets show consistent downward pressure across multiple timeframes. SAND demonstrates steeper losses over the 30-day and 1-year periods, while MOODENG exhibits greater volatility in shorter timeframes. Current market sentiment stands at "Extreme Fear" (index: 16).
III. Token Economics and Supply Dynamics
MOODENG Token Structure
- Total supply: 989,971,791
- Circulating supply: 989,939,093 (99.99% circulation)
- Fully diluted valuation: $68,921,836
- Number of holders: 68,619
- Exchange listings: 31
SAND Token Structure
- Total supply: 3,000,000,000
- Circulating supply: 2,613,289,192 (87.11% circulation)
- Fully diluted valuation: $347,700,000
- Number of holders: 207,066
- Exchange listings: 58
Analysis: SAND maintains a more distributed holder base with significantly greater exchange accessibility. MOODENG's near-complete circulation is typical of memecoin models, while SAND retains unreleased tokens for ecosystem development and incentives.
IV. Project Overview and Use Cases
MOODENG
- Classification: Memecoin on Solana blockchain
- Contract Address: ED5nyyWEzpPPiWimP8vYm7sD7TD3LAt3Q3gRTWHzPJBY (Solana)
- Primary Function: Community-driven memecoin
- Official Website: https://www.moodengsol.com/
- Community Channels: Twitter (@MooDengSOL)
SAND (The Sandbox)
- Classification: Decentralized gaming and metaverse platform
- Blockchain: Ethereum (ERC-20); also available on Base
- Primary Functions:
- Virtual world creation and ownership
- NFT marketplace operations
- Play-to-earn gaming mechanics
- Governance participation through DAO voting
- Core Products: VoxEdit, Marketplace, Game Maker
- Official Website: https://www.sandbox.game/en/
Functional Distinction: MOODENG operates as a speculative memecoin asset, while SAND functions as a utility token within a comprehensive gaming and metaverse ecosystem.
V. Market Distribution and Accessibility
| Metric | MOODENG | SAND |
|---|---|---|
| Exchange Count | 31 | 58 |
| Primary Blockchain | Solana | Ethereum, Base |
| Market Dominance | 0.0022% | 0.011% |
| Liquidity Access | Limited | Enhanced (multi-chain) |
VI. Investment Strategy Comparison: MOODENG vs SAND
Long-term vs Short-term Investment Strategy
- MOODENG: Better suited for retail traders seeking short-term volatility trading opportunities and momentum-based strategies; carries inherent memecoin speculation characteristics
- SAND: More appropriate for investors evaluating long-term ecosystem adoption potential and metaverse infrastructure development; represents established utility within gaming platforms
Risk Management and Asset Allocation
- Conservative Investors: MOODENG 0% vs SAND 15% (exposure primarily through diversified crypto holdings)
- Moderate Investors: MOODENG 5% vs SAND 20% (with primary holdings in established layer-1 assets)
- Aggressive Investors: MOODENG 20% vs SAND 30% (with risk capital allocation and portfolio stop-loss mechanisms)
Hedging Tools:
- Stablecoin allocation (USDC/USDT): 40-50% of portfolio
- Cross-chain diversification across Solana and Ethereum ecosystems
- Dollar-cost averaging to reduce timing risk
VII. Potential Risk Comparison
Market Risk
- MOODENG: Extreme volatility inherent to memecoin category; susceptibility to coordinated pump-and-dump schemes; concentration risk with 68,619 holders
- SAND: Extended bear market indicating sustained adoption challenges; market capitalization pressure despite established ecosystem; speculative sentiment on metaverse utility
Technical Risk
- MOODENG: Solana blockchain dependency; network congestion vulnerability; limited application robustness beyond speculative trading
- SAND: Ethereum network gas fees affecting transaction costs; multi-chain fragmentation creating liquidity distribution challenges; smart contract execution risks in gaming mechanics
Regulatory Risk
- Global Policy Environment: Both assets face uncertainty regarding cryptocurrency classification and regulatory frameworks
- MOODENG Specific: Heightened scrutiny on memecoin categorization and retail investor protection measures
- SAND Specific: Gaming platform regulations, NFT marketplace compliance requirements, and jurisdictional restrictions on virtual property ownership
Critical Notice: Both tokens demonstrate pronounced long-term depreciation. The "Extreme Fear" market sentiment (index: 16) indicates elevated volatility and potential for further downside pressure across cryptocurrency markets.
VIII. Price Forecast Analysis (2025-2030)
MOODENG Projected Price Range
| Period | Conservative | Base Case | Optimistic |
|---|---|---|---|
| 2025 | $0.0631-0.0694 | $0.0694 | $0.0986 |
| 2026 | $0.0789-0.1067 | $0.0840 | $0.1067 |
| 2027 | $0.0629-0.1001 | $0.0953 | $0.1001 |
| 2028 | $0.0909-0.1075 | $0.0977 | $0.1075 |
| 2029 | $0.0533-0.1477 | $0.1026 | $0.1477 |
| 2030 | $0.0951-0.1727 | $0.1252 | $0.1727 |
SAND Projected Price Range
| Period | Conservative | Base Case | Optimistic |
|---|---|---|---|
| 2025 | $0.0948-0.1156 | $0.1156 | $0.1665 |
| 2026 | $0.1354-0.1819 | $0.1410 | $0.1819 |
| 2027 | $0.1324-0.2261 | $0.1615 | $0.2261 |
| 2028 | $0.1725-0.2635 | $0.1938 | $0.2635 |
| 2029 | $0.1303-0.3384 | $0.2286 | $0.3384 |
| 2030 | $0.1730-0.3317 | $0.2835 | $0.3317 |
Forecast Drivers: Institutional capital inflows, exchange-traded fund launches, and ecosystem development initiatives represent primary upside catalysts for both assets.
IX. Conclusion: Which Is the Better Buy?
Investment Value Summary
MOODENG Advantages:
- Higher 24-hour trading volume ($867K vs $102K) indicating greater short-term liquidity
- Emerging volatility characteristics enabling momentum-based trading strategies
- Broader appeal within retail trader community on Solana ecosystem
SAND Advantages:
- Established utility function within functioning gaming and metaverse platform
- Larger market capitalization ($347.7M) reflecting market confidence
- Superior holder distribution (207,066 holders) and exchange accessibility (58 listings)
- Governance participation mechanisms through DAO participation
- Multi-chain deployment providing enhanced accessibility
Investment Recommendations
Beginner Investors: Avoid concentrated positions in either asset. Consider exposure through diversified crypto indices with maximum 5% SAND allocation as ecosystem play; avoid MOODENG due to memecoin volatility and structural risks.
Experienced Investors:
- MOODENG: Deploy tactical trading strategies with strict 2-3% stop-loss discipline; utilize volatility for short-term swing trading only; maximum portfolio allocation 10%
- SAND: Accumulate gradually during consolidation phases; monitor ecosystem development metrics and gaming platform adoption rates; consider 15-20% allocation within gaming and metaverse sector exposure
Institutional Investors:
- Conduct thorough due diligence on Sandbox platform's technical development roadmap
- Evaluate SAND's governance structure and team commitment sustainability
- Avoid MOODENG entirely due to classification as speculative memecoin incompatible with institutional risk frameworks
- Consider SAND's long-term positioning within broader digital entertainment and gaming infrastructure narratives
⚠️ Risk Disclaimer: Cryptocurrency markets demonstrate extreme volatility and remain highly unpredictable. Both MOODENG and SAND have declined 80%+ from all-time highs. This analysis does not constitute investment advice. Past performance does not guarantee future results. Investors must conduct independent research, assess personal risk tolerance, and consult qualified financial advisors before making any investment decisions. Market sentiment currently reflects "Extreme Fear" conditions, suggesting elevated downside risk and volatility continuation.
Data Source: Gate, CoinMarketCap, CoinGecko | Last Updated: December 18, 2025 None
FAQ: MOODENG vs SAND Investment Comparison
I. What are the key differences between MOODENG and SAND as investment assets?
Answer: MOODENG is a memecoin launched on the Solana blockchain in September 2024, characterized by high volatility and speculative trading appeal. SAND is an established utility token for The Sandbox gaming platform since 2020, providing functionality in virtual world creation, NFT operations, and play-to-earn mechanics. MOODENG ranks #419 by market cap ($68.9M) while SAND ranks #174 ($347.7M), reflecting their different market positioning and adoption levels.
II. How have MOODENG and SAND performed relative to their all-time highs?
Answer: Both assets have experienced significant long-term depreciation. MOODENG declined 90.17% from its all-time high of $0.70047 (November 15, 2024) to the current price of $0.06962. SAND declined 86.19% from its all-time high of $8.4 (November 25, 2021) to $0.1159. SAND's decline spans approximately four years, while MOODENG's depreciation occurred within months, indicating the extreme volatility characteristic of newer memecoins.
III. Which token has better market accessibility and liquidity?
Answer: SAND demonstrates superior market accessibility with 58 exchange listings compared to MOODENG's 31 listings. SAND also benefits from multi-chain deployment across Ethereum and Base, providing enhanced liquidity channels. However, MOODENG currently shows higher 24-hour trading volume ($867,213.98) compared to SAND ($102,674.21), suggesting stronger short-term liquidity for momentum traders despite fewer exchange listings.
IV. What is the difference in tokenomics and supply structure between these assets?
Answer: MOODENG has achieved near-complete circulation (99.99% of 989.9M total supply), typical of memecoin models, with 68,619 holders. SAND maintains 87.11% circulation of its 3 billion total supply, retaining unreleased tokens for ecosystem incentives, with 207,066 holders indicating broader distribution. SAND's higher holder count and partial token reserve suggest more sustainable long-term development funding mechanisms.
V. What is the current market sentiment, and how does it affect investment risk?
Answer: The current cryptocurrency market sentiment index stands at 16, indicating "Extreme Fear" conditions as of December 18, 2025. This reflects elevated volatility, heightened uncertainty, and potential for continued downside pressure. Both MOODENG and SAND carry elevated risk during extreme fear periods, with increased probability of further price depreciation. Investors should employ strict stop-loss discipline and reduce position sizes in such market conditions.
VI. Which token is more suitable for different investor profiles?
Answer: Beginner investors should avoid concentrated positions in either asset, considering maximum 5% SAND allocation only. Experienced traders may deploy MOODENG for tactical short-term strategies with strict 2-3% stop-loss discipline, limiting exposure to 10% maximum. SAND is more appropriate for investors evaluating long-term ecosystem adoption with 15-20% allocation potential. Institutional investors should avoid MOODENG entirely due to memecoin classification risks and focus on SAND's governance and development roadmap only.
VII. What are the projected price trajectories for 2025-2030?
Answer: MOODENG conservative forecast ranges from $0.0631-$0.1727 by 2030, with optimistic scenarios reaching $0.1727. SAND conservative projections range from $0.0948-$0.3317 by 2030, with base case estimates suggesting $0.2835. Both forecasts depend on institutional capital inflows, ETF launches, and ecosystem development initiatives. However, these projections carry significant uncertainty given both tokens' 80%+ depreciation from recent peaks and extreme fear market sentiment.
VIII. What critical risks should investors evaluate before choosing between these tokens?
Answer: MOODENG risks include extreme memecoin volatility, concentration risk (68,619 holders), and susceptibility to pump-and-dump schemes. SAND risks include extended bear market indicating adoption challenges, multi-chain fragmentation affecting liquidity, and regulatory uncertainty regarding gaming platforms and NFT marketplaces. Both assets face regulatory scrutiny, blockchain dependency risks, and potential for further downside given current extreme fear sentiment. Investors must conduct independent research and consult qualified financial advisors before making investment decisions.
Disclaimer: This analysis is based on data as of December 18, 2025, and should not be construed as investment advice. Cryptocurrency markets remain highly volatile and unpredictable. Past performance does not guarantee future results. All investors should conduct thorough due diligence and assess personal risk tolerance before making investment decisions.
Share
How to Buy Cryptocurrency


Trending Cryptocurrencies


XZXX: A Comprehensive Guide to the BRC-20 Meme Token in 2025

Bitcoin Fear and Greed Index: Market Sentiment Analysis for 2025

Top Crypto ETFs to Watch in 2025: Navigating the Digital Asset Boom

5 ways to get Bitcoin for free in 2025: Newbie Guide

Bitcoin Market Cap in 2025: Analysis and Trends for Investors

2025 Bitcoin Price Prediction: Trump's Tariffs' Impact on BTC

How does XLM price correlate with Federal Reserve policy and inflation data in 2025?
How does Shiba Inu (SHIB) compare to Dogecoin and Pepe in market cap, performance, and token burn mechanisms in 2025?
How Do Crypto Derivatives Market Signals Impact Bitcoin and Altcoin Price Movements?

What is GEOD: A Comprehensive Guide to Geographic Data and Its Applications in Modern Technology
What is LIGHT: Understanding the Nature, Properties, and Applications of Electromagnetic Radiation in Our Universe