NIBI vs LINK: A Comprehensive Comparison of Two Leading Blockchain Infrastructure Protocols

Introduction: NIBI vs LINK Investment Comparison
In the cryptocurrency market, the comparison between NIBI vs LINK has consistently been a topic investors cannot overlook. Both demonstrate notable differences in market cap rankings, application scenarios, and price performance, representing distinct crypto asset positioning. Nibiru Chain (NIBI): Launched in 2024, it has gained market recognition by positioning itself as a developer-friendly and user-friendly L1 blockchain and smart contract ecosystem offering superior throughput and security. ChainLink (LINK): Since its launch in 2017, it has been recognized for its role in providing decentralized oracle networks, serving as a bridge between blockchain smart contracts and off-chain data sources. It ranks among cryptocurrencies with substantial trading volume and market capitalization. This article will provide a comprehensive analysis of NIBI vs LINK investment value comparison through historical price trends, supply mechanisms, institutional adoption, technological ecosystems, and future projections, attempting to address investors' most pressing question:
"Which is the better buy right now?"
I. Historical Price Comparison and Current Market Status
Historical Price Trends of NIBI (Coin A) and LINK (Coin B)
- 2024: NIBI reached its all-time high of $1.032 on March 12, 2024, following its mainnet launch earlier that month. The token experienced significant volatility in its early trading phase.
- 2021: LINK achieved its historical peak of $52.7 on May 10, 2021, during the broader cryptocurrency bull market. The token benefited from increased adoption of decentralized oracle services.
- 2026: NIBI recorded its all-time low of $0.004569 on January 16, 2026, representing a decline of approximately 99.56% from its peak. Meanwhile, LINK traded at $0.148183 at its lowest point in November 2017, but has since established higher support levels.
- Comparative Analysis: During the 2024-2026 market cycle, NIBI declined from $1.032 to $0.004569, experiencing substantial downward pressure. In contrast, LINK demonstrated relative resilience, trading within a range that maintained stronger support structures despite broader market corrections.
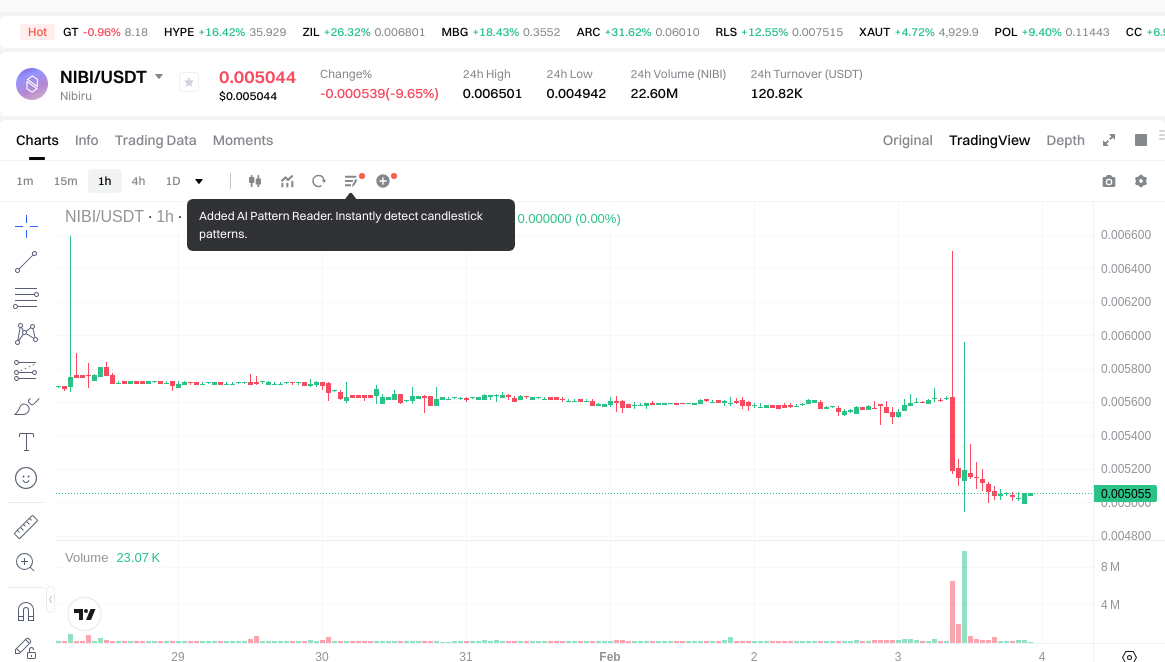
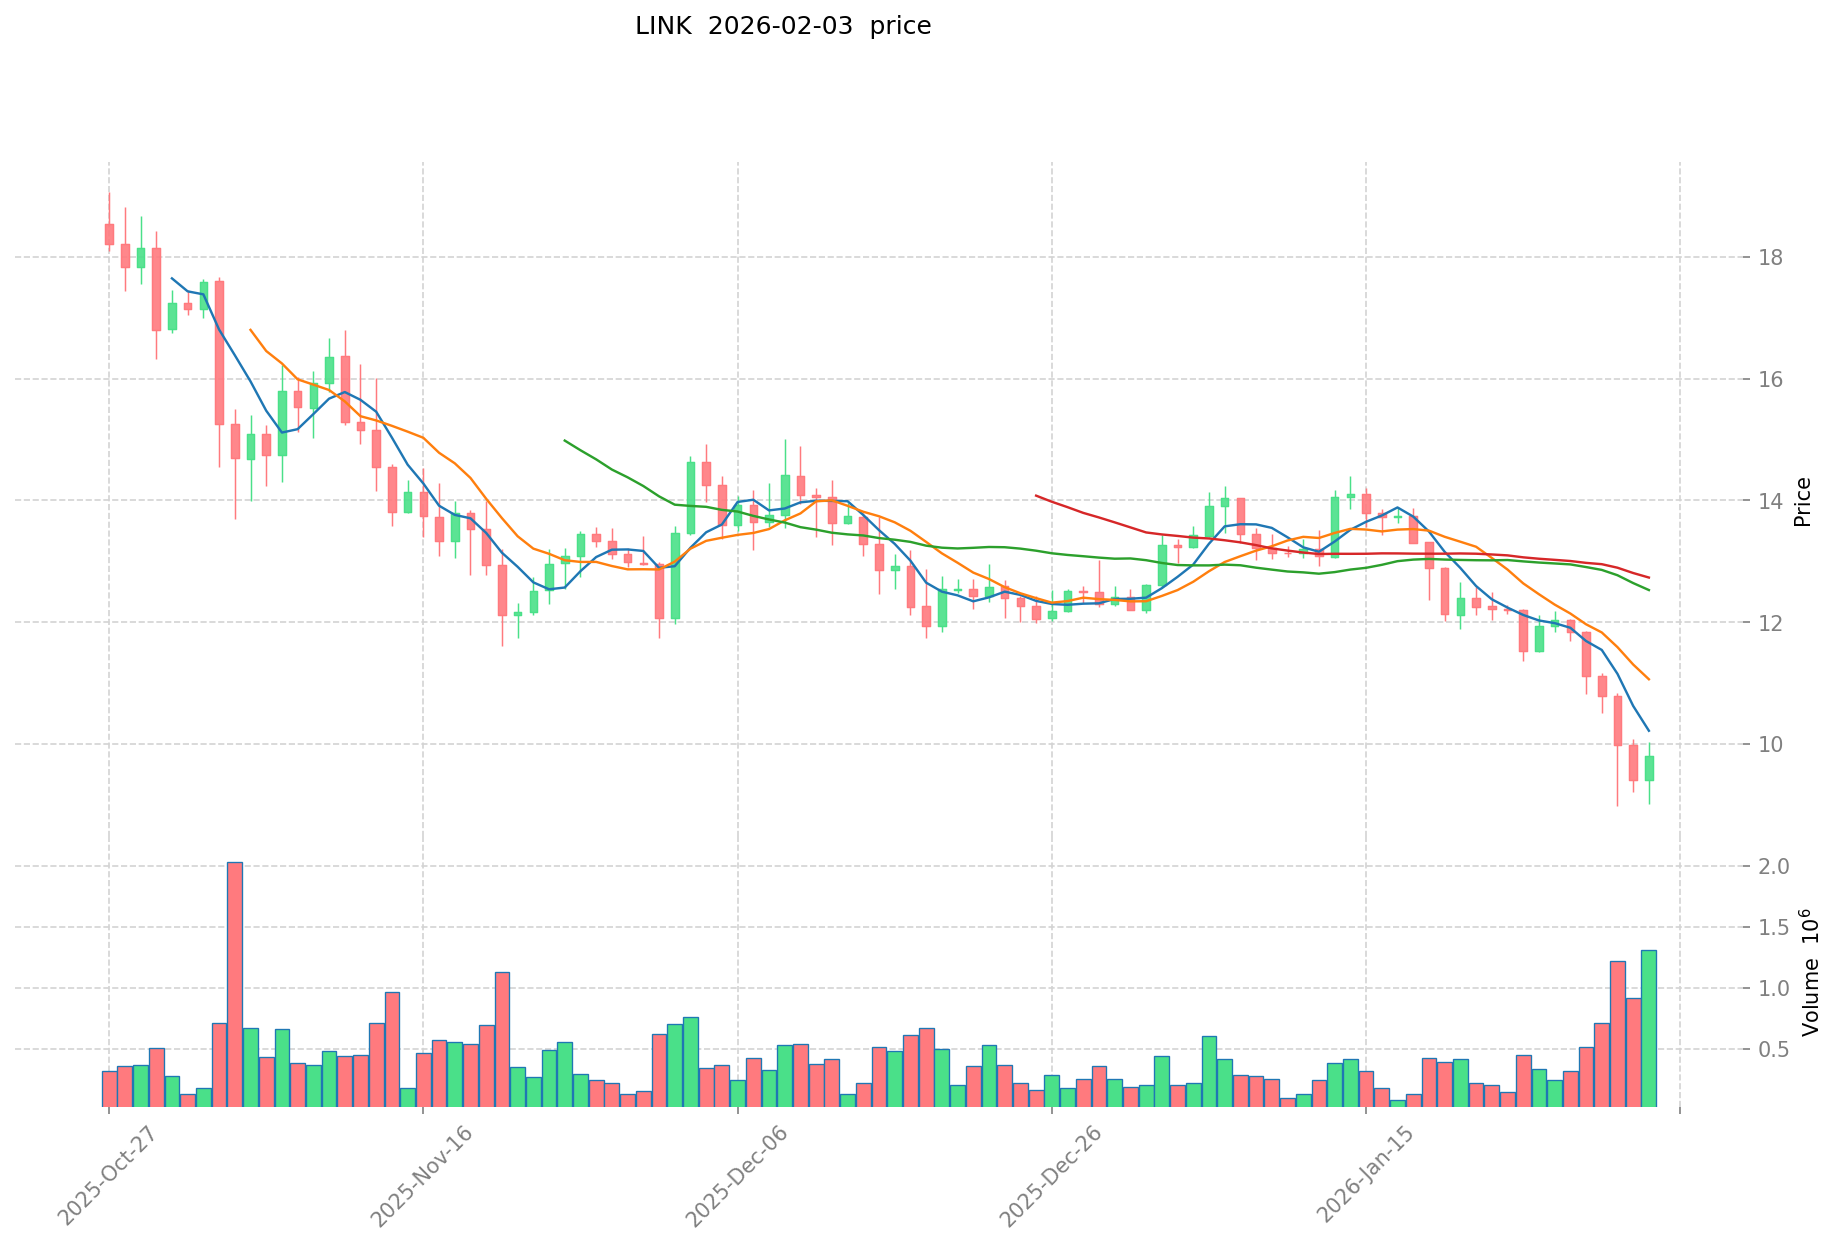
Current Market Conditions (February 3, 2026)
- NIBI Current Price: $0.005044
- LINK Current Price: $9.654
- 24-Hour Trading Volume: NIBI recorded $120,859.22 compared to LINK's $6,631,210.68, indicating significantly different liquidity levels.
- 24-Hour Price Change: NIBI decreased by 9.26%, while LINK showed a modest increase of 0.04%.
- Market Capitalization: NIBI stands at approximately $941,688, whereas LINK maintains a market cap of $6.84 billion, reflecting substantial differences in market presence.
- Market Sentiment Index (Fear & Greed Index): 17 (Extreme Fear), suggesting heightened caution among market participants.
View real-time prices:
- Check NIBI current price Market Price
- Check LINK current price Market Price
II. Core Factors Influencing NIBI vs LINK Investment Value
Supply Mechanism Comparison (Tokenomics)
The supply mechanisms of digital assets fundamentally shape their long-term value dynamics. While specific tokenomics details for NIBI and LINK are not detailed in available materials, general patterns in the crypto asset space suggest that supply structures—whether fixed-cap, deflationary, or inflationary—play a role in price cycle formation. Research on industrial linkages indicates that value capture efficiency varies across different economic structures, with mechanisms that balance domestic and export-oriented strategies showing resilience.
📌 Historical Pattern: Supply mechanism design can influence periodic price movements, though this relationship interacts with broader market and institutional factors.
Institutional Adoption and Market Application
-
Institutional Holdings: The degree of institutional preference between assets depends on factors including geographic proximity, cognitive alignment with investment frameworks, and social-institutional proximities that facilitate complex production and demand relationships.
-
Enterprise Adoption: Application scenarios in cross-border payments, settlements, and investment portfolios are influenced by multi-dimensional proximities. Geographic and cognitive proximities tend to have widespread impact, while social and institutional proximities affect more complex intermediate production linkages and mature final demand connections.
-
National Policy: Regulatory attitudes across jurisdictions vary, with technical trade barriers and anti-dumping measures potentially constraining cross-border asset linkages. Sanitary and phytosanitary measures may affect final market demand connections while having limited impact on intermediate product linkages.
Technology Development and Ecosystem Building
-
Technology Upgrades: The evolution of technical capabilities in blockchain assets follows patterns where geographic and cognitive proximities influence development trajectories. Path dependencies emerge from multi-dimensional proximity factors affecting industrial connections.
-
Ecosystem Comparison: DeFi, NFT, payment, and smart contract implementations show varying maturity levels. Production-oriented service capabilities and overall value-added capture efficiency represent potential growth directions, suggesting that assets with stronger service layer development may demonstrate competitive advantages.
Macroeconomic Environment and Market Cycles
-
Performance Under Inflation: Anti-inflationary attributes depend on structural characteristics including supply mechanisms, adoption breadth, and value capture efficiency. Assets integrated into diversified industrial strategies may exhibit different resilience patterns.
-
Macroeconomic Monetary Policy: Interest rates and dollar index movements influence crypto assets through channels including capital flows and risk appetite. The impact varies based on the asset's position within global production and investment networks.
-
Geopolitical Factors: Cross-border transaction demand and international developments affect assets differently based on their integration into regional and global economic linkages. Trade protection measures, including technical barriers and quarantine procedures, can constrain certain types of connections while leaving others relatively unaffected.
III. 2026-2031 Price Prediction: NIBI vs LINK
Short-term Forecast (2026)
- NIBI: Conservative $0.0036 - $0.0051 | Optimistic $0.0051 - $0.0056
- LINK: Conservative $5.04 - $9.69 | Optimistic $9.69 - $12.01
Medium-term Forecast (2028-2029)
- NIBI may enter a gradual growth phase, with estimated price range of $0.0042 - $0.0102
- LINK may enter a consolidation and expansion phase, with estimated price range of $6.59 - $15.25
- Key drivers: institutional capital inflows, ETF developments, ecosystem expansion
Long-term Forecast (2030-2031)
- NIBI: Base scenario $0.0071 - $0.0119 | Optimistic scenario $0.0079 - $0.0130
- LINK: Base scenario $8.45 - $14.09 | Optimistic scenario $10.87 - $19.87
Disclaimer
NIBI:
| Year | Predicted High Price | Predicted Average Price | Predicted Low Price | Price Change |
|---|---|---|---|---|
| 2026 | 0.0055605 | 0.005055 | 0.00358905 | 0 |
| 2027 | 0.006263145 | 0.00530775 | 0.0029192625 | 5 |
| 2028 | 0.00844675335 | 0.0057854475 | 0.0043969401 | 14 |
| 2029 | 0.01017602360775 | 0.007116100425 | 0.00419849925075 | 41 |
| 2030 | 0.011931565582597 | 0.008646062016375 | 0.007089770853427 | 71 |
| 2031 | 0.012963905387352 | 0.010288813799486 | 0.007922386625604 | 103 |
LINK:
| Year | Predicted High Price | Predicted Average Price | Predicted Low Price | Price Change |
|---|---|---|---|---|
| 2026 | 12.01312 | 9.688 | 5.03776 | 0 |
| 2027 | 11.8271104 | 10.85056 | 7.7038976 | 12 |
| 2028 | 14.513709056 | 11.3388352 | 9.07106816 | 17 |
| 2029 | 15.25300111104 | 12.926272128 | 6.59239878528 | 33 |
| 2030 | 19.8663876335232 | 14.08963661952 | 8.453781971712 | 45 |
| 2031 | 17.487352490317248 | 16.9780121265216 | 10.865927760973824 | 75 |
IV. Investment Strategy Comparison: NIBI vs LINK
Long-term vs Short-term Investment Strategies
-
NIBI: May appeal to investors with higher risk tolerance seeking early-stage blockchain infrastructure opportunities. The asset's current early development phase and significant price decline from historical peaks suggest positioning suited for speculative portfolios with extended time horizons and capacity to absorb substantial volatility.
-
LINK: May suit investors seeking exposure to established oracle network infrastructure with demonstrated institutional recognition. The asset's longer operational history since 2017 and maintenance of stronger support structures during market corrections suggest positioning for participants prioritizing relative stability within the crypto asset class.
Risk Management and Asset Allocation
-
Conservative Investors: A cautious approach might consider allocating minimal exposure to NIBI (0-5%) given its early stage and recent volatility, while maintaining modest LINK exposure (5-15%) as part of a diversified crypto allocation within a broader multi-asset portfolio.
-
Aggressive Investors: Risk-tolerant participants might explore higher allocations, potentially 10-20% to NIBI for speculative early-stage exposure, and 20-35% to LINK for established infrastructure participation, while maintaining awareness of concentration risks.
-
Hedging Tools: Risk management approaches may include stable asset allocations for liquidity preservation, derivative instruments where available for downside protection, and cross-asset diversification across different crypto sectors and traditional assets.
V. Potential Risk Comparison
Market Risks
-
NIBI: Trading at approximately 99.5% below its historical peak with limited liquidity ($120,859.22 in 24-hour volume as of February 3, 2026), the asset faces risks associated with price discovery in thin markets, potential for extended consolidation periods, and heightened sensitivity to broader market sentiment shifts.
-
LINK: While maintaining significantly higher liquidity ($6.63 million in 24-hour volume), the asset remains subject to crypto market cyclicality, correlation with broader digital asset trends, and potential for corrections during risk-off periods despite its relatively established position.
Technical Risks
-
NIBI: As a blockchain launched in 2024, the network may encounter challenges related to throughput scaling under increased adoption, maintaining security guarantees during growth phases, and establishing stable validator participation over extended periods.
-
LINK: Oracle network architecture presents considerations around data source reliability, node operator distribution patterns, and potential vulnerabilities in smart contract integrations that depend on external data feeds.
Regulatory Risks
- Both assets face evolving regulatory frameworks across jurisdictions that may affect operational parameters, market access, and institutional participation patterns. Cross-border transaction dynamics and compliance requirements may influence adoption trajectories differently based on each asset's specific use cases and network characteristics.
VI. Conclusion: Which Is the Better Buy?
📌 Investment Value Summary
-
NIBI Characteristics: Early-stage L1 blockchain infrastructure launched in 2024, currently trading near historical lows with limited liquidity, presenting high-risk/high-uncertainty positioning for participants with speculative mandates and extended time horizons.
-
LINK Characteristics: Established oracle network infrastructure since 2017, maintaining substantially higher market capitalization ($6.84 billion) and liquidity, demonstrating relative resilience during market corrections with recognized institutional awareness.
✅ Investment Considerations
-
Novice Participants: May prioritize understanding fundamental crypto asset dynamics, market cycle patterns, and risk management principles before allocating capital. Starting with smaller positions in more established assets with higher liquidity could facilitate learning while managing downside exposure.
-
Experienced Participants: Might evaluate positioning based on portfolio objectives, risk tolerance, and market cycle views. Balancing exposure between established infrastructure (LINK) and early-stage opportunities (NIBI) according to individual risk parameters and diversification strategies.
-
Institutional Participants: Could assess allocations through frameworks evaluating liquidity requirements, counterparty considerations, regulatory alignment, and strategic portfolio positioning within broader digital asset mandates.
⚠️ Risk Disclosure: Cryptocurrency markets exhibit extreme volatility and uncertainty. This analysis does not constitute investment advice, financial guidance, or recommendations for specific actions. Participants should conduct independent research, consult qualified advisors, and only allocate capital they can afford to lose entirely.
VII. FAQ
Q1: What is the main difference between NIBI and LINK in terms of use cases?
NIBI is an L1 blockchain infrastructure platform focused on developer and user experience, while LINK is a decentralized oracle network connecting smart contracts to external data sources. NIBI aims to provide superior throughput and security for smart contract ecosystems, whereas LINK serves as a bridge between blockchain applications and off-chain data, enabling smart contracts to interact with real-world information, APIs, and payment systems.
Q2: Why has NIBI experienced such a significant price decline since its launch?
NIBI has declined approximately 99.56% from its March 2024 peak of $1.032 to its January 2026 low of $0.004569. This steep correction reflects multiple factors including its early-stage development phase, limited liquidity with 24-hour trading volume of only $120,859.22, broader crypto market downturn during 2024-2026, and the typical high volatility associated with newly launched blockchain projects that have not yet established substantial adoption or proven long-term viability.
Q3: Which asset offers better liquidity for trading purposes?
LINK demonstrates substantially superior liquidity compared to NIBI. As of February 3, 2026, LINK recorded 24-hour trading volume of $6,631,210.68 versus NIBI's $120,859.22—approximately 55 times higher. This liquidity differential means LINK offers easier entry and exit points, tighter bid-ask spreads, and reduced slippage risk for both retail and institutional participants, while NIBI's thin markets may present challenges for larger position sizing or rapid execution.
Q4: How do institutional adoption levels compare between these two assets?
LINK has achieved significantly broader institutional recognition since its 2017 launch, benefiting from established partnerships, integration with major blockchain ecosystems, and proven use cases in decentralized finance. NIBI, launched in 2024, remains in early institutional adoption phases with limited track record. The market capitalization differential—$6.84 billion for LINK versus $941,688 for NIBI—reflects this substantial gap in institutional participation and overall market confidence.
Q5: What are the primary risks specific to each asset?
NIBI faces risks associated with early-stage blockchain development including unproven scalability under high adoption, limited liquidity creating price volatility, and uncertainty around long-term network viability. LINK encounters risks related to oracle network security, dependency on node operator reliability, smart contract integration vulnerabilities, and competition from emerging oracle solutions. Both assets face regulatory uncertainty and crypto market cyclicality, though NIBI's early stage amplifies these general market risks.
Q6: Which asset is more suitable for conservative investors?
Neither asset represents a conservative investment in traditional terms, as both belong to the high-volatility cryptocurrency asset class. However, LINK demonstrates relatively more conservative characteristics with established market presence, higher liquidity, proven use cases, and stronger support structures during market corrections. A conservative approach might allocate minimal exposure (5-15%) to LINK within a diversified portfolio, while maintaining minimal or zero allocation to NIBI given its extreme volatility and early development stage.
Q7: How do the 2030 price predictions compare between NIBI and LINK?
According to base scenario projections for 2030, NIBI is predicted to trade between $0.0071 (low) and $0.0119 (high) with an average of $0.008646, representing potential 71% growth from current levels. LINK is projected between $8.45 (low) and $19.87 (optimistic high) with a base average of $14.09, representing approximately 45% growth. These predictions carry substantial uncertainty and should not be interpreted as guaranteed outcomes, particularly given crypto market unpredictability and the speculative nature of long-term forecasting.
Q8: What portfolio allocation strategy makes sense for balancing NIBI and LINK exposure?
Portfolio allocation depends on individual risk tolerance and investment objectives. Conservative participants might consider 5-15% LINK allocation with 0-5% or zero NIBI exposure within a broader diversified portfolio. Aggressive risk-tolerant participants could explore 20-35% LINK allocation combined with 10-20% NIBI positioning for speculative early-stage exposure. All participants should implement proper risk management including stop-loss levels, position sizing appropriate to total portfolio value, and maintaining sufficient liquidity reserves outside crypto markets.
Share
Content
Introduction: NIBI vs LINK Investment Comparison
I. Historical Price Comparison and Current Market Status
II. Core Factors Influencing NIBI vs LINK Investment Value
III. 2026-2031 Price Prediction: NIBI vs LINK
IV. Investment Strategy Comparison: NIBI vs LINK
V. Potential Risk Comparison
VI. Conclusion: Which Is the Better Buy?
VII. FAQ
How to Buy Cryptocurrency


Trending Cryptocurrencies


XZXX: A Comprehensive Guide to the BRC-20 Meme Token in 2025

Survey Note: Detailed Analysis of the Best AI in 2025

Detailed Analysis of the Best 10 GameFi Projects to Play and Earn in 2025

Kaspa’s Journey: From BlockDAG Innovation to Market Buzz
Best Crypto Wallets 2025: How to Choose and Secure Your Digital Assets
Popular GameFi Games in 2025
Comprehensive Guide to Cryptocurrency Trading Platform Registration Bonuses
Isamu Kaneko’s Connection to Bitcoin | The P2P Philosophy Legacy of the Winny Developer
Free Money for Registration in App: Crypto Bonus Guide
How to Create and Profitably Sell NFTs: The Complete Guide

Understanding GameFi: How to Profit from Play-to-Earn