This comprehensive guide compares NODL and FLOW, two distinct blockchain development platforms serving different market segments. NODL operates as a smartphone-driven IoT network connecting physical infrastructure to Web3 via Bluetooth Low Energy technology, currently trading at $0.0003115 with $20,006 daily volume. FLOW functions as a mainstream-adoption blockchain platform for gaming and digital assets, priced at $0.04321 with $576,465 daily volume. The analysis examines price history showing FLOW's 99% decline from $42.4 peak and NODL's drops from $0.0200, alongside tokenomics, institutional adoption, and technical ecosystem development. Investment strategies differentiate between conservative and aggressive allocators, with FLOW recommended for risk-averse investors seeking higher liquidity, and NODL appealing to those tolerating volatility for emerging IoT exposure. Price forecasts span 2026-2031 periods, while risk assessments address market, technical, and regulatory considerations for both tokens on G
Introduction: Investment Comparison Between NODL and FLOW
In the cryptocurrency market, the comparison between NODL vs FLOW has consistently been a topic that investors cannot avoid. Both assets demonstrate notable differences in market cap ranking, application scenarios, and price performance, while representing distinct positioning within the crypto asset landscape.
Nodle Network (NODL): Launched as a smartphone-driven decentralized network, it has gained market recognition through its unique approach of connecting the physical world to Web3 via edge nodes using Bluetooth Low Energy (BLE) technology.
Flow (FLOW): Introduced in September 2020 at $0.1, it has been regarded as a platform for next-generation games and digital assets, serving as one of the blockchain networks designed specifically for mainstream adoption with usability improvements integrated into the protocol layer.
This article will comprehensively analyze the investment value comparison of NODL vs FLOW, focusing on historical price trends, supply mechanisms, institutional adoption, technical ecosystems, and future projections, attempting to answer the question that concerns investors most:
"Which is the better buy right now?"
I. Price History Comparison and Current Market Status
NODL (Coin A) and FLOW (Coin B) Historical Price Trends
- 2022: NODL experienced significant volatility, with its price reaching a peak of $0.02001883 in August 2022 before entering a prolonged decline.
- 2021: FLOW was impacted by the NFT boom and mainstream adoption initiatives, with its price reaching an all-time high of $42.4 in April 2021.
- Comparative analysis: During the 2021-2026 market cycle, NODL declined from its high of $0.02001883 to a low of $0.00008563 in December 2025, representing a substantial decrease. In contrast, FLOW fell from its peak of $42.4 to a low of $0.03632249 in February 2026, marking a decline of over 99% from its all-time high.
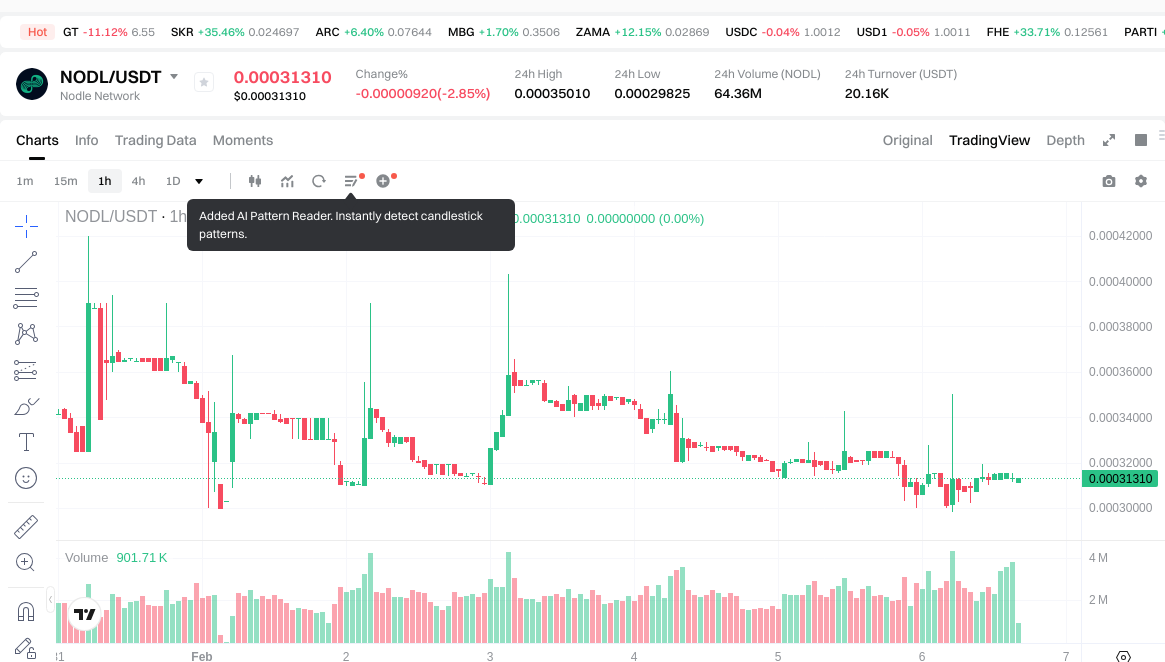
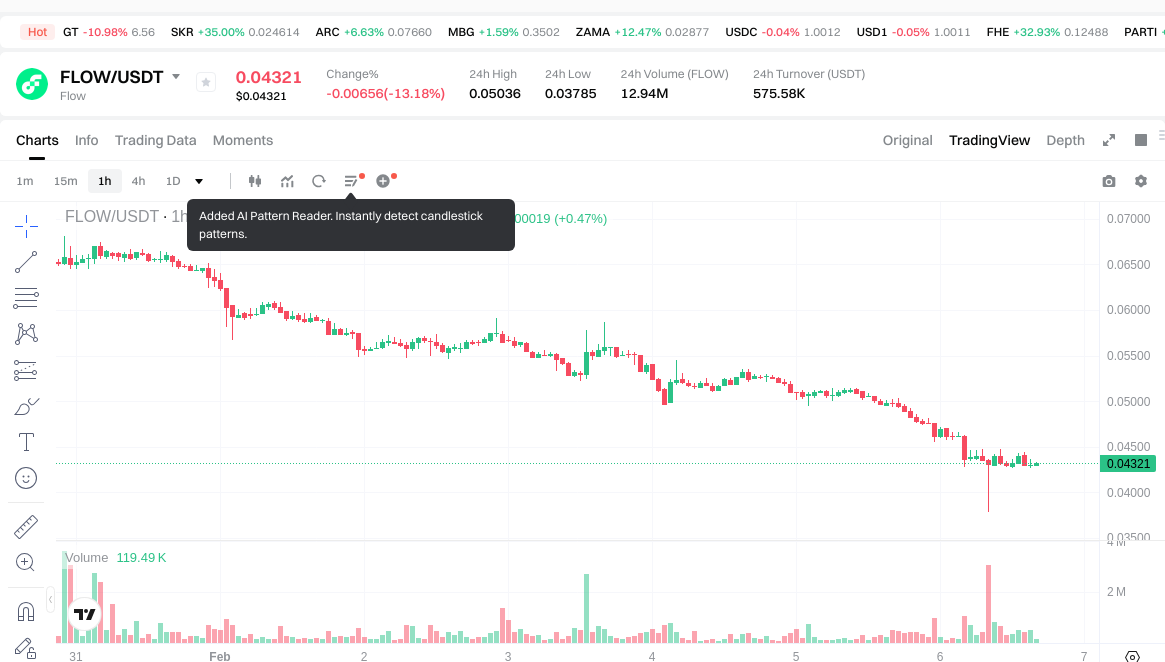
Current Market Conditions (2026-02-06)
- NODL current price: $0.0003115
- FLOW current price: $0.04321
- 24-hour trading volume: NODL $20,006.56 vs FLOW $576,465.14
- Market Sentiment Index (Fear & Greed Index): 9 (Extreme Fear)
View real-time prices:
II. Core Factors Influencing NODL vs FLOW Investment Value
Supply Mechanism Comparison (Tokenomics)
- NODL: Information on NODL's supply mechanism is not available in the provided materials.
- FLOW: Details regarding FLOW's supply structure are not specified in the reference sources.
- 📌 Historical Pattern: Supply mechanisms can influence price cycles through scarcity dynamics and inflation control, though specific mechanisms for these tokens require additional research.
Institutional Adoption and Market Application
- Institutional Holdings: Comparative data on institutional preference between NODL and FLOW is not available in the provided materials.
- Enterprise Adoption: Specific applications of NODL and FLOW in cross-border payments, settlement, or investment portfolios are not documented in the reference sources.
- National Policies: Regulatory attitudes toward these specific tokens across different jurisdictions are not covered in the available materials.
Technological Development and Ecosystem Building
- NODL Technical Upgrades: Information regarding NODL's technological roadmap and potential impacts is not provided in the reference materials.
- FLOW Technical Development: Details about FLOW's technical evolution and ecosystem developments are not available in the provided sources.
- Ecosystem Comparison: Comparative analysis of DeFi, NFT, payment systems, and smart contract implementations for these tokens requires additional research beyond the provided materials.
Macroeconomic Environment and Market Cycles
- Performance Under Inflation: The reference materials suggest that macroeconomic factors, capital flows, and market structure serve as primary drivers for crypto asset valuations, though specific anti-inflation properties of NODL versus FLOW are not detailed.
- Macroeconomic Monetary Policy: Interest rates and dollar index movements can impact crypto assets generally, but specific effects on these tokens require further analysis.
- Geopolitical Factors: Cross-border transaction demand and international situations may influence crypto adoption broadly, though specific impacts on NODL and FLOW are not documented in the available materials.
III. 2026-2031 Price Forecast: NODL vs FLOW
Short-term Forecast (2026)
- NODL: Conservative $0.000241087 - $0.0003131 | Optimistic $0.0003131 - $0.00043834
- FLOW: Conservative $0.0246354 - $0.04322 | Optimistic $0.04322 - $0.0622368
Mid-term Forecast (2028-2029)
- NODL may enter a gradual accumulation phase, with estimated price range of $0.00033504831 - $0.0005701597965
- FLOW may enter a moderate growth phase, with estimated price range of $0.05004979728 - $0.08460799064
- Key drivers: institutional capital inflows, ETF developments, ecosystem expansion
Long-term Forecast (2030-2031)
- NODL: Baseline scenario $0.000414180366457 - $0.00051133378575 | Optimistic scenario $0.00051133378575 - $0.000904344933477
- FLOW: Baseline scenario $0.040529067293483 - $0.0731769744398 | Optimistic scenario $0.0731769744398 - $0.087940429033029
View detailed price predictions for NODL and FLOW
Disclaimer
NODL:
| Year |
Predicted High Price |
Predicted Average Price |
Predicted Low Price |
Price Change |
| 2026 |
0.00043834 |
0.0003131 |
0.000241087 |
0 |
| 2027 |
0.000394506 |
0.00037572 |
0.0003080904 |
20 |
| 2028 |
0.00051990255 |
0.000385113 |
0.00033504831 |
23 |
| 2029 |
0.0005701597965 |
0.000452507775 |
0.00033938083125 |
45 |
| 2030 |
0.000710753962192 |
0.00051133378575 |
0.000414180366457 |
64 |
| 2031 |
0.000904344933477 |
0.000611043873971 |
0.000439951589259 |
96 |
FLOW:
| Year |
Predicted High Price |
Predicted Average Price |
Predicted Low Price |
Price Change |
| 2026 |
0.0622368 |
0.04322 |
0.0246354 |
0 |
| 2027 |
0.066437784 |
0.0527284 |
0.034800744 |
22 |
| 2028 |
0.08460799064 |
0.059583092 |
0.05004979728 |
37 |
| 2029 |
0.0742584075596 |
0.07209554132 |
0.0583973884692 |
66 |
| 2030 |
0.079762902139382 |
0.0731769744398 |
0.048296803130268 |
69 |
| 2031 |
0.087940429033029 |
0.076469938289591 |
0.040529067293483 |
76 |
IV. Investment Strategy Comparison: NODL vs FLOW
Long-term vs Short-term Investment Strategies
-
NODL: May appeal to investors seeking exposure to IoT infrastructure and decentralized physical networks, particularly those interested in edge computing applications and Web3 connectivity solutions. The token's positioning in smartphone-driven networks suggests potential for long-term ecosystem development.
-
FLOW: May attract investors focused on digital asset platforms, NFT infrastructure, and blockchain solutions designed for mainstream adoption. The platform's emphasis on usability improvements at the protocol layer positions it for applications in gaming and digital collectibles.
Risk Management and Asset Allocation
-
Conservative Investors: A balanced approach might consider NODL 30-40% vs FLOW 60-70%, reflecting FLOW's more established market presence and historical adoption patterns.
-
Aggressive Investors: A growth-oriented allocation could involve NODL 50-60% vs FLOW 40-50%, emphasizing higher risk tolerance for emerging IoT network infrastructure.
-
Hedging Tools: Stablecoin reserves (20-30% of portfolio), options strategies for downside protection, and cross-asset diversification across multiple blockchain ecosystems can help manage volatility exposure.
V. Potential Risk Comparison
Market Risk
-
NODL: Trading volume of $20,006.56 indicates relatively limited liquidity, which may result in higher price volatility and potential challenges with position entry and exit. The token's substantial decline from historical peaks suggests sensitivity to broader market cycles.
-
FLOW: Despite higher trading volume of $576,465.14, the token has experienced significant decline from its all-time high, reflecting vulnerability to market sentiment shifts and sector-specific headwinds affecting blockchain gaming and NFT platforms.
Technical Risk
-
NODL: As an IoT-focused network utilizing Bluetooth Low Energy technology, scalability considerations and network stability depend on smartphone adoption rates and edge node distribution. Technical documentation and upgrade paths require ongoing evaluation.
-
FLOW: Platform-specific considerations include smart contract security, network throughput capacity, and competition from alternative Layer 1 solutions. Protocol-level implementations require continuous monitoring for potential vulnerabilities.
Regulatory Risk
- Both assets face evolving regulatory frameworks across different jurisdictions. NODL's focus on physical-world connectivity may encounter IoT-specific compliance requirements, while FLOW's positioning in gaming and digital assets could be subject to securities regulations and consumer protection policies. Cross-border operational considerations remain relevant for both tokens.
VI. Conclusion: Which Is the Better Buy?
📌 Investment Value Summary:
-
NODL Advantages: Represents emerging IoT infrastructure with potential for Web3 connectivity solutions; positions holders in decentralized physical network development; offers exposure to smartphone-driven edge computing applications.
-
FLOW Advantages: Established presence in digital asset platforms with focus on mainstream usability; demonstrated ecosystem development in gaming and NFT sectors; protocol-level design considerations for improved user experience.
✅ Investment Recommendations:
-
Novice Investors: Consider starting with smaller position sizes in either asset, prioritizing fundamental research and gradual accumulation strategies. Dollar-cost averaging approaches may help mitigate timing risk in the current market environment characterized by extreme fear sentiment.
-
Experienced Investors: May evaluate risk-adjusted opportunities based on portfolio diversification goals, considering correlation with existing holdings and sector exposure preferences. Technical analysis and on-chain metrics can supplement fundamental assessment.
-
Institutional Investors: Comprehensive due diligence including custody solutions, liquidity analysis, and regulatory compliance frameworks should precede any allocation decisions. Portfolio construction may benefit from professional risk management protocols and periodic rebalancing strategies.
⚠️ Risk Disclaimer: Cryptocurrency markets exhibit substantial volatility, and past performance does not indicate future results. This content does not constitute investment advice, financial guidance, or recommendations for buying or selling any assets. Investors should conduct independent research and consult qualified financial professionals before making investment decisions.
VII. FAQ
Q1: What are the primary differences in use cases between NODL and FLOW?
NODL focuses on decentralized IoT infrastructure connecting the physical world to Web3 through smartphone-driven edge nodes using Bluetooth Low Energy (BLE) technology, while FLOW serves as a blockchain platform designed for next-generation games, digital assets, and mainstream adoption with usability improvements at the protocol layer. NODL's primary application centers on edge computing and physical-world connectivity through distributed smartphone networks, making it particularly relevant for IoT data collection and transmission. In contrast, FLOW's ecosystem emphasizes digital collectibles, blockchain gaming, and NFT infrastructure, with protocol-level optimizations aimed at reducing complexity for mainstream users. These fundamentally different technological approaches and target markets result in distinct risk-reward profiles and ecosystem development trajectories.
Q2: How do the current trading volumes of NODL and FLOW reflect their market liquidity and investment risks?
NODL's 24-hour trading volume of $20,006.56 indicates significantly lower liquidity compared to FLOW's $576,465.14, suggesting approximately 29x difference in market activity. This substantial liquidity disparity means NODL investors face higher slippage risks, potentially wider bid-ask spreads, and greater difficulty executing large position entries or exits without impacting market prices. Lower trading volumes typically correlate with increased price volatility and reduced institutional participation, as larger capital deployments become more challenging without causing substantial price movements. For retail investors, FLOW's higher liquidity provides more stable pricing environments and better execution quality, while NODL's limited volume may present opportunities for higher returns alongside elevated risks of sudden price swings during periods of reduced market activity.
Q3: What do the price decline percentages from all-time highs tell us about recovery potential?
NODL declined from its August 2022 peak of $0.02001883 to December 2025 low of $0.00008563, while FLOW dropped from its April 2021 high of $42.4 to February 2026 low of $0.03632249—both experiencing substantial corrections exceeding 99% from historical peaks. These severe drawdowns reflect broader cryptocurrency market cycles and sector-specific challenges affecting both IoT infrastructure tokens and blockchain gaming platforms. However, the magnitude of decline does not inherently indicate recovery potential, as fundamental factors including technological development, ecosystem adoption, competitive positioning, and macroeconomic conditions ultimately determine future price trajectories. Investors should evaluate whether current valuations reflect fair value based on utility, network effects, and growth prospects rather than relying on historical price comparisons as indicators of recovery likelihood.
Q4: How should investors approach portfolio allocation between NODL and FLOW given current market sentiment?
With the Fear & Greed Index at 9 (Extreme Fear) as of February 6, 2026, market conditions suggest widespread pessimism that may present accumulation opportunities for long-term investors with appropriate risk tolerance. Conservative allocation strategies might favor FLOW 60-70% versus NODL 30-40% due to FLOW's higher liquidity, more established ecosystem, and broader market recognition. Aggressive investors with higher risk appetite and longer time horizons might consider NODL 50-60% versus FLOW 40-50%, positioning for potential outsized returns from emerging IoT infrastructure development. Both approaches should incorporate stablecoin reserves (20-30% of crypto portfolio) for capital preservation and opportunistic deployment during further market dislocations. Dollar-cost averaging strategies can help mitigate timing risks during periods of extreme sentiment, allowing investors to accumulate positions gradually rather than attempting to identify precise market bottoms.
Q5: What technological factors should investors monitor when evaluating NODL versus FLOW?
For NODL, critical technological considerations include smartphone adoption rates, edge node distribution density, network scalability as IoT device connections increase, and the effectiveness of Bluetooth Low Energy technology for decentralized data transmission. Investors should monitor development milestones related to network coverage expansion, partnership announcements with device manufacturers, and real-world use case implementations demonstrating practical utility. For FLOW, key technical factors encompass smart contract security audits, transaction throughput capacity compared to competing Layer 1 solutions, developer ecosystem growth metrics, and successful deployment of mainstream gaming or NFT applications. Both tokens require ongoing evaluation of protocol upgrades, competitive positioning against alternative infrastructure solutions, and evidence of sustained technological innovation that differentiates them within their respective market segments.
Q6: How do macroeconomic conditions differentially impact NODL and FLOW investment prospects?
Macroeconomic factors including interest rates, inflation trends, and global liquidity conditions affect cryptocurrency valuations broadly, but NODL and FLOW may experience different sensitivities based on their market positioning. NODL's focus on IoT infrastructure suggests potential correlation with technology sector capital expenditures, enterprise digitalization initiatives, and industrial adoption cycles that may be influenced by economic growth rates and business investment confidence. FLOW's positioning in gaming and digital assets may exhibit stronger correlation with consumer discretionary spending, entertainment sector health, and mainstream adoption trends that fluctuate with disposable income levels and risk appetite. During periods of monetary tightening and reduced liquidity, both assets face downward pressure, but FLOW's higher liquidity and more established market presence may provide relatively better price stability, while NODL's emerging status could result in amplified volatility during macroeconomic stress periods.
Q7: What regulatory considerations should investors evaluate for NODL and FLOW exposure?
NODL's decentralized IoT network may encounter regulatory scrutiny related to data privacy, telecommunications compliance, and IoT device standards across different jurisdictions, particularly regarding data collection practices and cross-border information transmission. FLOW's focus on gaming and digital assets potentially exposes it to securities regulations if certain NFTs or in-game assets are classified as investment contracts, consumer protection policies governing digital collectibles, and anti-money laundering requirements applicable to blockchain platforms facilitating value transfer. Both tokens face evolving cryptocurrency taxation policies, reporting requirements, and potential restrictions on trading or custody services in various markets. Investors should monitor regulatory developments in their specific jurisdictions, consider geographic diversification of operational exposure, and evaluate whether the projects maintain proactive compliance frameworks and legal counsel to navigate changing regulatory landscapes.
Q8: What role should historical price forecasts play in NODL versus FLOW investment decisions?
Price forecasts presented in the analysis—such as NODL's projected range of $0.000241087 - $0.00043834 for 2026 and FLOW's $0.0246354 - $0.0622368—represent theoretical scenarios based on historical patterns, market cycle analysis, and assumption-driven modeling rather than guaranteed outcomes. These projections should serve as reference frameworks for understanding potential price trajectories under different conditions rather than deterministic predictions. Investors should recognize that cryptocurrency markets exhibit substantial unpredictability influenced by technological developments, competitive dynamics, regulatory changes, and macroeconomic shifts that may not align with historical patterns. More valuable than specific price targets are the underlying analytical frameworks examining supply dynamics, adoption metrics, ecosystem development, and fundamental value drivers. Investment decisions should prioritize thorough due diligence on project fundamentals, risk management protocols, and portfolio construction principles rather than reliance on price forecasts as primary decision-making criteria.
* The information is not intended to be and does not constitute financial advice or any other recommendation of any sort offered or endorsed by Gate.