This comprehensive investment comparison analyzes SDN (Shiden Network) versus BAT (Basic Attention Token) across multiple dimensions critical to cryptocurrency investors. SDN operates as a multi-chain decentralized application layer on Kusama Network supporting DeFi and NFT ecosystems, while BAT functions within digital advertising through the Brave browser platform. The analysis examines historical price performance, with SDN declining 99.84% from $8.36 peak and BAT declining 93.75% from $1.90 peak, alongside current market conditions showing SDN at $0.01306 and BAT at $0.1187. Investment strategies differentiate between conservative investors favoring BAT's established 2017 history and higher liquidity, versus aggressive investors tolerating SDN's infrastructure speculation. Price forecasts through 2031 project divergent trajectories reflecting different maturity levels and technical risk profiles. The guide provides institutional and novice investor frameworks while addressing regulatory risks, technical c
Introduction: SDN vs BAT Investment Comparison
In the cryptocurrency market, the comparison between SDN vs BAT has consistently been a topic that investors cannot avoid. The two not only show significant differences in market cap ranking, application scenarios, and price performance, but also represent different crypto asset positioning.
SDN (ShidenNetwork): Launched in 2021, it has gained market recognition as a multi-chain decentralized application layer on Kusama Network, supporting Ethereum Virtual Machine, WebAssembly, and Layer2 solutions. The platform enables various applications including DeFi and NFT.
BAT (BasicAttentionToken): Since its launch in 2017, it has been positioned as a digital asset for circulation between advertisers and users, addressing advertising display and user incentive issues in browsers through the Brave browser ecosystem.
This article will provide a comprehensive analysis of the investment value comparison between SDN vs BAT, focusing on historical price trends, supply mechanisms, institutional adoption, technical ecosystems, and future predictions, attempting to answer the question that investors care about most:
"Which is the better buy right now?"
I. Historical Price Comparison and Current Market Status
Historical Price Trends of SDN (Coin A) and BAT (Coin B)
- 2021: SDN reached its all-time high of $8.36 in September 2021, during a period of broader market enthusiasm for multi-chain infrastructure projects.
- 2017: BAT launched with an initial token sale price of $0.035998 and subsequently reached its all-time high of $1.90 in November 2021, benefiting from growing adoption of the Brave browser ecosystem.
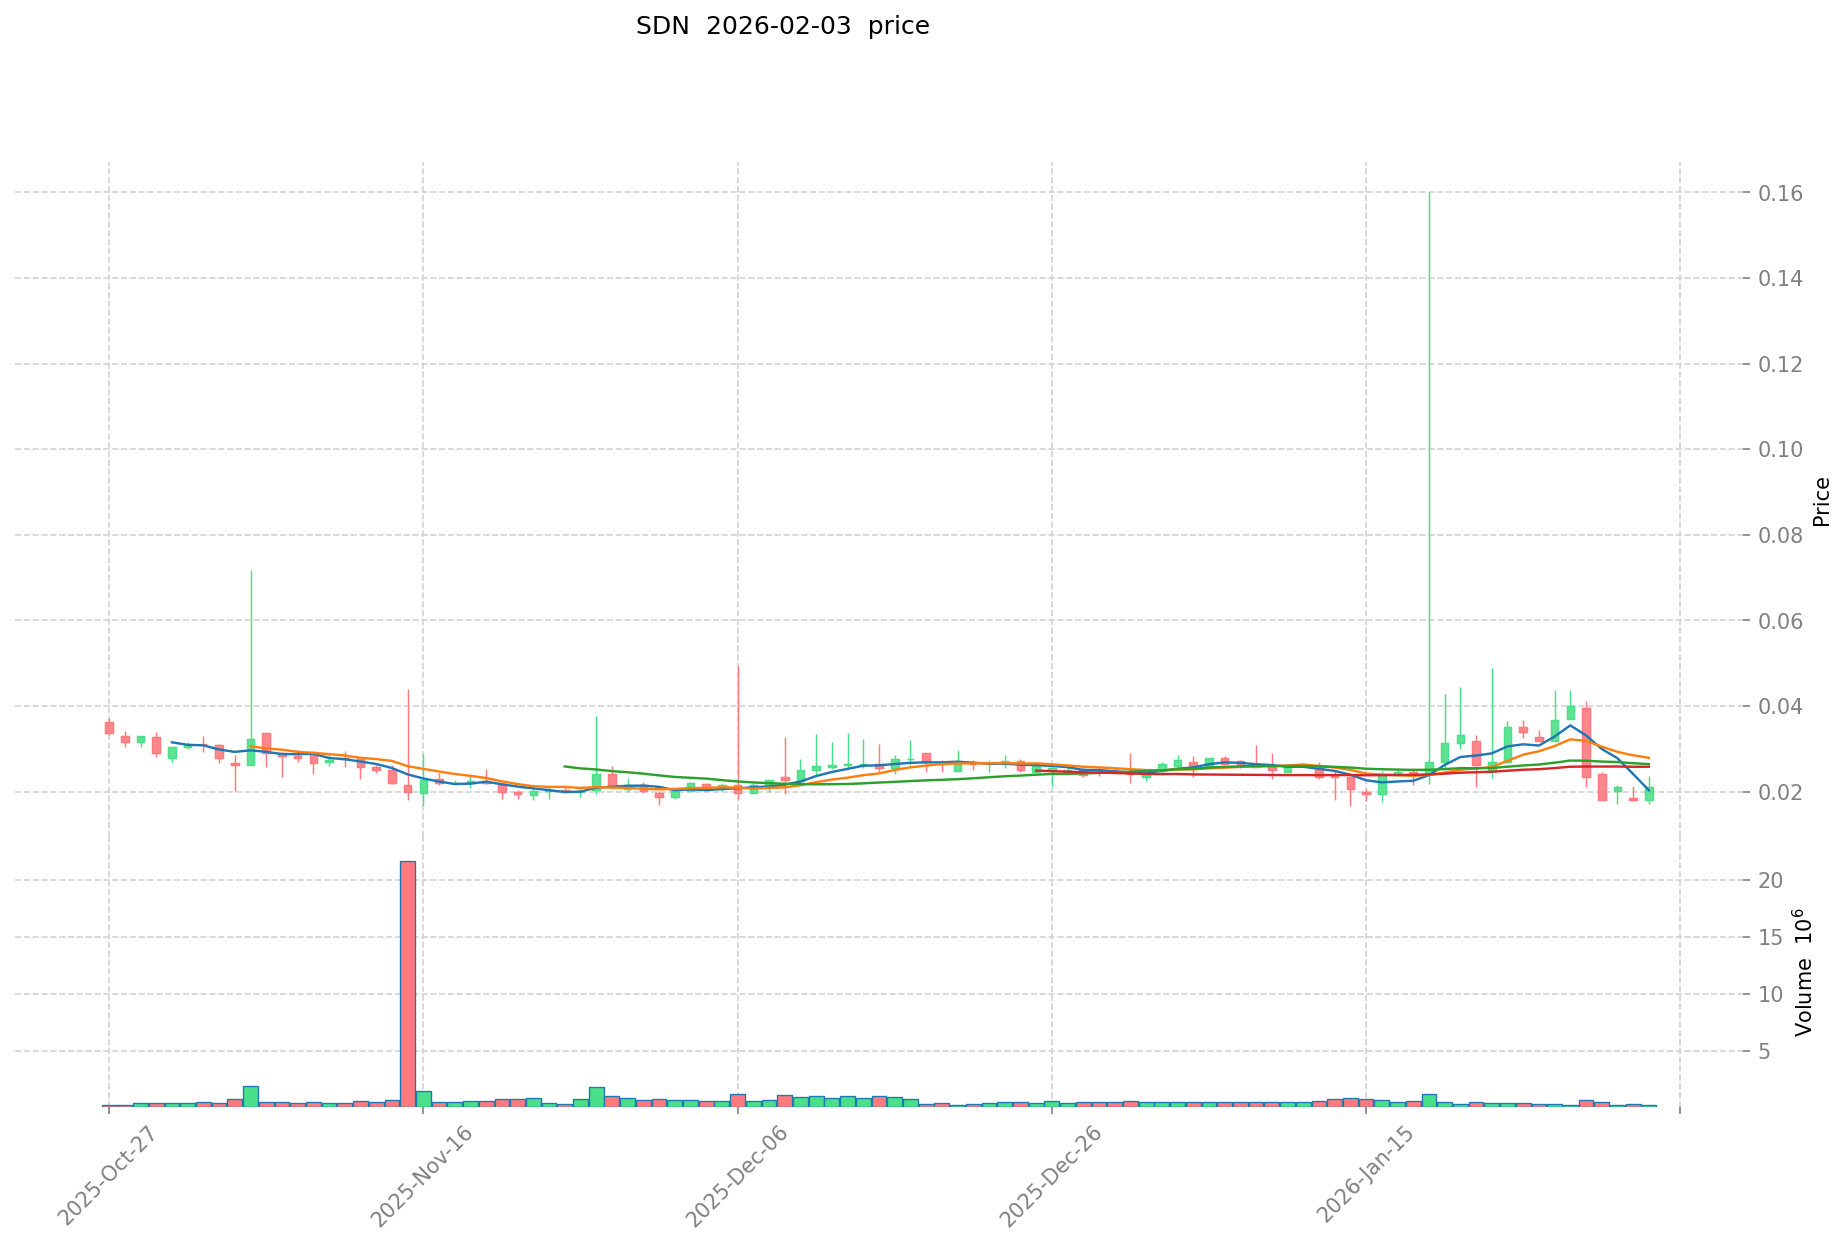
- Comparative analysis: During the 2021-2026 market cycle, SDN declined from its peak of $8.36 to a low of $0.01412926 (recorded on February 3, 2026), representing a significant correction. BAT, meanwhile, declined from $1.90 to $0.072394, showing a similar downward trajectory but with different percentage declines.
Current Market Status (February 4, 2026)
- SDN current price: $0.01306
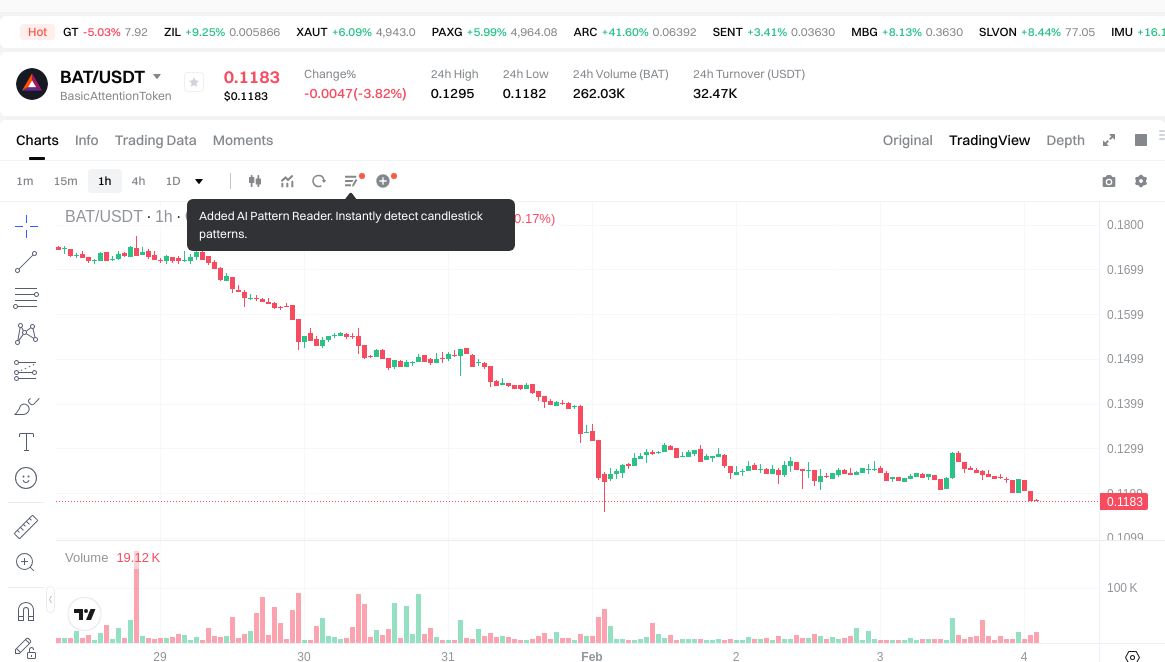
- BAT current price: $0.1187
- 24-hour trading volume: SDN $5,413.01 vs BAT $32,421.45
- Market sentiment index (Fear & Greed Index): 17 (Extreme Fear)
View real-time prices:
II. Core Factors Influencing SDN vs BAT Investment Value
Supply Mechanism Comparison (Tokenomics)
-
SDN: The reference materials do not provide specific information regarding SDN's supply mechanism. In general contexts, software-defined networking (SDN) represents a technological approach characterized by separation of control and forwarding planes, centralized control, and open interfaces, which may influence infrastructure investment considerations rather than token supply dynamics.
-
BAT: The reference materials focus on BAT (Baidu, Alibaba, Tencent) as internet enterprises rather than cryptographic assets with tokenomics. These entities demonstrate value through market influence and resource integration capabilities within the industrial internet sector.
-
📌 Historical Patterns: The materials emphasize that for SDN technology, core investment value derives from flexibility advantages and cost-effectiveness. SDN's control-forwarding separation architecture offers potential operational expenditure reductions, while BAT's competitive positioning stems from customer demand identification and product line expansion capabilities.
Institutional Adoption and Market Application
-
Institutional Holdings: The reference materials indicate that both SDN infrastructure investments and BAT platform developments attract attention from financial institutions and telecom operators, though specific comparative holding data is not available.
-
Enterprise Adoption: SDN technology finds application in data center infrastructure, cloud computing platforms, and network automation. Major financial institutions have implemented SDN-based architectures for multi-cloud environments. BAT enterprises demonstrate application scope across internet services, though cross-border payment or settlement-specific implementations are not detailed in the provided materials.
-
Policy Environment: The materials reference regulatory guidance for internet enterprises regarding social responsibility and platform governance, though comparative regulatory attitudes toward SDN versus BAT as distinct investment categories are not specified.
Technology Development and Ecosystem Construction
-
SDN Technology Evolution: The materials highlight SDN's advantages including control-forwarding plane separation as its core characteristic, centralized control capabilities, and open interface architecture. These features address traditional network investment cost concerns and management complexity. Integration with NFV (Network Functions Virtualization) may contribute to hardware cost reductions in telecommunications infrastructure.
-
BAT Technology Development: The materials describe BAT enterprises' emphasis on core technology advantages, though specific technical upgrades are not enumerated. Their competitive strength appears in customer demand discovery and product line expansion from initial single offerings.
-
Ecosystem Comparison: For SDN, applications span data center services, cloud infrastructure (including OpenStack implementations), and network automation platforms. The materials do not provide information regarding DeFi, NFT, payment systems, or smart contract implementations for either SDN or BAT in the cryptographic asset context.
Macroeconomic Environment and Market Cycles
-
Performance Under Inflation: The reference materials do not contain data comparing SDN or BAT performance characteristics during inflationary periods.
-
Macroeconomic Monetary Policy: The materials reference infrastructure investment scales and CAPEX/OPEX considerations (such as data center server investments and operational electricity costs), though specific relationships between interest rates, dollar index movements, and SDN or BAT valuations are not addressed.
-
Geopolitical Factors: The materials discuss international submarine cable construction under Belt and Road Initiative contexts, emphasizing cross-border connectivity requirements and international communication bandwidth demands. However, direct connections to SDN or BAT investment value implications regarding geopolitical developments are not established in the provided documentation.
III. 2026-2031 Price Forecast: SDN vs BAT
Short-term Forecast (2026)
- SDN: Conservative $0.012407 - $0.01306 | Optimistic $0.01306 - $0.0167168
- BAT: Conservative $0.103095 - $0.1185 | Optimistic $0.1185 - $0.13746
Medium-term Forecast (2028-2029)
- SDN may enter a consolidation phase, with projected price range of $0.01419460056 - $0.02044698414
- BAT may enter a growth phase, with projected price range of $0.1119703419 - $0.184060836
- Key drivers: institutional capital flows, ETF adoption, ecosystem development
Long-term Forecast (2030-2031)
- SDN: Baseline scenario $0.021049870628036 - $0.024449046153304 | Optimistic scenario $0.024449046153304 - $0.027994157845533
- BAT: Baseline scenario $0.1324133654184 - $0.19909247094 | Optimistic scenario $0.19909247094 - $0.1912637500488
View detailed price predictions for SDN and BAT
Disclaimer
SDN:
| Year |
Predicted High Price |
Predicted Average Price |
Predicted Low Price |
Price Change |
| 2026 |
0.0167168 |
0.01306 |
0.012407 |
0 |
| 2027 |
0.018908268 |
0.0148884 |
0.00818862 |
14 |
| 2028 |
0.02044698414 |
0.016898334 |
0.01419460056 |
29 |
| 2029 |
0.0192328388421 |
0.01867265907 |
0.0100832358978 |
42 |
| 2030 |
0.024449046153304 |
0.01895274895605 |
0.01137164937363 |
45 |
| 2031 |
0.027994157845533 |
0.021700897554677 |
0.021049870628036 |
66 |
BAT:
| Year |
Predicted High Price |
Predicted Average Price |
Predicted Low Price |
Price Change |
| 2026 |
0.13746 |
0.1185 |
0.103095 |
0 |
| 2027 |
0.1330992 |
0.12798 |
0.070389 |
7 |
| 2028 |
0.17622846 |
0.1305396 |
0.114874848 |
9 |
| 2029 |
0.184060836 |
0.15338403 |
0.1119703419 |
29 |
| 2030 |
0.19909247094 |
0.168722433 |
0.13160349774 |
42 |
| 2031 |
0.1912637500488 |
0.18390745197 |
0.1324133654184 |
54 |
IV. Investment Strategy Comparison: SDN vs BAT
Long-term vs Short-term Investment Strategies
-
SDN: May be suitable for investors interested in multi-chain infrastructure development and decentralized application ecosystems. The token's association with Kusama Network positioning and support for Ethereum Virtual Machine and WebAssembly technologies suggests alignment with investors evaluating Layer2 solution implementations and cross-chain interoperability developments.
-
BAT: May be suitable for investors evaluating digital advertising transformation and browser ecosystem adoption patterns. The token's integration with Brave browser infrastructure and advertiser-user incentive mechanisms suggests relevance for those assessing user attention economy models and privacy-focused browsing trends.
Risk Management and Asset Allocation
-
Conservative investors: A potential allocation framework might consider SDN 20-30% vs BAT 70-80%, reflecting BAT's longer operational history since 2017 and established browser ecosystem presence compared to SDN's 2021 launch.
-
Aggressive investors: A potential allocation framework might consider SDN 60-70% vs BAT 30-40%, reflecting higher risk tolerance for multi-chain infrastructure speculation and acceptance of SDN's greater historical price volatility from $8.36 peak to current levels.
-
Hedging instruments: Stablecoin allocations for liquidity management, options strategies for downside protection, and cross-asset portfolio diversification across different crypto sectors may be considered as part of comprehensive risk management approaches.
V. Potential Risk Comparison
Market Risks
-
SDN: The asset has experienced a decline from $8.36 in September 2021 to $0.01306 as of February 4, 2026. Current 24-hour trading volume of $5,413.01 suggests limited liquidity conditions. The extreme fear sentiment (Fear & Greed Index: 17) in broader crypto markets may amplify volatility exposure for lower-liquidity assets.
-
BAT: The asset has experienced a decline from $1.90 in November 2021 to $0.1187 as of February 4, 2026. While 24-hour trading volume of $32,421.45 indicates relatively higher liquidity compared to SDN, the asset remains subject to broader market sentiment dynamics and correlation with major crypto market movements.
Technical Risks
-
SDN: Scalability considerations related to multi-chain infrastructure implementation, network stability requirements for supporting Ethereum Virtual Machine and WebAssembly environments, and dependency on Kusama Network architecture developments may present technical risk factors.
-
BAT: Integration dependencies with Brave browser adoption rates, potential technical limitations in advertiser-user matching mechanisms, and security considerations related to user data privacy protection within the attention economy model may constitute technical risk exposures.
Regulatory Risks
- Global regulatory developments may affect SDN and BAT differently based on their distinct use cases. Multi-chain infrastructure projects like SDN may face scrutiny related to cross-chain transaction monitoring and decentralized application oversight. Digital advertising tokens like BAT may encounter regulatory attention regarding user data handling, advertising standards compliance, and browser-based payment processing requirements. Evolving policy frameworks across different jurisdictions may create asymmetric regulatory impacts on the two assets.
VI. Conclusion: Which Is the Better Buy?
📌 Investment Value Summary:
-
SDN advantages: Multi-chain infrastructure positioning with support for Ethereum Virtual Machine and WebAssembly technologies, association with Kusama Network ecosystem, and theoretical upside potential from current price levels relative to historical ranges.
-
BAT advantages: Established operational history since 2017, integration with Brave browser ecosystem providing tangible use case implementation, and relatively higher trading liquidity compared to SDN based on 24-hour volume metrics.
✅ Investment Recommendations:
-
Novice investors: May consider prioritizing assets with clearer use case documentation and higher liquidity profiles. Understanding fundamental differences between multi-chain infrastructure (SDN) and browser-based advertising economy (BAT) models is essential before allocation decisions.
-
Experienced investors: May evaluate portfolio diversification opportunities by assessing correlation patterns between multi-chain infrastructure exposure (SDN) and digital advertising sector exposure (BAT). Technical due diligence regarding ecosystem development progress and adoption metrics may inform allocation strategies.
-
Institutional investors: May conduct comprehensive analysis of regulatory compliance frameworks, liquidity depth for position sizing, and alignment with institutional mandate parameters. Evaluation of both assets' ecosystem maturity stages and market structure characteristics may be relevant for institutional portfolio construction.
⚠️ Risk Disclosure: Cryptocurrency markets exhibit extreme volatility characteristics. This content does not constitute investment advice. Market participants should conduct independent research and risk assessment appropriate to their individual circumstances.
VII. FAQ
Q1: What is the main difference between SDN and BAT in terms of their core use cases?
SDN (Shiden Network) functions as a multi-chain decentralized application layer on Kusama Network, primarily supporting infrastructure for DeFi and NFT applications through Ethereum Virtual Machine and WebAssembly compatibility. BAT (Basic Attention Token), on the other hand, operates within the digital advertising economy, specifically designed to facilitate value exchange between advertisers and users through the Brave browser ecosystem. The fundamental distinction lies in SDN's focus on blockchain infrastructure scalability versus BAT's concentration on transforming user attention monetization in web browsing.
Q2: Why has SDN experienced a larger percentage decline from its all-time high compared to BAT?
SDN declined approximately 99.84% from its September 2021 peak of $8.36 to $0.01306 as of February 4, 2026, while BAT declined approximately 93.75% from its November 2021 high of $1.90 to $0.1187. The more severe correction in SDN reflects multiple factors: its later market entry (2021 versus BAT's 2017 launch) coinciding with peak market euphoria, lower liquidity evidenced by 24-hour trading volume of $5,413.01 versus BAT's $32,421.45, and potentially higher speculative premium associated with multi-chain infrastructure narratives during the 2021 cycle. Additionally, SDN's dependency on Kusama Network ecosystem development may have introduced additional volatility compared to BAT's more established browser integration model.
Q3: Which asset is more suitable for conservative investors in the current market environment?
BAT appears more aligned with conservative investment criteria based on several observable metrics: longer operational history since 2017 providing extended track record analysis, approximately six times higher trading liquidity ($32,421.45 versus $5,413.01 daily volume) enabling better position entry and exit capabilities, and established real-world utility through Brave browser integration with measurable adoption metrics. The suggested conservative allocation framework of 70-80% BAT versus 20-30% SDN reflects these considerations, acknowledging that both assets carry substantial cryptocurrency market risks given the extreme fear sentiment (Fear & Greed Index: 17) and significant declines from historical peaks.
Q4: What are the key technical risks that differentiate SDN from BAT?
SDN faces technical risks centered on multi-chain infrastructure complexity, including scalability challenges in supporting concurrent Ethereum Virtual Machine and WebAssembly environments, network stability dependencies tied to Kusama Network architecture evolution, and technical execution risks related to Layer2 solution implementations. BAT's technical risk profile differs significantly, focusing on browser ecosystem dependencies including Brave adoption rate fluctuations, potential technical limitations in advertiser-user matching algorithm effectiveness, and security considerations surrounding user privacy protection within the attention economy model. These divergent technical risk profiles stem from fundamentally different technological architectures—blockchain infrastructure versus browser-integrated payment systems.
Q5: How might regulatory developments impact SDN and BAT differently?
Regulatory impacts may diverge significantly due to distinct use case classifications. SDN, as multi-chain infrastructure supporting decentralized applications, may encounter regulatory scrutiny related to cross-chain transaction monitoring frameworks, decentralized application oversight requirements, and potential securities classification considerations for infrastructure tokens. BAT faces a different regulatory landscape centered on digital advertising standards, user data privacy protection requirements under frameworks like GDPR or emerging equivalents, and browser-based payment processing regulations that may intersect with both financial services and consumer protection mandates. These asymmetric regulatory exposures suggest that jurisdiction-specific policy developments could affect the two assets' operational environments and compliance costs differently.
Q6: What drives the price forecast differences between SDN and BAT for 2030-2031?
The 2030-2031 forecasts show SDN baseline scenario ranging $0.0210-$0.0244 (optimistic: $0.0244-$0.0280) versus BAT baseline scenario $0.1324-$0.1991 (optimistic: $0.1991-$0.1913). BAT's higher absolute price projections reflect several factors: larger current market capitalization providing more stable valuation foundation, established revenue-generating ecosystem through advertiser payments in Brave browser, and longer historical data enabling more confidence in growth trajectory modeling. SDN's projections indicate potential percentage gains but from a significantly lower base, reflecting higher uncertainty regarding multi-chain infrastructure adoption rates, competitive positioning among Layer2 solutions, and ecosystem development execution risks. The forecast divergence fundamentally captures different maturity stages and business model validation levels between the two assets.
Q7: Which asset offers better liquidity for short-term trading strategies?
BAT demonstrates superior liquidity metrics for short-term trading implementation, with 24-hour trading volume of $32,421.45 compared to SDN's $5,413.01—approximately six times greater market depth. This liquidity differential translates to tighter bid-ask spreads, reduced slippage on position entries and exits, and lower market impact costs for moderate position sizes. For traders executing strategies dependent on rapid position adjustments or requiring predictable execution prices, BAT's higher liquidity profile presents material advantages. However, both assets exhibit relatively modest absolute trading volumes compared to major cryptocurrencies, suggesting that even BAT may face liquidity constraints for larger institutional position sizing or high-frequency trading strategies.
Q8: How should investors interpret the extreme fear sentiment (Fear & Greed Index: 17) when evaluating SDN versus BAT?
The extreme fear reading of 17 on the Fear & Greed Index indicates severely depressed market sentiment that historically correlates with potential accumulation opportunities but also heightened downside volatility risk. For SDN versus BAT evaluation, this environment suggests several considerations: lower-liquidity assets like SDN may experience disproportionate selling pressure during fear episodes due to limited buy-side depth, while BAT's relatively higher liquidity may provide modest cushioning against panic-driven price dislocations. However, extreme fear conditions often precede both further declines and eventual reversals, making timing critical. Investors should recognize that both assets remain highly correlated with broader cryptocurrency market sentiment, and the current extreme fear reading suggests elevated probability of continued volatility regardless of individual asset fundamentals. Risk management through position sizing appropriate to personal risk tolerance becomes particularly critical in such market conditions.
* The information is not intended to be and does not constitute financial advice or any other recommendation of any sort offered or endorsed by Gate.